
Why MNI
MNI is the leading provider
of intelligence and analysis on the Global Fixed Income, Foreign Exchange and Energy markets. We use an innovative combination of real-time analysis, deep fundamental research and journalism to provide unique and actionable insights for traders and investors. Our "All signal, no noise" approach drives an intelligence service that is succinct and timely, which is highly regarded by our time constrained client base.Our Head Office is in London with offices in Chicago, Washington and Beijing, as well as an on the ground presence in other major financial centres across the world.
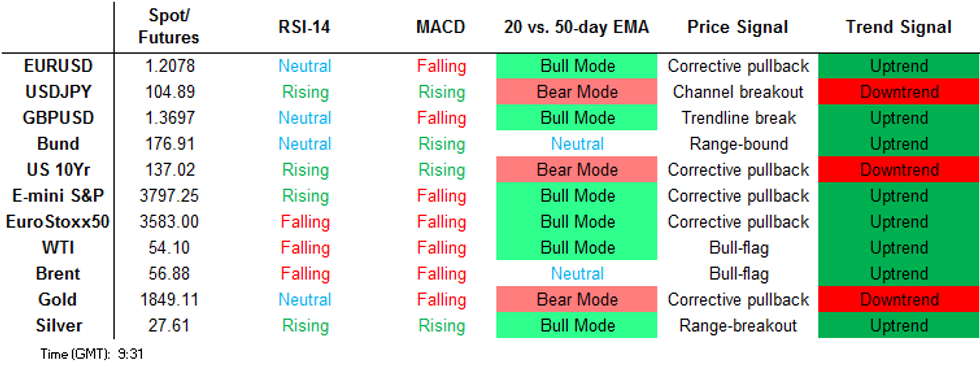
Price Signal Summary - Silver Rally Tests $30.00
- In the FX space, USDJPY remains firm following last week's two important resistance levels:
- The bear channel resistance drawn off the Mar 24 high and 104.40, Nov 11 high. The break highlights a key reversal and an important shift in sentiment. The focus is on 105.16 High Nov 13.
- EURUSD is softer but remains within the range defined by its key directional triggers. They are: support at 1.2054, Jan 18 low and 1.2190 resistance, Jan 22 high.
- EURGBP is softer with the focus on a break of 0.8800, to open 0.8759, the May 12, 2020 low.
- On the commodity front, Gold directional triggers are resistance at $1875.2, Jan 21 high and support at $1831.5, Jan 27 low.
- Oil contracts remain above support. Brent (J1) support is $54.40, Jan 22 low and WTI (H1) support lies at $51.44, Jan 22 low.
In the FI space:
- Bunds (H1) have slipped through key support at 176.85, the trendline drawn off the Jan 12 low.
- Gilts (H1) have also weakened, breaking through support at 133.79, the Jan 21 low.
In equities, E-mini S&P futures traded lower last week and remain vulnerable despite the bounce so far today off the Asia-Pac low. Support to watch is at 3656.50, the overnight low with resistance seen at 3773.61, the 20-day EMA.
Tech Focus: Silver rallied sharply Monday and in the process probed the key psychological $30.00 handle.
The print above $30.00 confirms a fresh trend high and a likely resumption of the broader uptrend that began off the March 2020 low.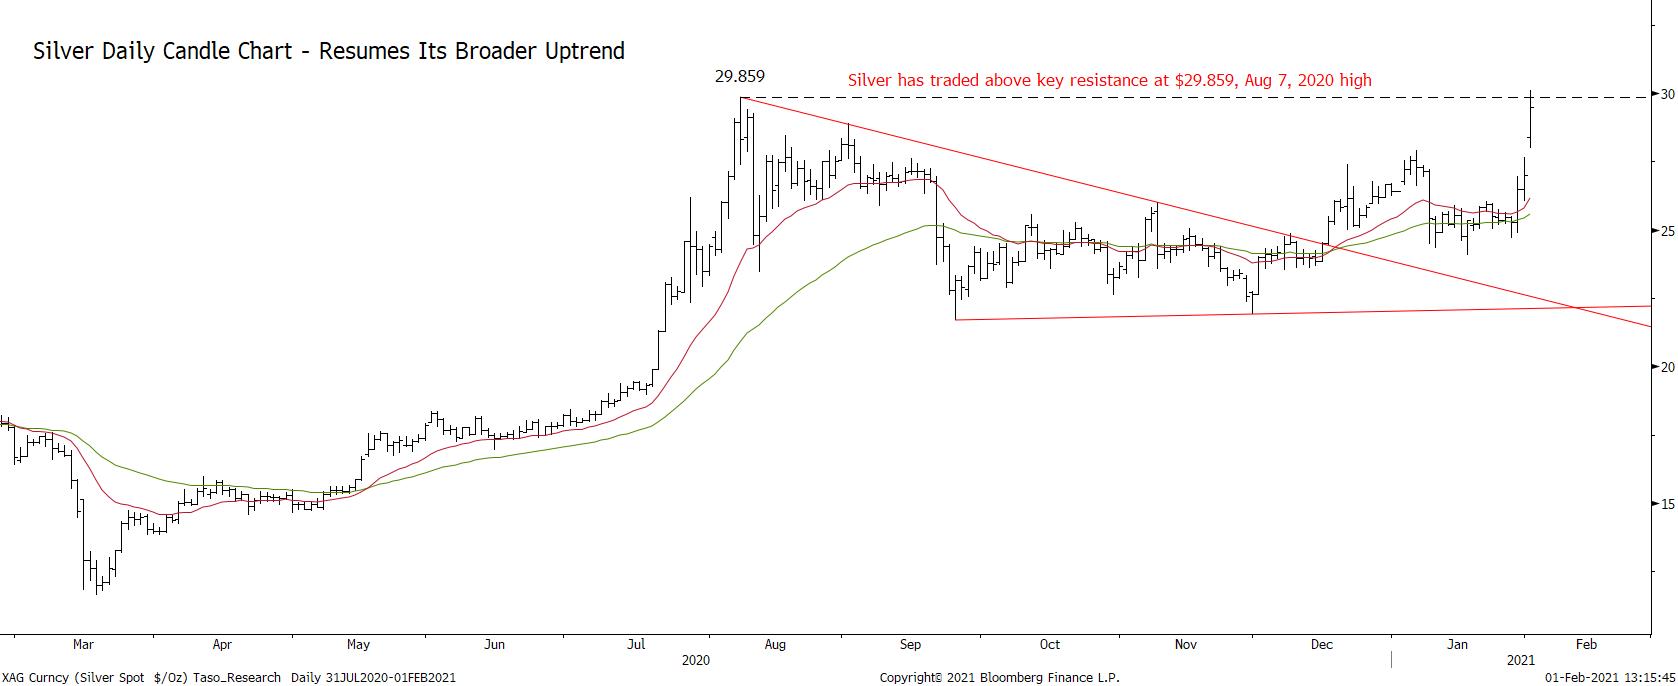
Volatility is likely to remain elevated though and the risk that recent gains are quickly erased remains present. Key support levels going forward include the 20-day EMA at $25.788. On the upside, an extension higher would open $30.723, the 50.0% retracement of the 2011 - 2020 downtrend. The chart below highlights the retracement thus far of this major bearish leg. 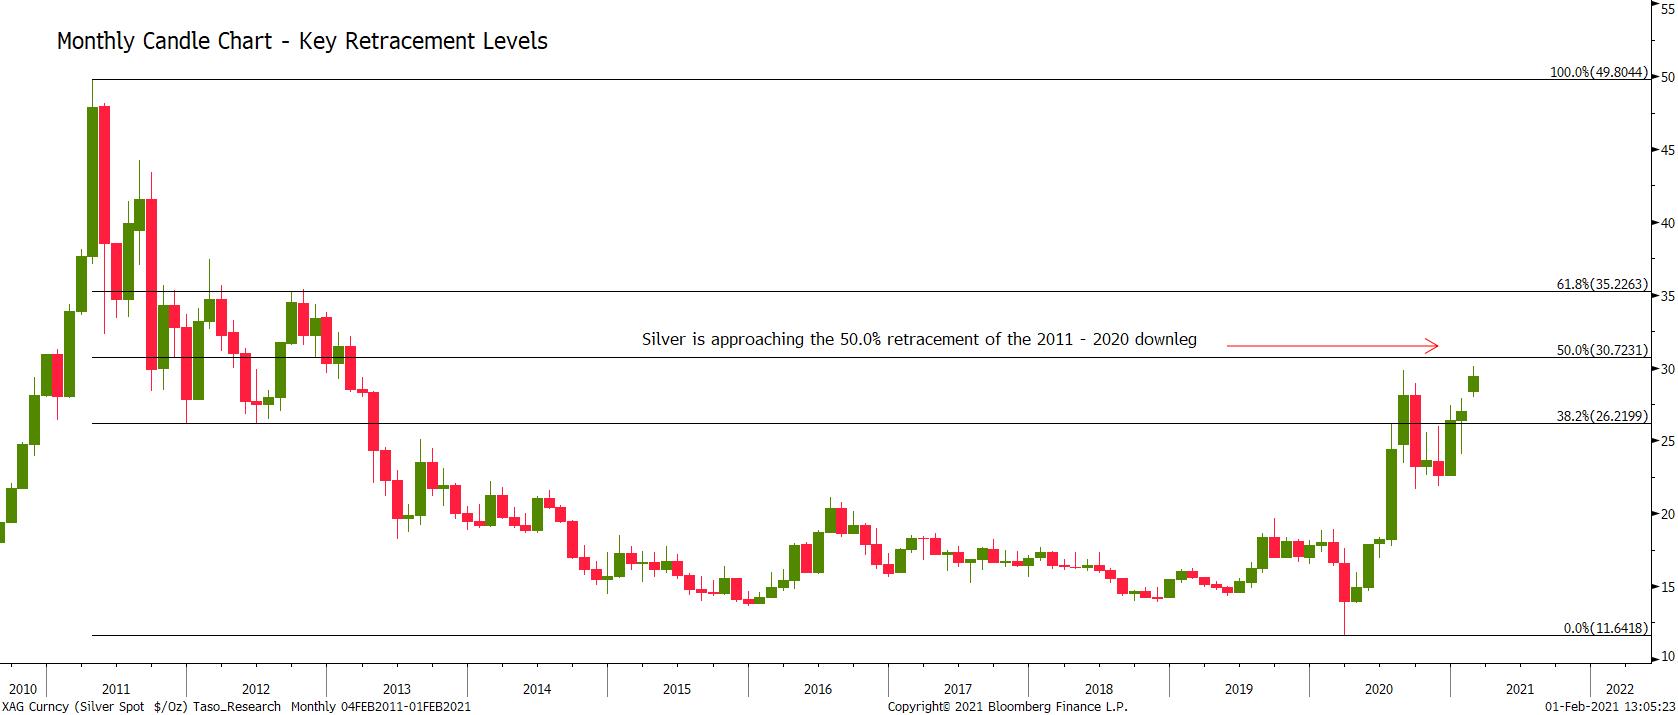
FOREIGN EXCHANGE
EURUSD TECHS: Eyeing Key Support
- RES 4: 1.2353 High Apr 20, 2018
- RES 3: 1.2349 High Jan 6
- RES 2: 1.2230/85 High Jan 11 / 8
- RES 1: 1.2190 High Jan 22
- PRICE: 1.2067 @ 06:03 GMT Feb 2
- SUP 1: 1.2054 Low Jan 18 and the bear trigger
- SUP 2: 1.2011 High Sep 1 and a former breakout level
- SUP 3: 1.1976 50.0% retracement of the Nov 4 - Jan 6 rally
- SUP 4: 1.1887 2.0% 10-dma envelope
EURUSD traded lower Monday. Attention is on support at the Jan 18 low of 1.2054. A break would confirm a resumption of the downleg that started off the Jan 6 high. This would clear the way for a move towards 1.2011, Sep 1 high and the psychological 1.2000 handle. A breach of 1.2000 would open 1.1976, a Fibonacci retracement. On the upside, clearance of 1.2190, Jan 22 high is required to reinstate a bullish theme.
GBPUSD TECHS: Bullish Focus
- RES 4: 1.3935 High Apr 27, 2018
- RES 3: 1.3804 High Apr 30, 2018
- RES 2: 1.3773 High May 1, 2018
- RES 1: 1.3759 High Jan 27 and the bull trigger
- PRICE: 1.3684 @ 06:13 GMT Feb 2
- SUP 1: 1.3610 Low Jan 26
- SUP 2: 1.3520 Low Jan 18, 50-day EMA and key near-term support
- SUP 3: 1.3505 Low Jan 12
- SUP 4: 1.3452 Low Jan 11
GBPUSD maintains a bullish stance. The pair traded to a fresh high of 1.3759 last week, reinforcing bullish conditions and maintaining the current bullish price sequence of higher highs and higher lows. Attention is on 1.3773 next, May 1 2018 high. Near-term firm support has been defined at 1.3520, Jan 18 low. A breach would signal scope for a deeper short-term sell-off and expose 1.3452, Jan 11 low. Initial support lies at 1.3610, Jan 26.
EURGBP TECHS: Bearish Trend Conditions Dominate
- RES 4: 0.9093 High Dec 29
- RES 3: 0.9085 High Jan 6
- RES 2: 0.8955/96 50-day EMA / High Jan 12
- RES 1: 0.8900/25 20-day EMA / High Jan 18 and key resistance
- PRICE: 0.8824 @ 06:16 GMT Feb 2
- SUP 1: 0.8805 Low Feb 1
- SUP 2: 0.8773 1.0% 10-dma envelope
- SUP 3: 0.8759 Low May 12, 2020
- SUP 4: 0.8684 2.0% 10-dma envelope
EURGBP's bearish case firmed Monday as the cross printed a new 2021 low. Further weakness is seen likely with the focus on the 0.8800 handle and 0.8759. The latter is the May 12, 2020 low. Moving average studies are also pointing south reinforcing current trend conditions. On the upside, a firm resistance has been defined at 0.8925, the Jan 18 high where a break is still required to ease the bearish pressure.
USDJPY TECHS: Needle Points North
- RES 4: 106.05 1.50 proj of the Jan 6 - 11 rally from the Jan 21 low
- RES 3: 105.68 High Nov 11 and a key resistance
- RES 2: 105.16 High Nov 13
- RES 1: 105.04 High Feb 1
- PRICE: 104.96 @ 06:06 GMT Feb 2
- SUP 1: 104.40 High Jan 11 and recent breakout level
- SUP 2: 103.81 Former channel top drawn off the Mar 2020 high
- SUP 3: 103.33 Low Jan 21
- SUP 4: 103.28/02 61.8% and 76.4 % of the Jan 6 - 11 rally
USDJPY bullish conditions remain intact following last week's price developments and the pair is holding onto recent gains. On Jan 27 USDJPY confirmed a clear break of a bear channel resistance drawn off the Mar 2020 high. Resistance at 104.40 gave way on Jan 28, confirming a resumption of the uptrend that started Jan 6 and this also reinforces the significance of the channel breakout. The focus is on 105.68, Nov 11 high. Support is at 104.40.
EURJPY TECHS: Eyeing The January High
- RES 4: 128.39 High Dec 20. 2018
- RES 3: 127.88 0.618 projection of May - Jun rally from Oct 30 low
- RES 2: 127.49/50 High Jan 7 / High Mar 1, 2019
- RES 1: 127.34 High Jan 29
- PRICE: 126.73 @ 06:23 GMT Feb 2
- SUP 1: 126.26 20-day EMA
- SUP 2: 125.60 Low Jan 27
- SUP 3: 125.09 Low Jan 18
- SUP 4: 124.85 100-DMA
EURJPY maintains a bullish tone despite trading softer yesterday. Last week's strength reinforces the current positive theme with attention on resistance at 127.49, Jan 7 high. A break of this hurdle would confirm a resumption of the broader uptrend that has been in place since early May 2020. This would open 127.88 initially, a Fibonacci projection. On the downside, initial support is at 126.26, the 20-day EMA.
AUDUSD TECHS: Bearish Focus
- RES 4: 0.7917 High Mar 14, 2018 and a key resistance
- RES 3: 0.7885 High Mar 15. 2018
- RES 2: 0.7782/7820 High Jan 21 / High Jan 6 and the bull trigger
- RES 1: 0.7704 High Jan 29
- PRICE: 0.7616 @ 06:28 GMT Feb 2
- SUP 1: 0.7593/92 50-day EMA / Low Jan 28
- SUP 2: 0.7557 Low Dec 28
- SUP 3: 0.7517 Low Dec 22
- SUP 4: 0.7462 Low Dec 21
AUDUSD maintains a bearish tone following last week's move lower. Recent weakness saw the pair trade below support at 0.7659, Jan 18 low. Scope is seen for a deeper pullback as part of a corrective cycle with momentum studies trending down and unwinding a recent overbought reading. Attention is on 0.7593/92, the 50-day EMA and Jan 28 low, where a break would strengthen a bearish case. On the upside, 0.7782 marks a firm resistance.
USDCAD TECHS: Bullish Corrective Cycle Still In Play
- RES 4: 1.2998 2.0% 10-dma envelope
- RES 3: 1.2957 High Dec 21 and key resistance
- RES 2: 1.2915 High Dec 23
- RES 1: 1.2881 High Jan 28
- PRICE: 1.2831 @ 06:33 GMT Feb 2
- SUP 1: 1.2738 Low Jan 29
- SUP 2: 1.2686 Low Jan 27
- SUP 3: 1.2635 Low Jan 22
- SUP 4: 1.2590 Low Jan 21 and major support
USDCAD maintains a bullish stance and appears set to extend the current corrective recovery following a recent rebound off cycle lows at 1.2590. The recent break of resistance at 1.2799, Jan 18 high and a move through the 50-day EMA signals scope for an extension higher. Prices last week topped resistance at 1.2880, Dec 24 high exposing 1.2957, the Dec 21 high. On the downside, firm near-term support is seen at 1.2686, Jan 27 low.
COMMODITIES
BRENT TECHS: (J1) Approaching Key Resistance
- RES 4: $60.00 - Round number resistance
- RES 3: $59.71 - 1.382 proj of the Apr - Aug - Nov 2020 price swing
- RES 2: $58.59 - 76.4% of the Jan - Apr 2020 sell-off (cont)
- RES 1: $57.31 - High Jan 13 and the bull trigger
- PRICE: $56.98 @ 06:50 GMT Feb 2
- SUP 1: $54.40 - Low Jan 22
- SUP 2: $52.90 - Low Jan 6
- SUP 3: $52.18 - 50-day EMA
- SUP 4: $50.66 - Low Jan 4
Brent futures started the week on a firm note but still trade below this year's high of $57.31. Clearance of this hurdle would confirm a resumption of the uptrend and pave the way for strength towards $58.59, a Fibonacci retracement. Key support has been defined at $54.40, Jan 22 low. A breach would allow for a deeper corrective decline Note a break of $54.40 would also see price trade through the 20-day EMA.
WTI TECHS: (H1) Resumes Its Uptrend
- RES 4: $56.52 - 1.236 proj of Apr - Aug rally from the Nov 2 low
- RES 3: $55.00 - Round number resistance
- RES 2: $54.50 - High Feb 20, 2020 and a key resistance (cont)
- RES 1: $54.32 - Intraday high
- PRICE: $54.09 @ 07:06 GMT Feb 2
- SUP 1: $51.44 - Low Jan 22
- SUP 2: $50.86 - Low Jan 8
- SUP 3: $49.52 - High Dec 18 and a former breakout level
- SUP 4: $49.16 - 50-day EMA
WTI futures started the week on a firm note and have extended gains overnight. Importantly, futures have traded above resistance at $53.94, Jan 13 high and a bull trigger. The breach of this level confirms a resumption of the underlying uptrend and paves the way for strength towards $54.50 next, Feb 20, 2020 high (cont). Key support remains $51.44, Jan 22 low where a break would signal a top.
GOLD TECHS: Still Stuck In A Range
- RES 4: $1900.3 - 61.8% retracement of the Jan 6 - 11 rally
- RES 3: $1882.0 - 50.0% retracement of the Jan 6 - 11 rally
- RES 2: $1875.7 - High Jan 29 and key resistance
- RES 1: $1864.1 - Intraday high
- PRICE: $1854.8 @ 07:08 GMT Feb 2
- SUP 1: $1831.5 - Low Jan 27 and a bear trigger
- SUP 2: $1804.7 - Low Jan 18 and key support
- SUP 3: $1800.0 - Round number support
- SUP 4: $1775.9 - Low Dec 1
Gold remains below the Jan 29 high of $1875.7 and continues to trade within a range. Last week's pullback resulted in a test of $1832.6, Jan 20 low. A clear break of this level would strengthen a bearish case and undermine recent bullish price development. Furthermore, this would suggest scope for a move towards the key support at $1804.7, Jan 18 low. On the upside, clearance of $1875.7 would instead be bullish and open $1882.0 initially.
SILVER TECHS: Volatile
- RES 4: $31.513 - 1.236 proj of Nov 30 - Jan 6 rally from Jan 18 low
- RES 3: $30.723 - 50.0% retracement of the 2011 - 2020 downtrend
- RES 2: $30.100 - High Feb 1
- RES 1: $29.053 - Intraday high
- PRICE: $28.073 @ 07:37 GMT Feb 2
- SUP 1: $27.698 - Intraday low
- SUP 2: $27.079 - 50.0% retracement of the Jan 18 - Feb 1 rally
- SUP 3: $26.099 - 20-day EMA
- SUP 4: $24.700 - Low Jan 27
Silver traded sharply higher yesterday clearing resistance at $27.931, Jan 6 high. The climb resulted in a test of $30.00 and more importantly registered a fresh trend high print of the upleg that started mid-March last year. Today's price action highlights a reversal yesterday's direction though and Silver has traded below the $28.00 mark. Activity is volatile and further weakness would open 27.079, a Fibonacci retracement. Key resistance is at $30.100.
FIXED INCOME
BUND TECHS: (H1) Short-Term Trend Support Remains Intact
- RES 4: 178.37 High Jan 4 and a key resistance
- RES 3: 178.27 High Jan 5
- RES 2: 178.12 High Jan 27 and the bull trigger
- RES 1: 177.66 High Jan 29
- PRICE: 177.14 @ 04:59 GMT Feb 2
- SUP 1: 176.89/88 Low Jan 29 / Trendline drawn off the Jan 12 low
- SUP 2: 176.63 Low Jan 22
- SUP 3: 176.34 Low Jan 12 and the bear trigger
- SUP 4: 175.84 Low Nov 11 and a key support
Bund futures are trading closer to the lower end of the recent range with initial support at 176.89, Jan 29 low. A short-term trendline support lies just below at 176.88, drawn off the Jan 12 low. A break of 176.89/88 is required to strengthen a bearish case. This would signal scope for weakness towards 176.63, Jan 22 low and the more important support at 176.34, Jan 12 low. Key resistance and the bull trigger has been defined at 178.12, Jan 27 high.
BOBL TECHS: (H1) Attention Is On Support
- RES 4: 135.610 High Dec 15
- RES 3: 135.497 76.4% retracement of the Dec 11 - Jan 12 downleg
- RES 2: 135.480 High Jan 27
- RES 1: 135.370 High Jan 29
- PRICE: 135.200 @ 05:00GMT Feb 2
- SUP 1: 135.150 Low Feb
- SUP 2: 135.120 Low Jan 25 and key intraday support
- SUP 3: 134.930 Low Jan 22
- SUP 4: 134.840 Low Jan 12 and a bear trigger
BOBL futures rallied Jan 27 to confirm a clear breach of 135.350, Jan 15 high. Despite the recent pullback, the rally reinforces a bullish theme and signals scope for a climb to 135.497, a Fibonacci retracement. Clearance of 135.497 would strengthen a bullish case for gains towards 135.700, the Dec 11 high. Initial support is seen at 135.120, Jan 25 low. A break would undermine the positive price structure and expose 134.970, Jan 22 low.
SCHATZ TECHS: (H1) Triple Bottom Reversal Still In Play
- RES 4: 112.399 76.4% retracement of the Dec 11 - 28 downleg
- RES 3: 112.390 High Dec 16
- RES 2: 112.368 61.8% retracement of the Dec 11 - 28 downleg
- RES 1: 112.335 High Jan 1
- PRICE: 112.305 @ 04:35 GMT Feb 2
- SUP 1: 112.295 Low Jan 27 / Low Feb 1
- SUP 2: 112.270 Low Jan 25
- SUP 3: 112.240 Low Jan 12, 21 and 22 low
- SUP 4: 112.235 Low Dec 23 and the bear trigger
Schatz futures traded higher Jan 27 and confirmed a break of resistance at 112.330 in the process, Jan 4, 5 and 15 highs. The break also confirmed a triple bottom reversal pattern highlighting a short-term shift in sentiment. This signals scope for a stronger recovery with the focus on 112.368 next, a Fibonacci retracement and 112.390, the Dec 16 high. The outlook remains bullish despite the most recent pullback. Initial support lies at 112.295.
GILT TECHS: (H1) Vulnerable Following Recent Weakness
- RES 4: 135.16 High Jan 6
- RES 3: 135.04 61.8% retracement of the Jan 4 - 12 downleg
- RES 2: 134.95 High Jan 27/28
- RES 1: 134.47 High Jan 29
- PRICE: 134.07 @ Close Feb 1
- SUP 1: 133.74/79 Low Feb 1 and key intraday support / Low Jan 21
- SUP 2: 133.55 Low Jan 11 and the bear trigger
- SUP 3: 133.52 Low Dec 2
- SUP 4: 133.22 1.382 projection of Dec 11 - 24 sell-off from Jan 4 high
Recent weakness in Gilt futures have erased all the gains achieved between Jan 21 - 28. A short-term trendline drawn off the Jan 12 low was breached Friday - the line intersected at 134.00. A break of yesterday's low of 133.74 would strengthen a bearish case and open 133.55, Jan 11 low and a key support. On the upside, initial resistance is at 134.47, Jan 29 high. Key resistance has been defined at 134.95, the Jan 27/28 high.
BTP TECHS: (H1) Monitoring Trendline Resistance
- RES 4: 152.67 High Jan 8 and key resistance
- RES 3: 152.45 High Jan 11
- RES 2: 152.14 High Jan 20
- RES 1: 151.54 High Feb 1 and a trendline drawn off Jan 8 high
- PRICE: 151.36 @ Close Feb 1
- SUP 1: 150.43 Low Jan 26
- SUP 2: 149.57 Low Jan 22 and bear trigger
- SUP 3: 149.09 Low Nov 11 (cont)
- SUP 4: 148.82 50.0% retracement of the Sep - Jan rally (cont)
BTP futures outlook remains bearish despite the recent recovery from 149.57, Jan 22 low. The contract confirmed a top in the trend on Jan 8 at 152.67. The subsequent move lower also confirmed a bearish price sequence of lower lows and lower highs. The recent move through 150.00 signals scope for weakness towards 149.09, Nov 11 low (cont). Firm resistance is at 151.54, a trendline resistance drawn off the Jan 8 high.
EQUITIES
EUROSTOXX 50 Techs: Still Vulnerable
- RES 4: 3668.70 High Feb 25
- RES 3: 3657.83 High Jan 8 and the bull trigger
- RES 2: 3621.49 High Jan 25
- RES 1: 3571.47 20-day EMA
- PRICE: 3530.85 @ Close Feb 1
- SUP 1: 3473.76 Low Jan 28
- SUP 2: 3455.94 Low Dec 22
- SUP 3: 3401.14 Low Dec 21 and a key support
- SUP 4: 3396.02 High Sep 3, 2020
EUROSTOXX 50 remains near recent lows following last week's sell-off and extension of the pullback from 3657.83, Jan 8 high. The move lower on Jan 27 saw the index trade through 3524.63, Jan 5 low and the 50-day EMA. This reinforces a bearish case and opens 3455.94, the Dec 22 low. On the upside, key resistance and the bull trigger remains 3657.83. A break would resume the underlying uptrend. Initial firm resistance is seen at 3571.47.
Why MNI
MNI is the leading provider
of intelligence and analysis on the Global Fixed Income, Foreign Exchange and Energy markets. We use an innovative combination of real-time analysis, deep fundamental research and journalism to provide unique and actionable insights for traders and investors. Our "All signal, no noise" approach drives an intelligence service that is succinct and timely, which is highly regarded by our time constrained client base.Our Head Office is in London with offices in Chicago, Washington and Beijing, as well as an on the ground presence in other major financial centres across the world.