-
Policy
Policy
Exclusive interviews with leading policymakers that convey the true policy message that impacts markets.
LATEST FROM POLICY: -
EM Policy
EM Policy
Exclusive interviews with leading policymakers that convey the true policy message that impacts markets.
LATEST FROM EM POLICY: -
G10 Markets
G10 Markets
Real-time insight on key fixed income and fx markets.
Launch MNI PodcastsFixed IncomeFI Markets AnalysisCentral Bank PreviewsFI PiFixed Income Technical AnalysisUS$ Credit Supply PipelineGilt Week AheadGlobal IssuanceEurozoneUKUSDeep DiveGlobal Issuance CalendarsEZ/UK Bond Auction CalendarEZ/UK T-bill Auction CalendarUS Treasury Auction CalendarPolitical RiskMNI Political Risk AnalysisMNI Political Risk - US Daily BriefMNI Political Risk - The week AheadElection Previews -
Emerging Markets
Emerging Markets
Real-time insight of emerging markets in CEMEA, Asia and LatAm region
-
Commodities
-
Credit
Credit
Real time insight of credit markets
-
Data
-
Global Macro
Global Macro
Actionable insight on monetary policy, balance sheet and inflation with focus on global issuance. Analysis on key political risk impacting the global markets.
Global MacroDM Central Bank PreviewsDM Central Bank ReviewsEM Central Bank PreviewsEM Central Bank ReviewsBalance Sheet AnalysisData AnalysisEurozone DataUK DataUS DataAPAC DataInflation InsightEmployment InsightGlobal IssuanceEurozoneUKUSDeep DiveGlobal Issuance Calendars EZ/UK Bond Auction Calendar EZ/UK T-bill Auction Calendar US Treasury Auction Calendar Global Macro Weekly -
About Us
To read the full story
Sign up now for free trial access to this content.
Please enter your details below.
Why MNI
MNI is the leading provider
of intelligence and analysis on the Global Fixed Income, Foreign Exchange and Energy markets. We use an innovative combination of real-time analysis, deep fundamental research and journalism to provide unique and actionable insights for traders and investors. Our "All signal, no noise" approach drives an intelligence service that is succinct and timely, which is highly regarded by our time constrained client base.Our Head Office is in London with offices in Chicago, Washington and Beijing, as well as an on the ground presence in other major financial centres across the world.
Real-time Actionable Insight
Get the latest on Central Bank Policy and FX & FI Markets to help inform both your strategic and tactical decision-making.
Free AccessMNI Europe Morning FX Analysis: Initial Risk-Off Impulse Sets Tone
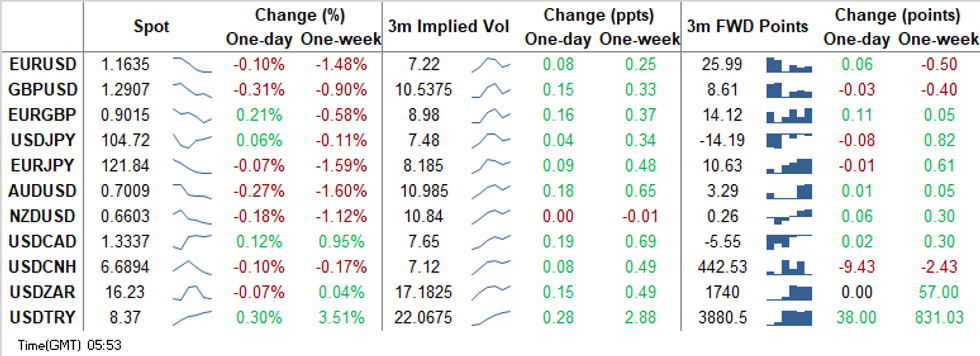
FOREX: Initial Risk-Off Impulse Sets Tone
Initial risk-off impetus set the tone for G10 FX space at the start of the week, even as e-minis recouped losses. A supply-driven slide in oil prices, and deepening lockdowns across mainland Europe & the UK, knocked risk on its head as markets re-opened, with commodity-tied FX landing at the bottom of the G10 pile. The likes of AUD, NZD, CAD & NOK remain the worst performers in the space, while safe havens USD, JPY & CHF firmed up. Data releases out of core Asia-Pac economies provoked little to no reaction, with participants preparing for this week's risks, including the U.S. election & monetary policy decisions from the RBA, FOMC, Norges Bank and BOE.
US clocks went back one hour Sunday. Time difference with the UK back at 5 hours/Europe 6 hours
- GBP took a hit as PM Johnson announced that England will go into a four-week lockdown this Thursday, which could be extended if health data suggests that the spread of new Covid-19 infection has not been contained. Source reports suggesting that the UK & EU are close to reaching agreement over fishing rights may have provided some relief for sterling, but overshadowed by the spectre of impending lockdown.
- CNH edged higher as Chinese Caixin M'fing PMI unexpectedly improved to its best level since 2011. The reaction move was relatively limited, with USD/CNH last sitting ~60 pips worse off.
- KRW resisted early pressure from wider risk aversion, as local Markit M'fing PMI returned into expansion, while trade data from over the weekend showed a continued recovery in daily average exports. BoK Gov Lee said that the central bank will hold a special meeting on Nov 4 to assess the impact of the U.S. election.
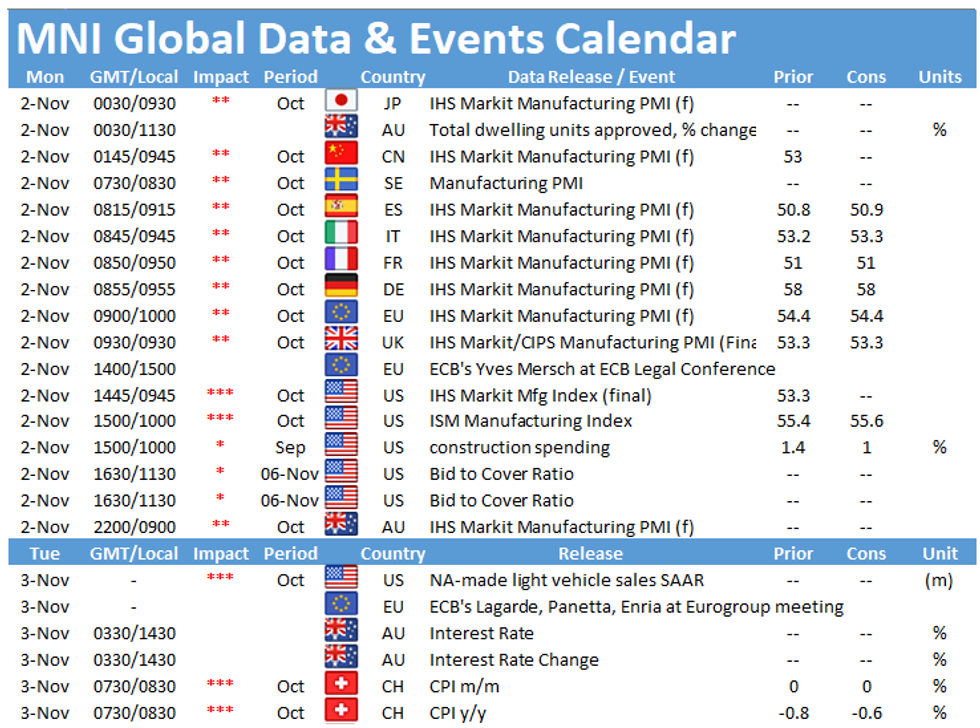
- PMI from across the globe will continue to trickle out, drawing attention today. Central bank speaker slate features ECB's Rehn & Mersch.
MNI FX TECHNICALS:
EUR/USD: Approaching Key Support
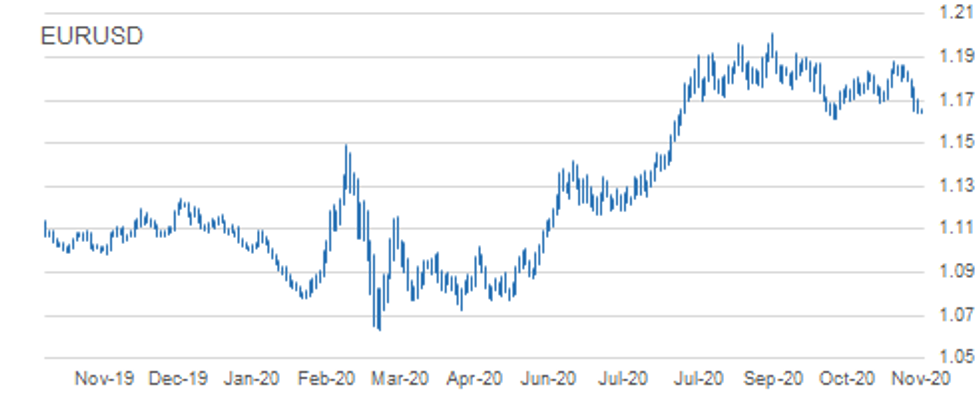
- RES 4: 1.1881 High Oct 21 and the bull trigger
- RES 3: 1.1798 High Oct 28
- RES 2: 1.1761 20-day EMA
- RES 1: 1.1704 High Oct 30
- PRICE: 1.1635 @ 05:42 GMT Nov 2
- SUP 1: 1.1630 Intraday low
- SUP 2: 1.1612 Low Sep 25 and the bear trigger
- SUP 3: 1.1576 0.764 proj of Sep 1 - 25 sell-off from Oct 21 high
- SUP 4: 1.1541 Low Jul 23
EURUSD maintains a weaker outlook with the pair trading lower during the Asia session. Last week's sell-off confirmed a clear breach of the short-term trendline support drawn off the Sep 28 low. The break, confirmed by a move below the Oct 29 low of 1.1718 as well as key support at 1.1689, Oct 15 low strengthens the bearish case and has opened 1.1612, Sep 25 low and the primary bear trigger. Initial resistance is at 1.1704, Friday's intraday high.
GBP/USD: Remains Vulnerable
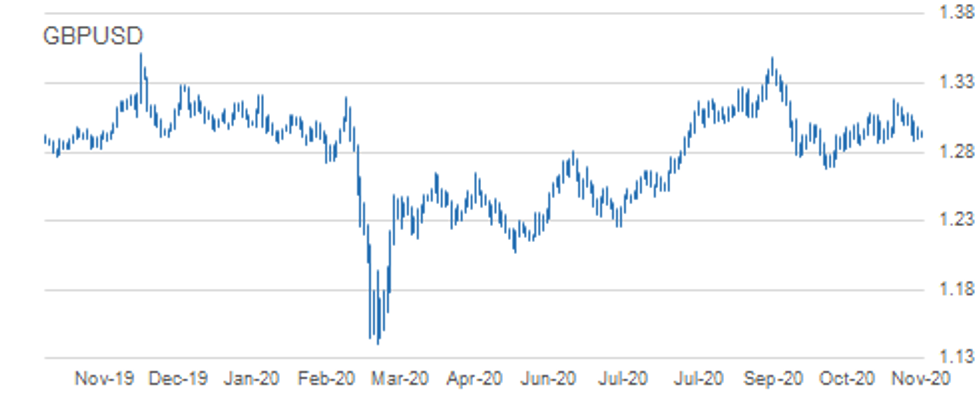
- RES 4: 1.3270 2.0% 10-dma envelope
- RES 3: 1.3177 High Oct 21 and the bull trigger
- RES 2: 1.3080 High Oct 27 and key near-term resistance
- RES 1: 1.3026 High Oct 29
- PRICE: 1.2908 @ 05:50 GMT Nov 2
- SUP 1: 1.2881 Low Oct 29
- SUP 2: 1.2863 Low Oct 14 and key near-term support
- SUP 3: 1.2806 Low Sep 30
- SUP 4: 1.2794 76.4% retracement of the Sep 23 - Oct 21 rally
GBPUSD outlook remains bearish following last week's extension lower. The breach of 1.2940, Oct 21 low suggests scope for a deeper pullback with attention on 1.2863, Oct 14 low and a key short-term support. Clearance of this level would open 1.2794, a Fibonacci retracement. Price action has defined initial firm resistance at 1.3080, Oct 27 high. A move back above this hurdle would ease bearish pressure and open 1.3177, Oct 21 high.
EUR/GBP: Bearish Price Sequence
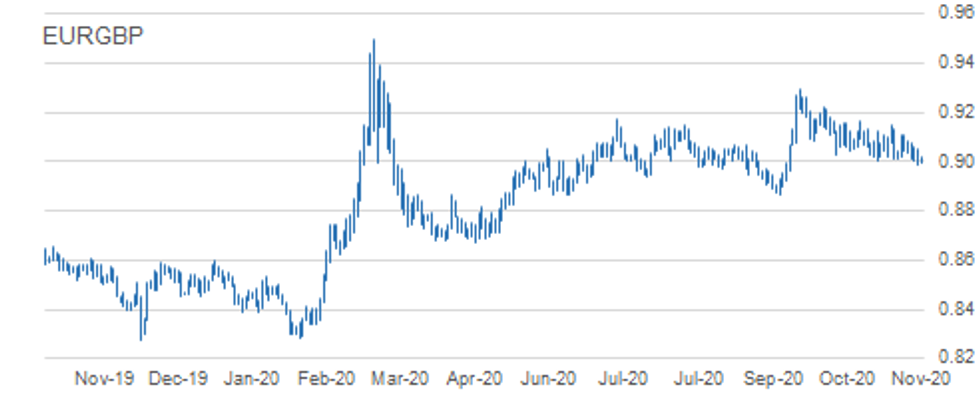
- RES 4: 0.9146/62 1.0% 10-dma envelope / High Oct 7
- RES 3: 0.9149 Oct 20 high
- RES 2: 0.9107 High Oct 23
- RES 1: 0.9064 50-day EMA
- PRICE: 0.9018 @ 06:00 GMT Nov 2
- SUP 1: 0.8984 Low Oct 30
- SUP 2: 0.8967 76.4% retracement of the Sep 3 - 11 rally
- SUP 3: 0.8925 Low Sep 7
- SUP 4: 0.8900 Low Sep 4
EURGBP traded lower Friday and cleared 0.9007, Oct 14 low. This confirms a resumption of the downtrend that has been in place since reversing lower on Sep 11. The break lower maintains a bearish price sequence of lower lows and lower highs. This has exposed 0.8967 next, a retracement. Key short-term resistance is at 0.9149, Oct 20 high. Clearance of this level would undermine bearish conditions. Initial resistance is 0.9064, 50-day EMA
USD/JPY: Bearish Despite Finding Support
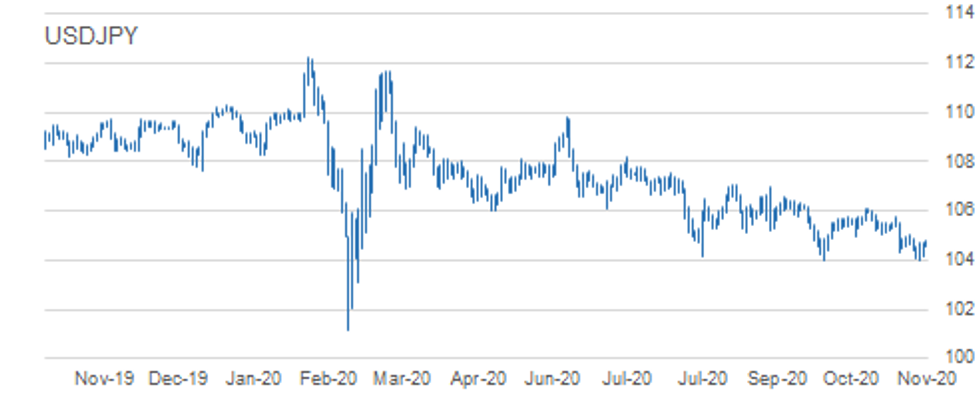
- RES 4: 105.75 High Oct 20
- RES 3: 105.48/53 50-dma / High Oct 21
- RES 2: 105.06 High Oct 26 and key near-term resistance
- RES 1: 104.89 High Oct 26
- PRICE: 104.72 @ 06:05 GMT Nov 2
- SUP 1: 104.00 Low Sep 21 and the bear trigger
- SUP 2: 103.67 76.4% retracement of the Mar 9 - 24 rally
- SUP 3: 103.09 Low Mar 12
- SUP 4: 102.02 Low Mar 10
USDJPY maintains a bearish outlook despite recovering from recent lows. Attention remains on the key 104.00 handle, Sep 21 low. Clearance of this support would suggest scope for a deeper USD sell-off within the bear channel drawn off the Mar 24 high. A break lower would also confirm a resumption of the current downtrend and maintain the bearish price sequence of lower lows and lower highs. Firm resistance is at 105.06.
EUR/JPY: Bears Still In Charge
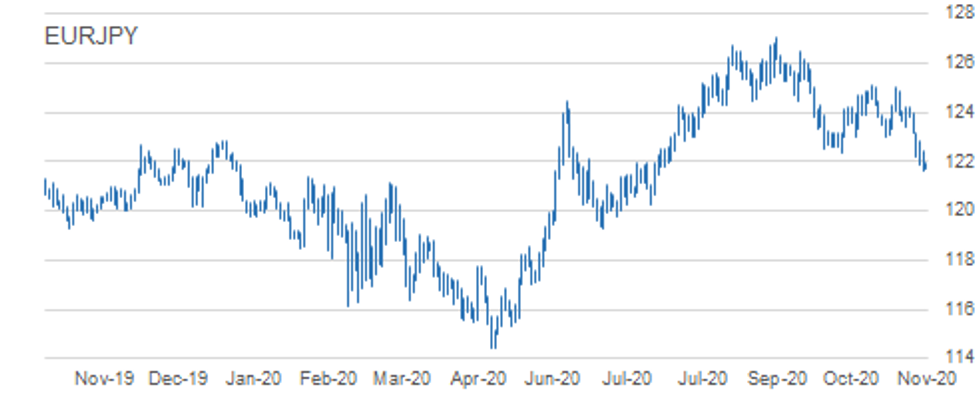
- RES 4: 123.82 50-day EMA
- RES 3: 123.36 20-day EMA
- RES 2: 123.19 High Oct 28
- RES 1: 122.46 High Oct 30
- PRICE: 121.91@ 06:15 GMT Nov 2
- SUP 1: 121.50 0.764 proj of Sep 1 - 28 decline from Oct 9 high
- SUP 2: 120.70 Low Jul 13
- SUP 3: 120.39 1.000 proj of Sep 1 - 28 decline from Oct 9 high
- SUP 4: 120.27 Low Oct 10
EURJPY maintains a bearish tone following last week's bearish activity. The cross has cleared support at 123.03/02 and 122.38, Sep 28 low. This move lower has confirmed a resumption of the downleg that started Sep 1. Scope is seen for weakness towards 121.50 next, a Fibonacci projection. Further out, 120.39 is on the radar, also a Fibonacci projection. Initial resistance is at 122.46, Friday's high.
AUD/USD: Trades Below 0.7000 Clearing Key Support
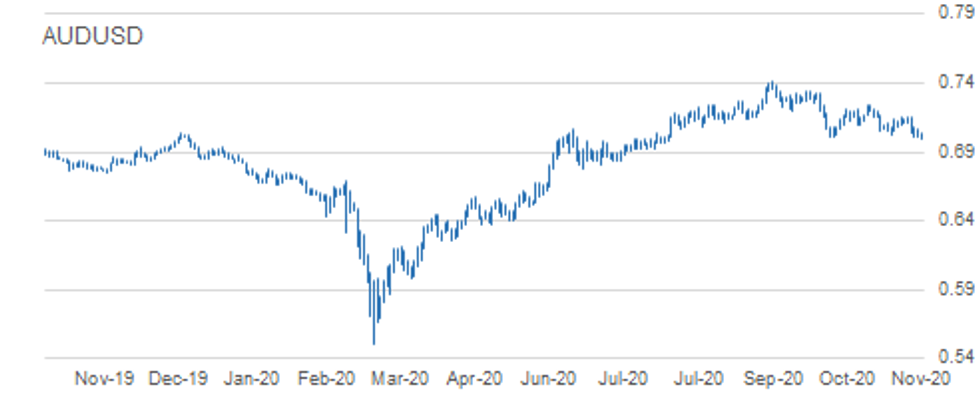
- RES 4: 0.7243 High Oct 10 and a key resistance
- RES 3: 0.7218 High Oct 13
- RES 2: 0.7138/58 Trendline drawn off the Sep 1 high / High Oct 23
- RES 1: 0.7076 High Oct 29
- PRICE: 0.7009 @ 06:23 GMT Nov 2
- SUP 1: 0.6996 Intraday low
- SUP 2: 0.6965 23.6% retracement of the Mar - Sep Rally
- SUP 3: 0.6943 2.0% 10-dma envelope
- SUP 4: 0.6921 Low Jul 14
AUDUSD outlook is bearish. The pair has pulled further away from trendline resistance drawn off the Sep 1 high and importantly has today traded below 0.7000, signalling a clear breach of former support at 0.7006, Sep 25 low and 0.7002, Oct 29 low. The break lower has opened 0.6965 next, a Fibonacci retracement. On the upside, trendline resistance intersects at 0.7138 where a break is required to reverse the trend.
USD/CAD: Approaching Key Resistance
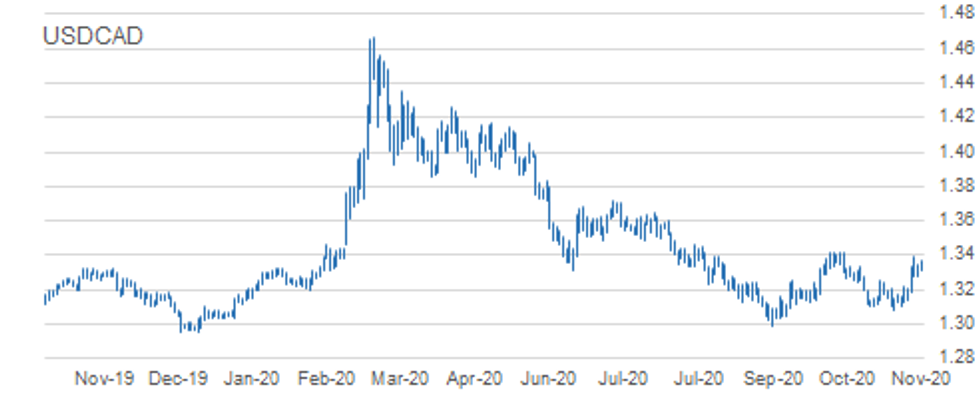
- RES 4: 1.3545 200-dma
- RES 3: 1.3474 2.0% 10-dma envelope
- RES 2: 1.3421 High Sep 30 and primary resistance
- RES 1: 1.3390 High Oct 29
- PRICE: 1.3337 @ 06:27 GMT Nov 2
- SUP 1: 1.3259 High Oct 15 and recent breakout level
- SUP 2: 1.3180 Low Oct 28
- SUP 3: 1.3109/3081 Low Oct 23 / Low Oct 21 and the bear trigger
- SUP 4: 1.3047 Low Sep 7
USDCAD is consolidating. Last week's bullish weekly close, however, cemented the break of key short-term resistance at 1.3259, Oct 15 high as well as the break of 1.3341, Oct 7 high. Gains signal scope for a climb towards 1.3421 next, Sep 30 and primary resistance. Initial firm support is seen at 1.3180, Oct 28 low. A break of this level is required to undermine the developing bullish tone. First support however lies at 1.3259.
MNI KEY FX LEVELS
EUR/USD: MNI Key Levels
- $1.1779/83/84 200-hma/50-dma/Cloud top
- $1.1759/60/63 Oct29 high/Oct20 low/21-dma
- $1.1718/22 Oct28 low/100-hma
- $1.1691/04 Cloud base/Oct30 high
- $1.1657 100-dma
- $1.1649/55 Lower 1.0% 10-dma env/Intraday high
- $1.1633 ***CURRENT MARKET PRICE 05:06BST MONDAY***
- $1.1632/30 Lower Boll Band (2%)/Intraday low
- $1.1615/12 Sep28 low/Sep25 low
- $1.1581/67 Jul24 low/Lower Boll Band (3%)
- $1.1541/31 Jul23 low/Lower 2.0% 10-dma env
- $1.1507 Jul22 low
- $1.1423/14/13 Jul21 low/Lower 3.0% 10-dma env/200-wma
- $1.1403/89 Jul20 low/50-mma
GBP/USD: MNI Key Levels
- $1.3064 Oct28 high
- $1.3022/26 200-hma/Oct29 high
- $1.3008 55-dma*$1.2988/95/97 Oct30 high/50-dma/Cloud top
- $1.2975/81 100-hma/21-dma
- $1.2960 Cloud base
- $1.2949/50/56 50-mma/200-wma/Intraday high
- $1.2908 ***CURRENT MARKET PRICE 05:14BST MONDAY***
- $1.2900/99 Intraday low/Oct30 low
- $1.2881/78/75 Oct29 low/100-dma/Lower 1.0% 10-dma env
- $1.2865/63 Oct16 low/Oct14 low
- $1.2846/38 Oct07 low/Oct02 low, Lower Boll Band (2%)
- $1.2820 Oct01 low
- $1.2806 Sep30 low
- $1.2794/81 76.4% 1.2676-1.3177/ Sep24 high
EUR/GBP: MNI Key Levels
- Gbp0.9138/49 Upper 1.0% 10-dma env/Oct20 high
- Gbp0.9125/35/37 Cloud top/Upper Boll Band (2%)/Oct21 high
- Gbp0.9106/07 Oct26 high/Oct23 high
- Gbp0.9076/79/85 Oct28 high/Cloud base/Oct27 high
- Gbp0.9059/63/68 Oct29 high/21-dma, 55-dma/50-dma
- Gbp0.9046/52/53 200-hma/100-dma/Oct30 high
- Gbp0.9021/35 Intraday high/100-hma
- Gbp0.9013 ***CURRENT MARKET PRICE 05:23BST MONDAY***
- Gbp0.8998/89 Intraday low/Lower Boll Band (2%)
- Gbp0.8984 Oct30 low
- Gbp0.8967/57/53 Sep08 low/Lower 1.0% 10-dma env/Lower Boll Band (3%)
- Gbp0.8925 Sep07 low
- Gbp0.8908/00 200-dma/Sep04 low
- Gbp0.8867/66/64 Lower 2.0% 10-dma env/Sep03 low/Jun09 low
- Gbp0.8830/26/22 May15 low/May14 low/100-wma
USD/JPY/MNI Key Levels
- Y105.46 50-dma
- Y105.19 Cloud base
- Y105.17 21-dma
- Y105.07 Cloud Kijun Sen
- Y105.06 Oct26 high
- Y104.89 Oct27 high
- Y104.77/78 Intraday high/Cloud Tenkan Sen
- Y104.73 ***CURRENT MARKET PRICE 05:30BST MONDAY***
- Y104.62/54 200-hma/Intraday low
- Y104.47 100-hma
- Y104.13 Oct30 low
- Y104.11 Lower Bollinger Band (2%)
- Y104.03 Oct29 low
- Y104.00 YTD low
- Y103.94 200-mma
EUR/JPY: MNI Key Levels
- Y123.36 Cloud Kijun Sen
- Y123.23 200-hma, Cloud Tenkan Sen
- Y123.19 Oct28 high
- Y122.88 Oct29 high
- Y122.47 100-hma
- Y122.46 Oct30 high
- Y121.97/00 Intraday high/Lower 1.0% 10-dma env
- Y121.86 ***CURRENT MARKET PRICE 05:36BST MONDAY***
- Y121.81/78 Lower Boll Band (2%)/100-wma
- Y121.70 Intraday low
- Y121.62 Oct30 low
- Y121.47 Jul14 low
- Y121.17/14 200-dma/76.4% 119.31-127.08
- Y120.88 Lower Bollinger Band (3%)
- Y120.77 Lower 2.0% 10-dma envelope
AUD/USD: MNI Key Levels
- $0.7170/83/84 Oct15 high/50-dma/55-dma
- $0.7149/57/58 Upper 1.0% 10-dma env/Oct28 high/Oct23 high
- $0.7114 100-dma, 21-dma
- $0.7091 200-hma
- $0.7065/72/76 100-hma/Oct30 high/Oct29 high
- $0.7033 Intraday high
- $0.7008 Lower 1.0% 10-dma envelope
- $0.7007 ***CURRENT MARKET PRICE 05:46BST MONDAY***
- $0.6996/88 Intraday low/Lower Boll Band (2%)
- $0.6973/63 Jul20 low/Jul16 low
- $0.6937/26 Lower 2.0% 10-dma env/Lower Boll Band (3%)
- $0.6921 Jul14 low
- $0.6893 100-wma
- $0.6877/66 Jul01 low/Lower 3.0% 10-dma env
- $0.6833 Jun30 low
USD/CAD: MNI Key Levels
- C$1.3483/88 Jul22 high/Upper 2.0% 10-dma env
- C$1.3460 Jul30 high
- C$1.3443/51 Upper Boll Band (3%)/Aug03 high
- C$1.3419/21 Sep29 high/Aug04 high, Sep30 high
- C$1.3390 Oct29 high
- C$1.3370/77 Intraday high/100-wma
- C$1.3356/64 Upper 1.0% 10-dma env/Upper Boll Band (2%)
- C$1.3337 ***CURRENT MARKET PRICE 05:50BST MONDAY***
- C$1.3328/14 100-dma/Intraday low
- C$1.3297 Cloud top
- C$1.3280/78 Oct30 low, 100-hma/Oct29 low
- C$1.3240 Cloud base
- C$1.3215/09/08 200-hma/21-dma, 50-dma/55-dma
- C$1.3183/80 50-mma/Oct28 low
- C$1.3161 200-wma
OPTIONS: Expiries for Nov2 NY cut 1000ET (Source DTCC)
- EUR/USD: $1.1570-85(E549mln-EUR puts), $1.1700(E526mln), $1.1750(E574mln), $1.1795-00(E838mln), $1.1815-20($980mln)
- USD/JPY: Y104.50($440mln), Y104.85-00($693mln)
- GBP/USD: $1.3100(Gbp1.2bln), $1.3150(Gbp961mln)
- EUR/GBP: Gbp0.8900(E2.2bln-EUR puts), Gbp0.9000(E1.5bln mixed/E1.44bln EUR puts)
- AUD/USD: $0.7000-10(A$486mln), $0.7140-45(A$1.9bln)
- USD/CAD: C$1.3300($662mln)
- USD/CNY: Cny6.65($770mln)
Larger Option Pipeline
- EUR/USD: Nov03 $1.1900-05(E1.4bln); Nov06 $1.1600(E1.2bln), $1.1795-1.1805(E1.0bln)
- USD/JPY: Nov03 Y105.45-49($1.3bln); Nov04 Y105.00($1.1bln); Nov05 Y106.06-09($1.6bln)
- EUR/JPY: Nov05 Y124.50(E1.1bln)
- USD/CNY: Nov03 Cny6.5334($1.2bln); Nov05 Cny6.75($1.1bln), Cny6.80($1.9bln), Cny6.85($1.3bln);
Nov06 Cny6.70($1.2bln)
To read the full story
Sign up now for free trial access to this content.
Please enter your details below.
Why MNI
MNI is the leading provider
of intelligence and analysis on the Global Fixed Income, Foreign Exchange and Energy markets. We use an innovative combination of real-time analysis, deep fundamental research and journalism to provide unique and actionable insights for traders and investors. Our "All signal, no noise" approach drives an intelligence service that is succinct and timely, which is highly regarded by our time constrained client base.Our Head Office is in London with offices in Chicago, Washington and Beijing, as well as an on the ground presence in other major financial centres across the world.
