
Why MNI
MNI is the leading provider
of intelligence and analysis on the Global Fixed Income, Foreign Exchange and Energy markets. We use an innovative combination of real-time analysis, deep fundamental research and journalism to provide unique and actionable insights for traders and investors. Our "All signal, no noise" approach drives an intelligence service that is succinct and timely, which is highly regarded by our time constrained client base.Our Head Office is in London with offices in Chicago, Washington and Beijing, as well as an on the ground presence in other major financial centres across the world.
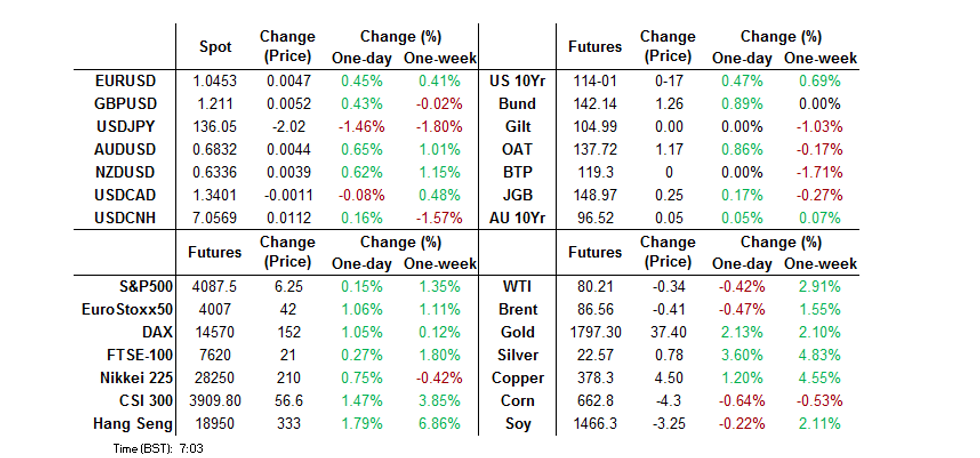
- The USD has remained on the back foot for much of the session, with Wednesday's Fed Chair Powell-inspired weakness . The BBDXY index, currently sub 1264.00, remains below its 200-day MA (1266.36).
- Most regional bourses are higher, tracking the strong positive lead from offshore markets overnight. Only Indonesian and Philippines markets are down within the Asia Pac region.
- There are European and US November manufacturing PMI/ISM data later. There is also some Fed speak and US PCE and jobless claims data.
US TSYS: A Touch Cheaper As Asia Fades Modest Amount Of Month-End & Powell-Inspired Bid
The bulk of Wednesday’s rally held in Asia-Pac hours, although some of the month-end extension-related, and partially block-flow facilitated, rally that kicked in after the initial late NY bid surrounding Fed Chair Powell’s address faded overnight.
- That leaves cash Tsys 0.5-2.5bp cheaper into London hours, with the front end leading the modest cheapening. TYH3 deals just below the mid-point of its 0-08 range, last +0-16 at 114-00.
- There wasn’t much in the way of meaningful headlines to absorb overnight, with a slightly ‘less worse’ than expected Chinese Caixin manufacturing PMI print and headlines pointing to further COVID isolation tweaks in Beijing having little impact on the space.
- That left the fading of the month-end extension impulse and a couple of block sales in TY futures (2x 1,250 lots) at the fore.
- In terms of Fed pricing, FOMC dated OIS currently prices in 52bp of tightening for this month’s FOMC, with a terminal rate of just over 4.90% eyed. Both measures sit a little below pre-Powell levels.
- NY hours will be headlined by the PCE data suite, ISM manufacturing survey and Fedspeak from Bowman, Barr & Logan.
JGBS: Off Best Levels As BoJ's Noguchi Outlines Potential Triggers For Policy Tweaks
Cash JGBs have twist steepened, moving away from best levels in afternoon trade, as global core FI markets nudged away from best levels of the day.
- Cash JGBs run 2.5bp richer during to 1.5bp cheaper across the curve, after initially drawing support from Tokyo’s reaction to Fed Chair Powell’s latest address.
- 7s outperformed on the curve owing to the bid in futures, as local participants extended the overnight bid in that contract. Futures are +26 into the close, comfortably off of best levels.
- It would seme that comments from BoJ’s Noguchi, who discussed potential parameters that could trigger BoJ policy tweaks, added an idiosyncratic input into the move away from best levels. There wasn’t much in the way of new information in the comments themselves, while Noguchi also played down the idea of a policy tweak in the near term (albeit while pointing to a data-dependent stance).
- There was no reaction to local data.
- We saw a very well received 10-Year JGB auction in which the tail vanished and low price marginally topped wider dealer expectations. Meanwhile, the cover ratio moved to the highest level observed at a 10-Year JGB auction since the early 2000s. It would seem that participants were willing to lean on the BoJ’s forward guidance and YCC settings here, with the auction clearing at the upper boundary (in yield terms) permitted under the BoJ’s YCC.
- Looking ahead, the latest round of BoJ Rinban operations headline the domestic docket on Friday.
JAPAN: No Standout Amounts In Weekly International Security Flow Data
Nothing really stands out when it comes to last week’s Japanese international security flow data, with net flows limited in size terms, and some reversals in direction observed. The most notable move would be the marginal net selling of Japanese bonds by international investors after the second largest round of weekly net purchases on record was lodged in the previous week.
| Latest Week | Previous Week | 4-Week Rolling Sum | |
| Net Weekly Japanese Flows Into Foreign Bonds (Ybn) | -51.2 | -527.1 | -1273.3 |
| Net Weekly Japanese Flows Into Foreign Stocks (Ybn) | -239.1 | 39.8 | -1840.4 |
| Net Weekly Foreign Flows Into Japanese Bonds (Ybn) | -45.8 | 2215.6 | 2176.3 |
| Net Weekly Foreign Flows Into Japanese Stocks (Ybn) | 442.9 | 4.4 | 1334.3 |
Source: MNI - Market News/Bloomberg/Japanese Ministry Of Finance
AUSSIE BONDS: Firmer, But Off Post-Powell Peaks
Aussie bonds firmed on Thursday, but backed away from best levels. This left YM +7.0 & XM +5.0 at the close, while cash ACGBs were 1-7bp richer as the curve bull steepened.
- Aussie 10s widened a little vs. their U.S. counterpart post-Powell (~7bp vs. yesterday’s local close), with the AU/U.S. 10-Year yield spread operating comfortably within the recently observed range.
- Local data didn’t have any meaningful impact on the space, with the late NY rally in U.S. Tsys (on the back of Fed Chair Powell’s address and month-end index extensions) initially allowing participants to extend the overnight uptick in Aussie Bond futures, before a pull back from best levels, alongside a similar move in the U.S. Tsy space.
- Bills finished 3-6bp richer through the reds, with some light bull flattening apparent.
- RBA dated OIS generally came in a touch post-Fed Chair Powell, with ~”19bp of tightening priced for next week’s decision and a terminal cash rate of ~3.70% observed on the strip.
- Housing finance data, A$600mn of ACGB Sep-26 supply and the release of the weekly AOFM issuance slate headline the domestic docket on Friday.
NZGBS: Off Best Levels, 10s Underperform On Uncovered Auction
NZGBs worked away from richest levels of the session, leaving the major benchmarks flat to 7bp firmer on the day come the bell.
- A very modest round of cheapening in U.S. Tsys (after a notable post-Powell rally extended on month-end extension-based demand into the NY close) initially helped the space away from best levels.
- There were also some idiosyncrasies at play, with an uncovered round of NZGB-33 supply resulting in underperformance for the 10-Year zone on the curve (as that benchmark finished virtually unchanged on the day), while NZGB-27 & May-51 supply passed smoothly, with the latter particularly well received.
- Swap rates pulled back from session lows but were still 2-5bp lower on the session, resulting in mixed swap spread performance.
- RBNZ dated OIS eased in lieu of Fed Chair Powell’s Wednesday address, with ~62bp of tightening priced in for the Bank’s Feb ’23 meeting, while terminal rate pricing eased to just over 5.35%, as both measures shed 5bp or so on the day.
- Looking ahead, quarterly terms of trade data headlines Friday’s domestic docket.
AUSTRALIA/NEW ZEALAND: Australian House Prices Down More Than In NZ In November
CoreLogic house prices in November fell 1.1% m/m in Australia to be down 5.4% y/y. This was in line with the 1.1% drop in October suggesting that the housing correction isn’t accelerating. CoreLogic NZ house prices fell 0.6% m/m to be down 2.9% y/y, which was a further deceleration in the adjustment despite 400bp of tightening.
- Australian house prices fell for the seventh consecutive month and are now down 7.3% from their April 2022 peak, which is still only a small retracement of the 25% rise in the 18-months prior to the peak. Most forecasters are expecting about a 20% drop from the peak.
- House prices in NZ are now 8.1% below their March 2022 peak but they rose 41.4% over the previous cycle and so the current correction has a long way to go to unwind this. The moderate housing market adjustment so far likely reflects RBNZ Governor Orr’s comment that the neutral policy rate is probably higher as there hasn’t yet been the same pass through of rate hikes to mortgage rates.
- CoreLogic Australian house prices are falling faster than in NZ despite less tightening and a lower peak in the market.

Source: MNI - Market News/Refinitiv/CoreLogic/Bloomberg
FOREX: USD Index Holds Beneath 200-Day MA, USD/JPY Back To Late August Lows
The USD has remained on the back foot for much of the session. The BBDXY index, currently sub 1264.00, remains below its 200-day MA (1266.36).
- Risk-on signals have been evident in the equity and commodity space, although JPY is the standout performer within G10.
- USD/JPY is down over 1.3%, last near 136.30, fresh lows for the session and levels last seen in late August. Domestic data has been mixed, while the BoJ's Noguchi hasn't broken new ground relative to other recent BoJ commentary.
- AUD/USD is firmer, up to 0.6815, +0.40% for the session. The pair shrugged off a weak Q3 CAPEX result.
- NZD has outperformed, up 0.60% to 0.6335. The AUD/NZD cross has remained heavy but found support around the 1.0750 level.
- EUR (1.0445) and GBP (1.2100) are both up around 0.35% for the session so far.
- There are European and US November manufacturing PMI/ISM data later. There is also some Fed speak and US consumption and jobless claims data.
ASIA FX: USD Weaker Across The Board, CNH Lags
MNI (Australia) USD/Asia pairs continue to track lower, amid broad based dollar weakness. Data momentum has been mixed today, although regional PMIs showed greater resilience than might have expected. The main theme remains China re-opening, with Beijing announcing some low-risk covid patients can isolate at home, among the latest announcements. Tomorrow South Korean CPI is the main focus.
- USD/CNH has consolidated. The pair got close to 7.0250 in the first part of trading, but we spent much of the session back above the 7.0500 level. The CNY fixing was neutral, while the Caixin PMI printed better than expected. The pair is back close to 7.0550 at the time of writing due to the Beijing headlines around low-risk Covid patients, although there hasn't been much follow through.
- USD/KRW 1 month slipped below 1300 in early trade, but found support ahead of 1295, last at 1297. Onshore equities are higher, but have lagged the rest of the region (+0.30%), as weaker export growth and on-going truck strikes hurt sentiment at the margin.
- USD/IDR is lower, last at 15620, -0.70% for the session so far. The pair was unable to hold sub 15620 in the first part of trading though. November CPI came in softer than expected, paving the way for a reduced pace of tightening in December from BI.
- USD/INR is back to the low 81.00 region (last 81.11). The simple 100-day MA comes in at 80.72. The manufacturing PMI stayed resilient at 55.7, from 55.3 last month. This follows yesterday's Q3 GDP report, which showed a generally solid underlying growth backdrop, despite the headline slowdown.
- USD/THB is back sub 35.00, last around 34.90, fresh lows back to mid-June. The Nov PMI eased back to 51.1 (from 51.6), but remained in expansion territory. The BoT delivered few surprises yesterday after hiking by a further 25bps.
IDR: Can IDR Play Catch Up?
USD/IDR is back to 15638, -0.60% on yesterday's closing levels. The 50-day EMA comes in just under 15500, while mid-November lows were around 15400. On the topside, BI intervention interest appears evident around the 15750 level.
- The rupiah still looks to be lagging the broader global equity rally and improved risk tone. However, local equities continue to stagnate, while net offshore inflows were only just positive for November, compared to stronger momentum elsewhere in the region.
- Still, there is scope for IDR to play some catch up if we see further broad based USD weakness. Relative to its 200-day MA, USD/IDR is still the most elevated relative to other USD/Asia pairs, see the chart below.
- November CPI, which has just printed, continued the recent run of downside surprises relative to expectations. Headline prices moderated to 5.42% from 5.71% prior (5.50% was forecast), while core came in at 3.30%, unchanged and versus 3.42% expected. B
- BI is still likely to tighten in December, but we may see a slowdown in terms of the pace of tightening.
Fig 1: USD/Asia FX Pairs - Deviation From 200-Day MAs (%)
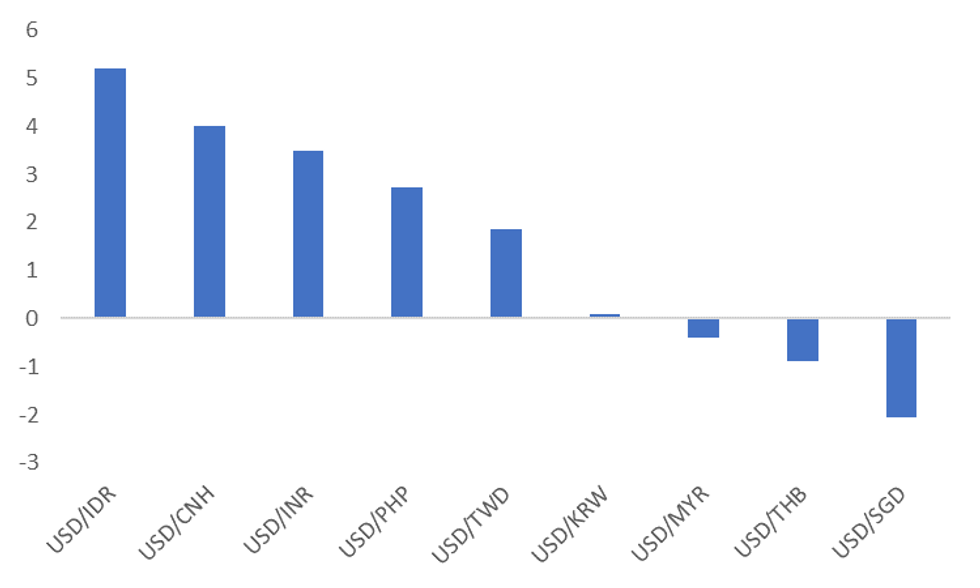
Source: MNI - Market News/Bloomberg
ASIA: North East Asian PMIs Displayed Some Resilience In November
North East Asia (NEA) PMIs arguably painted somewhat of a more resilient picture for November, particularly given on-going concerns around the China growth backdrop. The just released Caixin China PMI came in better than expected at 49.4 versus the 48.9 forecast. We are now above recent trough levels of 48.1 recorded in September, albeit still in contractionary territory. Today’s outcome also has to be tempered with the weaker than expected official PMI results from earlier in the week.
- The first chart below overlays the China Caixin PMI index against the South Korea and Taiwan PMIs, along with the US ISM.
- The South Korea has also trended higher since September but remains in contractionary territory (49.0 latest versus 48.2 in October). The Taiwan PMI ticked up slightly (to 41.6 from 41.5), however in levels terms we are still around 2020 lows. The detail in both survey prints showed some modest improvement.
Fig 1: NEA PMIs & The US ISM
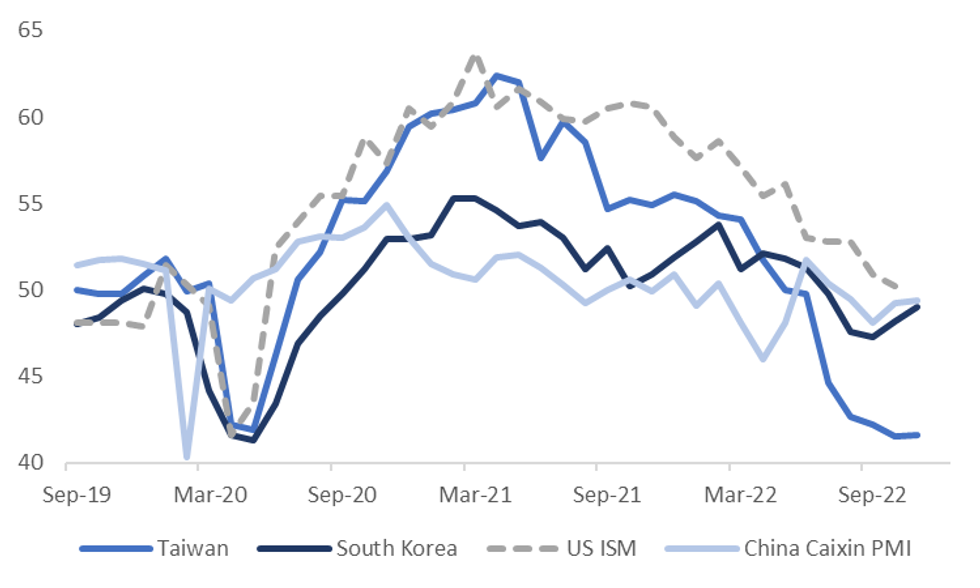
Source: MNI - Market News/Bloomberg
- The average PMI readings for these two economies is showing some signs of forming a base, but we likely need a few more months of observations to get a definitive picture.
- Global trade volumes are holding up well relative to these PMI trends, see the chart below. Note though the latest observation for global trade volumes is September.
Fig 2: Global Trade Volumes & Average South Korea/Taiwan PMI Levels
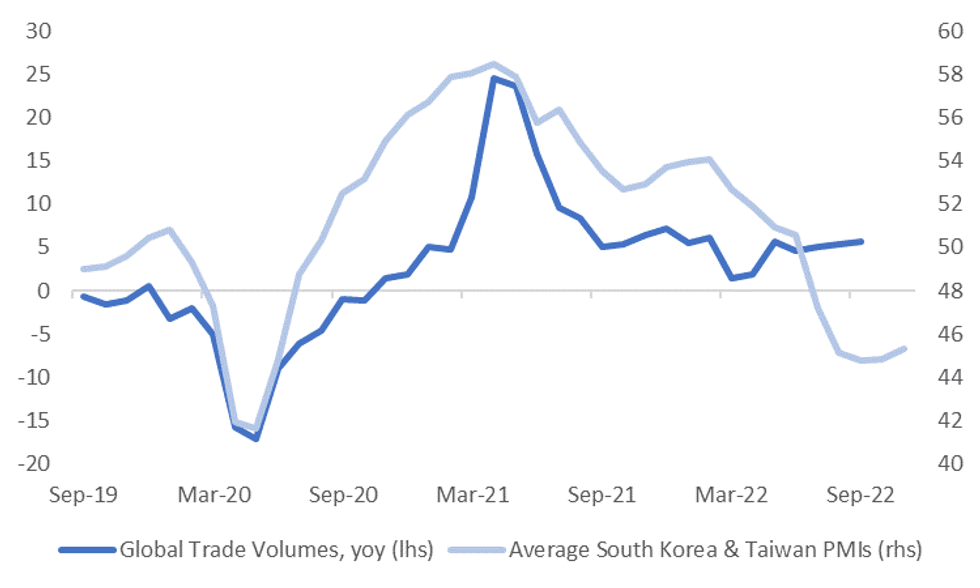
Source: MNI - Market News/Bloomberg
SOUTH KOREA: Exports Disappoint, Trade Deficit Stays Wide
South Korean trade figures surprised on the downside for November. Export growth came in at -14% y/y, against -11.2% expected and -5.7% in October. This is the weakest print since mid 2020. Import growth was firmer than expected at 2.7% y/y (+0.5% forecast, +9.9% prior). This saw the trade deficit widen to just over -$7.0bn, slightly wider than last month.
- Similar trends remained in play from last month, with weakness in semiconductor exports, -29.8% y/y, compared to -17.4% y/y last month. Exports to China fell to -25.5% y/y, versus -15.7% in October.
- The trade deficit improvement has also stalled, but we remain better than August wides (-$9.4bn).
- The data has not impacted won sentiment at this stage. China re-opening optimism is offsetting, along with a weaker USD theme post Powell's speech overnight. USD/KRW is sub 1300, the 1 month near 1295 currently.
- Also, the won has generally led the weaker export trend this year, see the chart below. Today's weaker export print brings the two series more into line with each other.
Fig 1: KRW/USD Y/Y Change Versus South Korea Export Growth
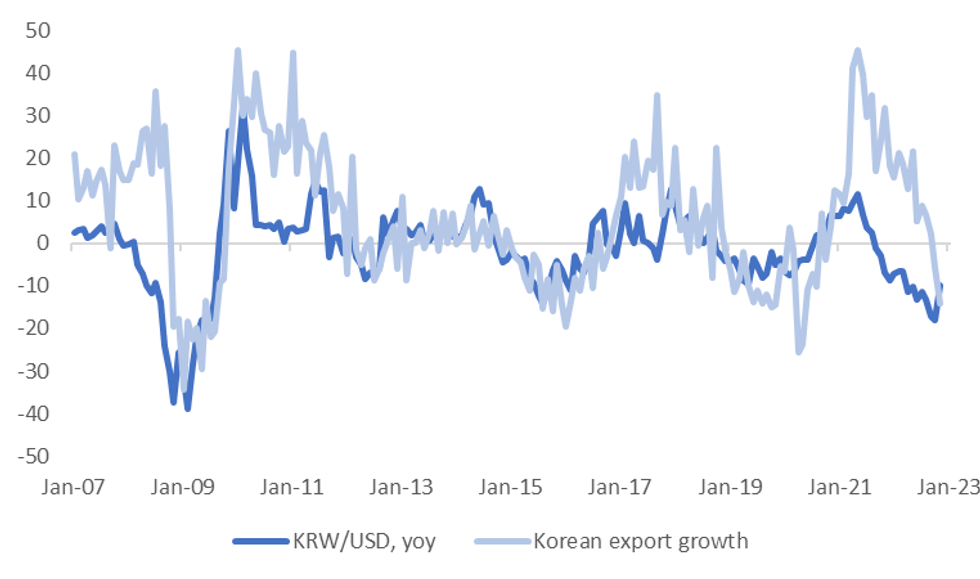
Source: MNI - Market News/Bloomberg
EQUITIES: Asian Markets Enjoy Post Powell Rally
MNI (Australia) - Most regional bourses are higher, tracking the strong positive lead from offshore markets overnight. Only Indonesian and Philippines markets are down within the Asia Pac region. US equity futures are modestly higher, +0.15/+0.20% at this stage. The risk on tone has been evident in other asset classes, with the USD softer and commodities mostly higher.
- China's CSI 300 is firmer by 1.30% so far today, while the Shanghai Composite is +0.65% higher. A slight down tick in aggregate Covid cases, coupled with a Caixin PMI beat has helped.
- Further re-opening signs is the other focus point for markets, with a number of regions moving away from lock down conditions.
- The HSI is up by 1.60%, with the tech index up nearly 2.40%. Overnight the China Dragon Index rose a further 9.60%, capping off a +42% gain for the index in November.
- Japan's Nikkei 225 is up +1%, Q3 data showed better than expected company profits and Capex.
- The Kospi is showing a modest +0.15% gain, but offshore investors continue to return to the market, with a further $150mn in net inflows.
GOLD: Gold Approaching Bull Trigger On Less Hawkish Fed
Gold prices are up again so far today rising 0.4% to around $1776.20/oz after Fed Chairman Powell signalled a stepdown in tightening in December. It is off of its intraday high of $1779.99. The further downward move in the USD today (DXY -0.3%) is helping bullion to rally.
- Gold has been approaching the bull trigger of $1786.50, the November 15 high, this rally but hasn’t reached it yet. Further USD and Treasury yield weakness would be needed to take it through that level.
- There are European and US November manufacturing PMI/ISM data later. There is also some Fed speak and US consumption and jobless claims data. Weakness here could push gold prices higher.
OIL: Oil Prices Hold Onto Gains On Demand Hopes And Tight Supply
Oil prices are down slightly today after rising 3% overnight and are trading in a very tight range of less than one dollar. Supply and demand news has resulted in oil holding onto its recent gains.
- WTI is trading at $80.40/bbl after a high of around $81/bb and Brent is about $86.70 after reaching $87.25.
- Brent has struggled to hold a break through resistance of $86.67, the November 25 high. Whereas WTI has cleared its November 25 high of $79.90 and $82.43 has opened up, the November 18 high.
- EIA data showed a large drawdown in US crude inventories of 12.58mn barrels after 3.691mn last week, the largest decline since June 2019, and consistent with the API data. US exports of crude and products also rose to a new record. There were reports from CNBC that US President Biden is looking to use additional reserves of both crude and heating oil for the winter.
- On the output side, there is still uncertainty surrounding the outcome of the weekend’s OPEC+ meeting.
- There are European and US November manufacturing PMI/ISM data later. There is also some Fed speak and US consumption and jobless claims data.
UP TODAY (Times GMT/Local)
| Date | GMT/Local | Impact | Flag | Country | Event |
| 01/12/2022 | 0700/0800 | ** |  | DE | Retail Sales |
| 01/12/2022 | 0700/0700 | * |  | UK | Nationwide House Price Index |
| 01/12/2022 | 0730/0830 | *** |  | CH | CPI |
| 01/12/2022 | 0730/0830 | ** | | CH | retail sales |
| 01/12/2022 | 0815/0915 | ** |  | ES | IHS Markit Manufacturing PMI (f) |
| 01/12/2022 | 0845/0945 | ** |  | IT | IHS Markit Manufacturing PMI (f) |
| 01/12/2022 | 0850/0950 | ** |  | FR | IHS Markit Manufacturing PMI (f) |
| 01/12/2022 | 0855/0955 | ** | | DE | IHS Markit Manufacturing PMI (f) |
| 01/12/2022 | 0900/1000 | ** |  | EU | IHS Markit Manufacturing PMI (f) |
| 01/12/2022 | 0930/0930 | ** | | UK | IHS Markit/CIPS Manufacturing PMI (Final) |
| 01/12/2022 | 1000/1000 | ** | | UK | Gilt Outright Auction Result |
| 01/12/2022 | 1000/1100 | ** | | EU | Unemployment |
| 01/12/2022 | - | *** |  | US | Domestic-Made Vehicle Sales |
| 01/12/2022 | 1330/0830 | ** | | US | Jobless Claims |
| 01/12/2022 | 1330/0830 | ** | | US | Personal Income and Consumption |
| 01/12/2022 | 1330/0830 | ** | | US | WASDE Weekly Import/Export |
| 01/12/2022 | 1425/0925 | | US | Dallas Fed's Lorie Logan | |
| 01/12/2022 | 1430/0930 | | US | Fed Governor Michelle Bowman | |
| 01/12/2022 | 1445/0945 | *** | | US | IHS Markit Manufacturing Index (final) |
| 01/12/2022 | 1500/1000 | *** | | US | ISM Manufacturing Index |
| 01/12/2022 | 1500/1000 | * | | US | Construction Spending |
| 01/12/2022 | 1530/1030 | ** | | US | Natural Gas Stocks |
| 01/12/2022 | 1600/1100 | | US | Minneapolis Fed's Neel Kashkari | |
| 01/12/2022 | 1630/1130 | ** | | US | US Bill 04 Week Treasury Auction Result |
| 01/12/2022 | 1630/1130 | * | | US | US Bill 08 Week Treasury Auction Result |
| 01/12/2022 | 1645/1745 | | EU | ECB Lane at Banque de France / EUI conference | |
| 01/12/2022 | 1730/1830 | | EU | ECB Elderson Speech at Lustrum Symposium | |
| 01/12/2022 | 2000/1500 | | US | Fed Vice Chair for Supervision Michael Barr |
Why MNI
MNI is the leading provider
of intelligence and analysis on the Global Fixed Income, Foreign Exchange and Energy markets. We use an innovative combination of real-time analysis, deep fundamental research and journalism to provide unique and actionable insights for traders and investors. Our "All signal, no noise" approach drives an intelligence service that is succinct and timely, which is highly regarded by our time constrained client base.Our Head Office is in London with offices in Chicago, Washington and Beijing, as well as an on the ground presence in other major financial centres across the world.