
Why MNI
MNI is the leading provider
of intelligence and analysis on the Global Fixed Income, Foreign Exchange and Energy markets. We use an innovative combination of real-time analysis, deep fundamental research and journalism to provide unique and actionable insights for traders and investors. Our "All signal, no noise" approach drives an intelligence service that is succinct and timely, which is highly regarded by our time constrained client base.Our Head Office is in London with offices in Chicago, Washington and Beijing, as well as an on the ground presence in other major financial centres across the world.
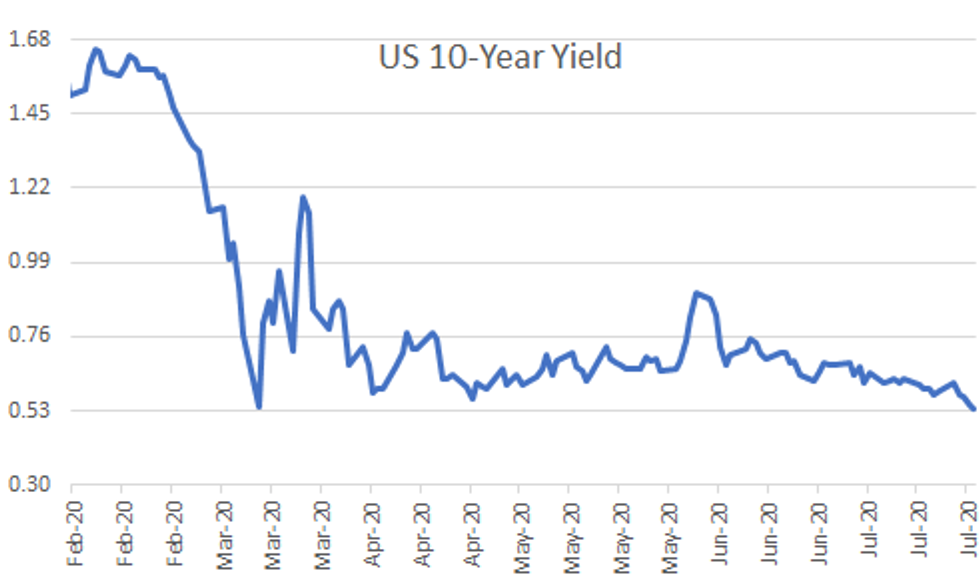
US TSY SUMMARY: Tsy ylds look to finish the month at 5M lows, 10YY still above
March 9 all-time low of 0.3137% at 0.5347% Fri; 10Y real yld/TIPS on the other
hand DID break March all-time low of -1.0083% to -1.0230% on the bell after
heavy month end buying. Tale of two session: Rates were under pressure in the
first half (as were equities).
- Sources reported large scale seller in old bonds, curves steepening in
"sloppy" early trade, was an indicator of incoming corp deals. Indeed, after
lagging last couple wks, issuance est >$30B next wk. Ultra-bonds have "been
trading well on the curve, thanks to the 20Y tightening and the Fed's buy focus
on '44 to '47 paper in their buybacks," the desk added, with "good sized seller
of '45's vs 30's the past two days to take advantage of the richness."
- Rates and equities both rebounded late on heavy buying in both: TYU volume
over 1.12M after the bell on +250k market on close (MOC) buying, USU saw +56K.
Yld curves see-sawed to mixed levels. Eminis were back near opening levels late
(3256.0 +7.25).
- The 2-Yr yield is down 0.8bps at 0.1093%, 5-Yr is down 1.7bps at 0.2138%,
10-Yr is down 1.3bps at 0.5331%, and 30-Yr is down 1.1bps at 1.1962%.
TECHNICALS:
US 10YR FUTURE TECHS: (U0) Uptrend Extends
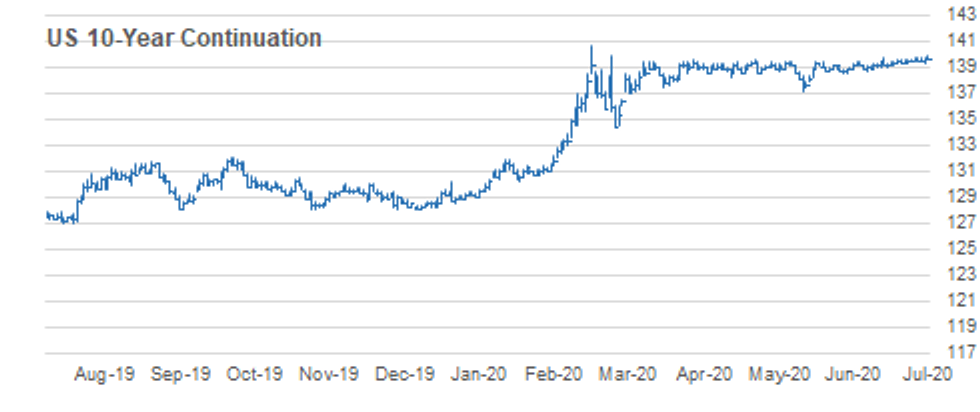
RES 4: 141-00 1.0% 10-dma envelope
RES 3: 140-22+ High Mar 9 and key resistance (cont)
RES 2: 140-20 1.00 projection of Jun 5 - 11 rally from Jun 16 low
RES 1: 140-06 Jul 31 high
PRICE: 140-02 @ 16:23 BST Jul 31
SUP 1: 139-08 Low Jul 28
SUP 2: 139-00+ Low Jul 13
SUP 3: 138-23+ Low Jul 2 and key near-term support
SUP 4: 138-07 Low Jun 16 and reversal trigger
10yr futures continue to push higher and the outlook remains bullish. 139-25,
Mar 25 and Jul 24 high has been cleared this week. This confirms a break of a
key resistance and has also confirmed a resumption of the underlying uptrend
with attention on the March high at 140-22+. On the downside, key support has
been defined at 139-08, Jul 28 low a break of which would dent the current
bullish tone.
AUSSIE 3-YR TECHS: (U0) Holding Above Its Key Support
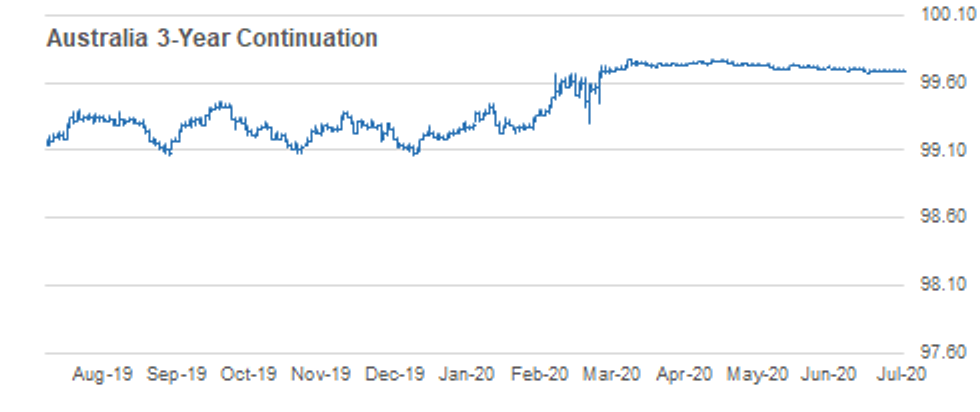
RES 3: 99.780 - High Apr 01 and bull trigger
RES 3: 99.750 - High May 21 and 22
RES 1: 99.730 - Congestion highs between Jun 15 - 22
PRICE: 99.700 @ 16:28 BST Jul 31
SUP 1: 99.680 - Low Jun 14 / Jul 22
SUP 2: 99.667 - 23.6% retracement of the March - April Rally
SUP 3: 99.597 - 38.2% retracement of the Mar - Apr rally
The short-end of the Aussie bond space traded lower recently but has held above
recent lows of 99.680, the Jul 14 low and a new low watermark. A break of this
support would signal scope for an extension lower towards Fibonacci support at
99.667 and 99.597, both Fibonacci retracement levels. On the upside, the key
hurdle for bulls remains the 99.730 congestion, highs between Jun 15 - 22. A
break would instead open 99.780, Apr 1 high further out.
AUSSIE 10-YR TECHS: (U0) Bulls Back in Driving Seat
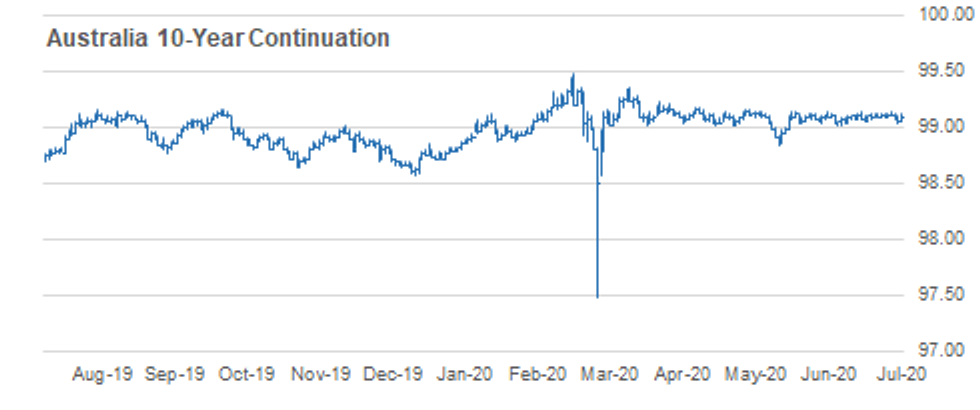
RES 3: 99.3600 - High Apr 02
RES 2: 99.2250 - High Apr 17
RES 1: 99.1650 - High Jul 31
PRICE: 99.1400 @ 16:26 BST, Jul 31
SUP 1: 99.0200 - Low Jul 2 and 3
SUP 2: 98.9750 - 50.0% retracement of the Jun 8 - Jul 13 rally
SUP 3: 98.9361 - 61.8% retracement of the Jun 8 - Jul 13 rally
Aussie 10yr futures crept higher into the weekly close, hitting 99.1650. This
cements the bullish focus for now, and bumps upside targets higher. This opens
99.2250, Apr 17 high. On the downside, initial key key support has for now been
defined at 99.0200, Jul 2 / 3 low. A break would expose a deeper decline towards
98.9750 instead. a Fibonacci retracement.
JGB TECHS: (U0): Slips Into Friday Close
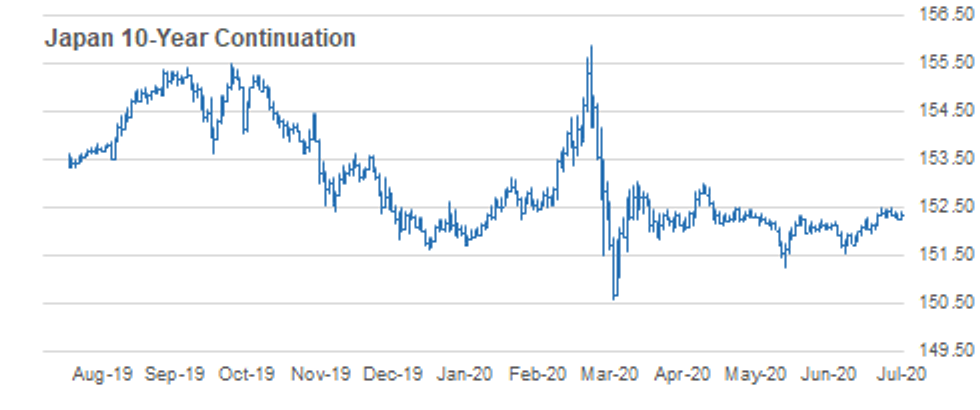
RES 3: 153.06 - High Mar 31 and key resistance
RES 2: 152.77 - 200-dma
RES 1: 152.50 - High Jul 17 and the bull trigger
PRICE: 152.27 @ 16:31 BST, Jul 31
SUP 1: 151.57 - Low Jul 2 and key support
SUP 2: 151.26 - Jun 8 low
SUP 3: 150.61 - Low Mar 19 and key support
JGBs were sold into the Friday close on little news, but price action more
closely resembled bullish exhaustion rather than any trend change. Prices look
most likely to consolidate from here, with resistance at 152.50 capping any
progression of the bullish theme. Key support has been defined at 151.57, Jul 2
low.
TSY FUTURES CLOSE: Rates bounced off second half lows on late month end buying.
TYU volume over 1.12M after the bell on +250k market on close (MOC) buying,
USU saw +56K. Yld curves see-sawed to mixed levels. Update:
- 3M10Y -0.807, 44.18 (L: 41.198 / H: 47.125)
- 2Y10Y -0.135, 42.182 (L: 40.52 / H: 44.374)
- 2Y30Y +0.059, 108.496 (L: 106.197 / H: 111.416)
- 5Y30Y +0.771, 98.242 (L: 95.787 / H: 100.13)
- Current futures levels:
- Sep 2Y up 0.875/32 at 110-15.75 (L: 110-14.625 / H: 110-15.875)
- Sep 5Y up 2.25/32 at 126-3.75 (L: 125-31.75 / H: 126-04.5)
- Sep 10Y up 3/32 at 140-3.5 (L: 139-28 / H: 140-06)
- Sep 30Y up 2/32 at 182-12 (L: 181-21 / H: 182-26)
- Sep Ultra 30Y up 4/32 at 227-27 (L: 226-08 / H: 228-24)
MONTH END EXTENSIONS: Final Bloomberg-Barclays US month-end index extension; forecast
summary compared to the avg increase for prior year and the same time in 2019.
TIPS 0.13Y; Govt inflation-linked, 0.22.
| EST | 1Y AVG | LAST YR | |
| US TSYS | 0.09 | 0.09 | 0.06 |
| AGENCIES | 0.05 | 0.04 | 0.09 |
| CREDIT | 0.08 | 0.12 | 0.08 |
| GOVT/CREDIT | 0.08 | 0.10 | 0.07 |
| MBS | 0.06 | 0.07 | 0.05 |
| AGGREGATE | 0.08 | 0.09 | 0.06 |
| LONG GOV/CREDIT | 0.07 | 0.09 | 0.07 |
| INTERMEDIATE CR | 0.08 | 0.10 | 0.07 |
| INTERMEDIATE GOV | 0.08 | 0.08 | 0.06 |
| INTERMEDIATE GOV/CR | 0.08 | 0.09 | 0.07 |
| HIGH YIELD | 0.10 | 0.11 | 0.05 |
US TSYS/SUPPLY: Preview next week's auction schedue:
DATE TIME AMOUNT SECURITY (CUSIP)/ANNC
-------------------------------------------------
03 Aug 1130ET $54B 13W Bill (912796TP4)
03 Aug 1130ET $51B 26W Bill (9127963W7)
04 Aug 1130ET $30B 42D Bill (912796TU3)
04 Aug 1130ET $30B 119D Bill (9127962G3)
06 Aug 1130ET TBA 4W Bill 04 Aug Annc
06 Aug 1130ET TBA 8W Bill 04 Aug Annc
US EURODLR FUTURES CLOSE: At/Near Session Highs
Near where the session started actually, futures back to steady in the short
end, Reds through Golds firmer. Update:
Sep 20 steady at 99.780
Dec 20 steady at 99.745
Mar 21 +0.005 at 99.830
Jun 21 +0.005 at 99.850
Red Pack (Sep 21-Jun 22) +0.005 to +0.010
Green Pack (Sep 22-Jun 23) +0.010 to +0.015
Blue Pack (Sep 23-Jun 24) +0.010 to +0.015
Gold Pack (Sep 24-Jun 25) +0.010 to +0.010
US DOLLAR LIBOR: Latest settles:
O/N +0.0022 at 0.0872% (+0.0023/wk)
1 Month -0.0007 to 0.1549% (-0.0177/wk)
3 Month -0.0022 to 0.2487% (+0.0019/wk)
6 Month -0.0087 to 0.3061% (-0.0122/wk)
1 Year -0.0079 to 0.4486% (-0.0109/wk)
STIR: Federal Reserve Bank of New York EFFR for prior session:
Daily Effective Fed Funds Rate: 0.10% volume: $47B
Daily Overnight Bank Funding Rate: 0.09%, volume: $151B
US TSYS: REPO REFERENCE RATES:
* Secured Overnight Financing Rate (SOFR): 0.10%, $942B
* Broad General Collateral Rate (BGCR): 0.08%, $392B
* Tri-Party General Collateral Rate (TGCR): 0.08%, $378B
(rate, volume levels reflect prior session)
FED: NY Fed operational purchase
Tsy 2.25Y-4.5Y, $8.801B accepted of $24.940B submitted
Next week's schedule
* Tue 08/04 1010-1030ET: TIPS 7.5Y-30Y, appr $1.225B
* Wed 08/05 1100-1120ET: Tsy 4.5Y-7Y, appr $6.025B
* Thu 08/06 1010-1030ET: Tsy 20Y-30Y, appr $1.750B
OUTLOOK: *** US Data/speaker calendar (prior, estimate):
03-Aug ---- Jul NA-made light vehicle sales SAAR (13.05M, 14.0M)
03-Aug 0945 Jul IHS Markit Mfg Index (final) (51.3, 51.3)
03-Aug 1000 Jul ISM Mfg Index (52.6, 53.6), New Orders (56.4, 55.2)
03-Aug 1000 Jun construction spending (-2.1%, 1.0%)
03-Aug 1130 US Tsy $54B 13W Bill auction (912796TP4)
03-Aug 1130 US Tsy $51B 26W Bill auction (9127963W7)
03-Aug 1230 STL Fed Pres Bullard on eco/mon-pol
03-Aug 1300 Richmond Fed Pres virtual eco/mon-pol roundtable
03-Aug 1400 Chi Fed Pres Evans virtual eco/mon-pol roundtable
PIPELINE: Limited Friday issuance. Expect surge in high-grade issuance next week
as latest earnings cycle winds down, estimated $20-30B.
Date $MM Issuer (Priced *, Launch #)
07/31 $210M *Kobe City 5Y +50
-
$2.5B Priced Thursday; $21.5B total/wk
07/30 $1.25B *Enterprise Products Op $250M 30Y +140, $1B 52Y +205
07/30 $750M *Truist Financial 7Y +75
07/30 $500M *Nordic Inv Bank 2Y +3
EURODOLLAR/TREASURY OPTIONS
Eurodollar options:
Another +10,000 Dec 97/98 1x2 call spds, 1.75, >23k total
3,950 Red Dec'21 98 puts vs. Red Mar'22 98 straddles
buyer short Sep 96/97 put spds 0.5 vs. 99.83
over +13,000 Dec 97/98 1x2 call spds, 1.75
over +10,000 Sep 97/98 call spds, 3.75
+15,000 short Dec 98/100/100.12 call flys, 1.0
More modest put trade:
2,000 Green Sep 96/97 put spds
total 3,500 Blue Oct 93/95 put spd
3,600 Jun 95/96/97 put flys
Upside call skew bid over corresponding OTM puts resumes
after decent pick-up Thursday. Overnight recap:
over +13,000 Dec 97/98 1x2 call spds, 1.75
over +10,000 Sep 97/98 call spds, 3.75
+15,000 short Dec 98/100/100.12 call flys, 1.0
5,000 Sep 97 puts, 1.0
2,500 Green Oct 95/96 put spds w/Blue Oct 93/95 put spd
Tsy Options:
-7,000 FVU 126/126.5 call spds 3.5 over FVV 126.5/127 call spd
+1,500 FVZ 126 calls, 38-38.5
US TSY OPTIONS: Scale 5Y Call Seller
* -5,000 FVU 125.75 calls, 25.5-25/64, Unwind
* 7,000 FVV 126.5/126 2x1 call spds soon after
* 5,000 wk2 TY 140/140.5 1x2 call spds, 1/64
As the month end..............>
GLOBAL MARKET/OPINION: As the month end approaches, there is a lot of talk of a
significant rebalance by balanced fund/pension funds but the impetus for this
has faded somewhat as equities declined this week.
- To give some perspective for Europe, the eurostoxx index has provided a
negative 3.9% total return so far this month and the Bloomberg-Barclays
aggregate bond index has lost 0.16%. Looking at monthly swings between bonds and
equities over the past ten years, this would be in the 74th percentile that
favours buying equities. It is the largest flow to European equities since June
2016.
- In the US, the situation is also stretched with the S&P providing a negative
2.7% total return and the Bloomberg-Barclays aggregate bond index down 0.99%.
Looking at monthly swings between bonds and equities over the past ten years,
this would be in the 88th percentile that favours buying equities i.e. one of
the largest switches back to equities and largest since Jan 2016.
Why MNI
MNI is the leading provider
of intelligence and analysis on the Global Fixed Income, Foreign Exchange and Energy markets. We use an innovative combination of real-time analysis, deep fundamental research and journalism to provide unique and actionable insights for traders and investors. Our "All signal, no noise" approach drives an intelligence service that is succinct and timely, which is highly regarded by our time constrained client base.Our Head Office is in London with offices in Chicago, Washington and Beijing, as well as an on the ground presence in other major financial centres across the world.