-
Policy
Policy
Exclusive interviews with leading policymakers that convey the true policy message that impacts markets.
LATEST FROM POLICY: -
EM Policy
EM Policy
Exclusive interviews with leading policymakers that convey the true policy message that impacts markets.
LATEST FROM EM POLICY: -
G10 Markets
G10 Markets
Real-time insight on key fixed income and fx markets.
Launch MNI PodcastsFixed IncomeFI Markets AnalysisCentral Bank PreviewsFI PiFixed Income Technical AnalysisUS$ Credit Supply PipelineGilt Week AheadGlobal IssuanceEurozoneUKUSDeep DiveGlobal Issuance CalendarsEZ/UK Bond Auction CalendarEZ/UK T-bill Auction CalendarUS Treasury Auction CalendarPolitical RiskMNI Political Risk AnalysisMNI Political Risk - US Daily BriefMNI Political Risk - The week AheadElection Previews -
Emerging Markets
Emerging Markets
Real-time insight of emerging markets in CEMEA, Asia and LatAm region
-
Commodities
-
Credit
Credit
Real time insight of credit markets
-
Data
-
Global Macro
Global Macro
Actionable insight on monetary policy, balance sheet and inflation with focus on global issuance. Analysis on key political risk impacting the global markets.
Global MacroDM Central Bank PreviewsDM Central Bank ReviewsEM Central Bank PreviewsEM Central Bank ReviewsBalance Sheet AnalysisData AnalysisEurozone DataUK DataUS DataAPAC DataInflation InsightEmployment InsightGlobal IssuanceEurozoneUKUSDeep DiveGlobal Issuance Calendars EZ/UK Bond Auction Calendar EZ/UK T-bill Auction Calendar US Treasury Auction Calendar Global Macro Weekly -
About Us
To read the full story
Sign up now for free trial access to this content.
Please enter your details below.
Why MNI
MNI is the leading provider
of intelligence and analysis on the Global Fixed Income, Foreign Exchange and Energy markets. We use an innovative combination of real-time analysis, deep fundamental research and journalism to provide unique and actionable insights for traders and investors. Our "All signal, no noise" approach drives an intelligence service that is succinct and timely, which is highly regarded by our time constrained client base.Our Head Office is in London with offices in Chicago, Washington and Beijing, as well as an on the ground presence in other major financial centres across the world.
Real-time Actionable Insight
Get the latest on Central Bank Policy and FX & FI Markets to help inform both your strategic and tactical decision-making.
Free AccessMNI UST Issuance Deep Dive: Dec 2024
MNI US Employment Insight: Soft Enough To Keep Fed Cutting
MNI ASIA MARKETS ANALYSIS: Jobs Data Green Lights Rate Cuts
MNI US Morning FX Analysis - EUR/GBP Dips to Multi-Month Low
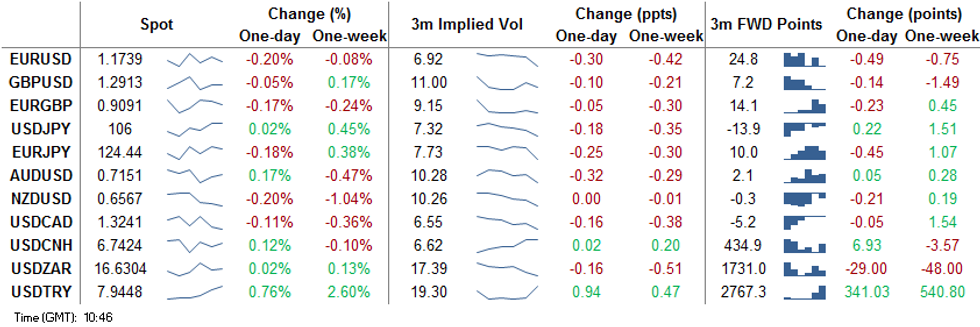
EUR/GBP Dips to Multi-Month Low
EUR/USD sits below the Monday low headed into the NY crossover, with support at 1.1796 giving way. Moves in currency markets this morning have not been headline driven, but crosses including EURGBP may be adding some weight to the single currency. The cross broke below the 200-dma at 0.8924 for the first time since May, helping GBP sit at the top of the G10 pile early Tuesday.
Sterling may be getting some support as markets rush to price out the likelihood of lower rates in the UK next year (driven by yesterday's vaccine-induced rally), and could be benefitting from resistance in the House of Lords yesterday to the government's Internal Markets Bill, which could make including the elements that run against international law more difficult.
While GBP outperforms, EUR is lagging alongside CHF and SEK.
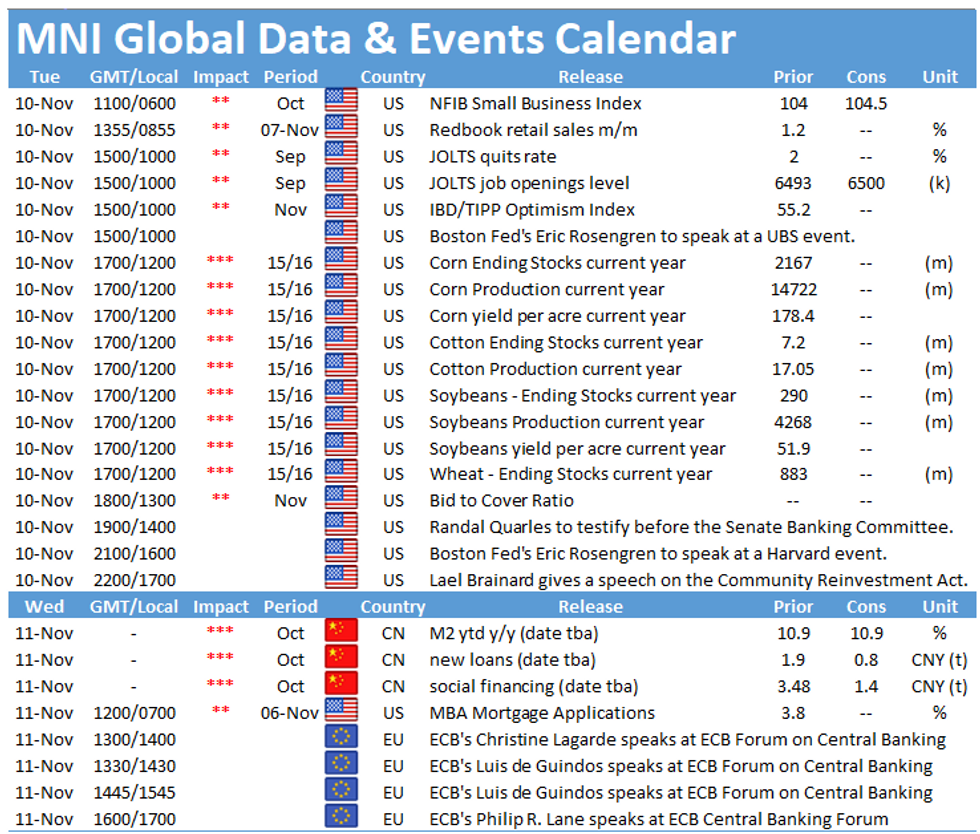
Fedspeak tops the agenda Tuesday, with speeches due from Kaplan, Rosengren, Bostic, Quarles and Brainard. There is no data of note.
EUR/USD TECHS: Corrective Pullback
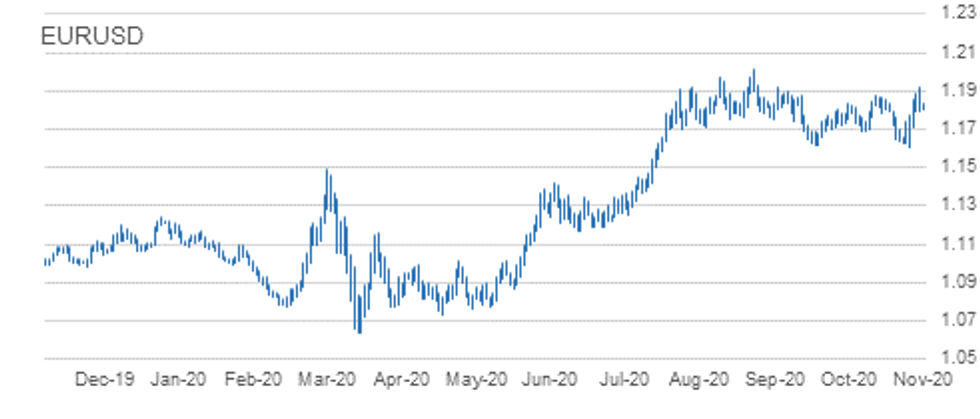
- RES 4: 1.2011 High Sep 1 and major resistance
- RES 3: 1.1981 2.0% 10-dma envelope
- RES 2: 1.1971 3.0% Upper Bollinger Band
- RES 1: 1.1920 High Nov 9
- PRICE: 1.1793 @ 10:43 GMT Nov 10
- SUP 1: 1.1768 20-day EMA
- SUP 2: 1.1750 50-day EMA
- SUP 3: 1.1711 Low Nov 5
- SUP 4: 1.1603 Low Nov 4 and the bear trigger
EURUSD retraced yesterday and is softer this morning. The move lower however is likely a correction with the pair maintaining a bullish tone following last week's gains and the breach of 1.1881, Oct 21 high. The break higher paves the way for a climb towards 1.2011, Sep 1 high. Today's bull trigger is 1.1920, yesterday's high. On the downside, key support has been defined at 1.1603. A move below this support is required to reinstate a bearish threat.
GBP/USD TECHS: Needle Points North
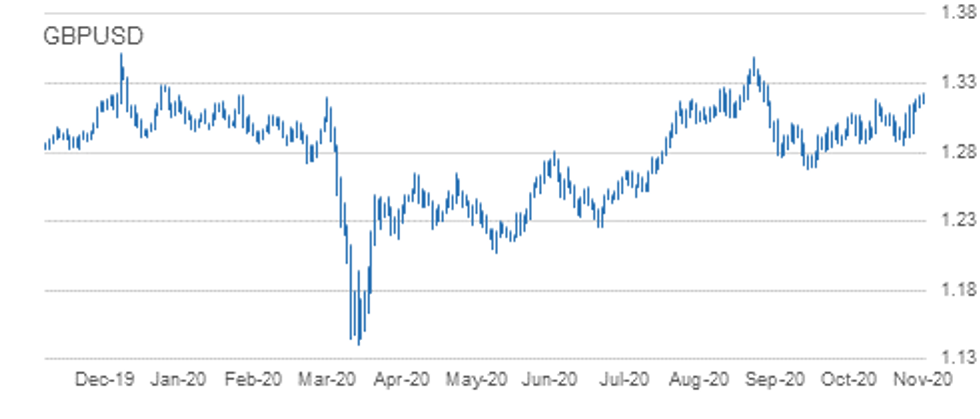
- RES 4: 1.3357 High Sep 3
- RES 3: 1.3319 High Sep 4
- RES 2: 1.3292 76.4% retracement of the Sep 1 - 23 sell-off
- RES 1: 1.3260 Intraday high
- PRICE: 1.3245 @ 10:47 GMT Nov 10
- SUP 1: 1.3157 Intraday low
- SUP 2: 1.3093 Low Nov 6
- SUP 3: 1.3028 20-day EMA
- SUP 4: 1.2911 Low Nov 3
GBPUSD started the week on a strong note following last week's gains and remains firm. Importantly, the pair has breached key resistance at 1.3177, Oct 21 and Nov 6 high. The break above this level signals scope for further strength with attention turning to 1.3292 next, 76.4% of the Sep 1 - 23 sell-off. Note that price has traded above the 61.8% retracement at 1.3174. Initial support lies at 1.3157 ahead of Friday's 1.3093 low.
EUR/GBP TECHS: Breaks Support And Resumes Downtrend
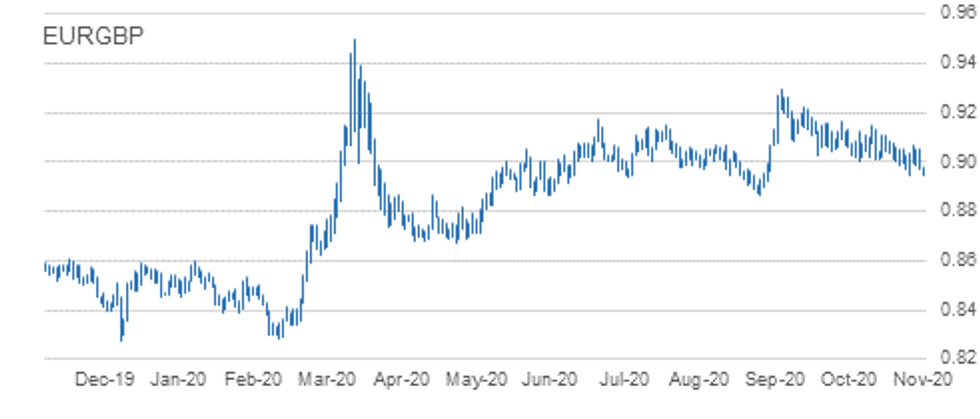
- RES 4: 0.9149 Oct 20 high
- RES 3: 0.9107 High Oct 23
- RES 2: 0.9069 High Nov 5 / Trendline drawn off the Sep 11 high
- RES 1: 0.8982 Intraday high
- PRICE: 0.8912 @ 10:25 GMT Nov 10
- SUP 1: 0.8904 Intraday low
- SUP 2: 0.8900 Low Sep 4
- SUP 3: 0.8866 Low Sep 3 and a key support
- SUP 4: 0.8830 Low May 15
EURGBP has traded sharply lower this morning clearing 0.8946, Nov 4 low and the bear trigger. The break lower negates a recent bullish candle pattern and instead confirms a resumption of the underlying downtrend that has been in place since Sep 11. Note too that trendline resistance drawn off the Sep 11 high remains intact, reinforcing the current bearish theme. Attention turns to 0.8866, Sep 3 low. Initial resistance is at 0.8982, the intraday high.
USD/JPY TECHS: Bullish Engulfing Candle highlights A Reversal
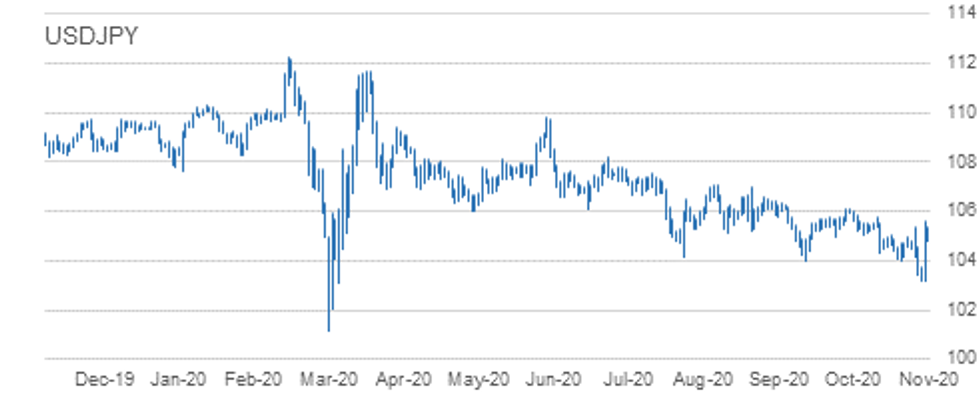
- RES 4: 106.55 High Sep 3
- RES 3: 106.11 High Oct 8
- RES 2: 105.89 100 dma
- RES 1: 105.65 High Nov 9 and the intraday bull trigger
- PRICE: 105.44 @ 10:49 GMT Nov 10
- SUP 1: 104.42 50.0% retracement of yesterday's range
- SUP 2: 103.18/09 Low Nov 6 / Low Mar 12 and key support
- SUP 3: 102.02 Low Mar 10
- SUP 4: 101.29 Bear channel base drawn off the Mar 24 high
USDJPY rallied sharply higher Monday defining a key short-term support at 103.18, Nov 6 low. In candle terms, yesterday's price pattern is a bullish engulfing line and highlights a potential reversal in sentiment. A break of 105.65, the Monday high would reinforce this set-up and signal scope for a climb towards the 100-dma at 105.89 and the early October highs of 106.11. Initial support is seen at 104.42, 50.0% of yesterday's trading range.
EUR/JPY TECHS: Bear Channel Breakout
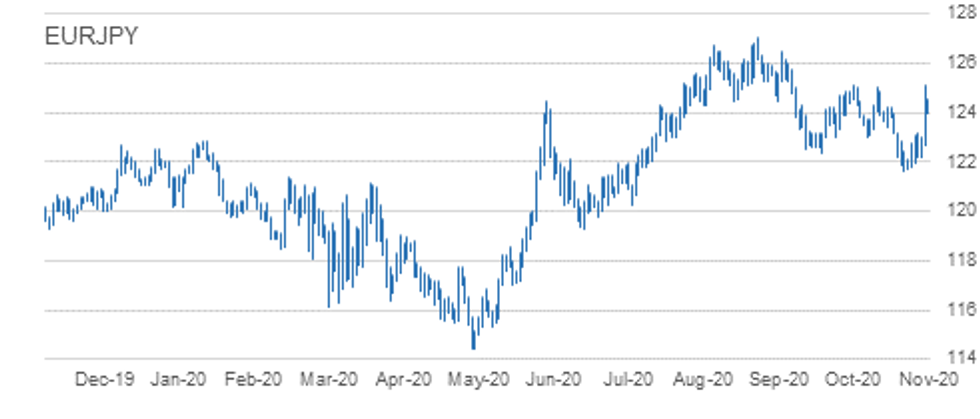
- RES 4: 127.08 High Sep 1 and primary resistance
- RES 3: 126.46 High Sep 10
- RES 2: 125.79 76.4% retracement of the Sep - Oct Sell-Off
- RES 1: 125.13 High Nov 9
- PRICE: 124.27 @ 10:50 GMT Nov 10
- SUP 1: 123.99 Intraday low
- SUP 2: 122.69 Low Nov 9
- SUP 3: 122.21 Low Nov 5
- SUP 4: 121.62 Low Oct 30 and key support
EURJPY traded sharply higher yesterday alongside the broad risk-on rally Monday. This solidly counters the underlying bearish theme, with markets convincingly breaking above resistance highlighted by the 20- and 50-day EMA's. Furthermore, the cross has also cleared its bear channel resistance drawn off the Sep 1 high. This has opened 125.79, a Fibonacci retracement ahead of the early September highs of 126.46. Support is at 122.69.
AUD/USD TECHS: Needle Still Points North
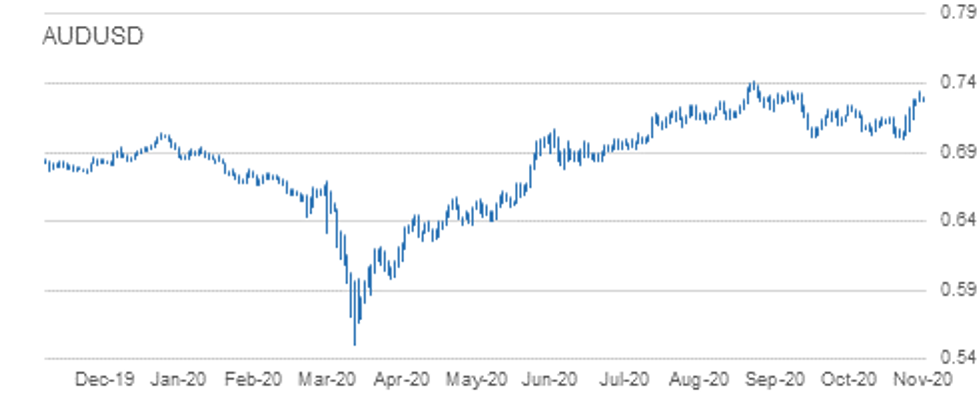
- RES 4: 0.7414 High Sep 1
- RES 3: 0.7360 3.0% 10-dma envelope
- RES 2: 0.7345 High Sep 16
- RES 1: 0.7340 High Nov 9
- PRICE: 0.7273 @ 10:53 GMT Nov 10
- SUP 1: 0.7239 Low Nov 6
- SUP 2: 0.7145 Low Nov 5
- SUP 3: 0.7100 Former trendline resistance drawn off the Sep 1 high
- SUP 4: 0.7049 Low Nov 4
AUDUSD maintains a bullish tone. The pair rallied sharply higher last week reinforcing the significance of the recent trendline break drawn off the Sep 1 high. Gains on Nov 5 also resulted in a break of former resistance at 0.7243, Oct 9 high. With bullish conditions strengthened, scope is seen for a climb towards 0.7345 next, Sep 16 high. Initial firm support is seen at 0.7145. A break would undermine the current bullish outlook.
USD/CAD TECHS: Bearish Having Cleared The 2019 Low
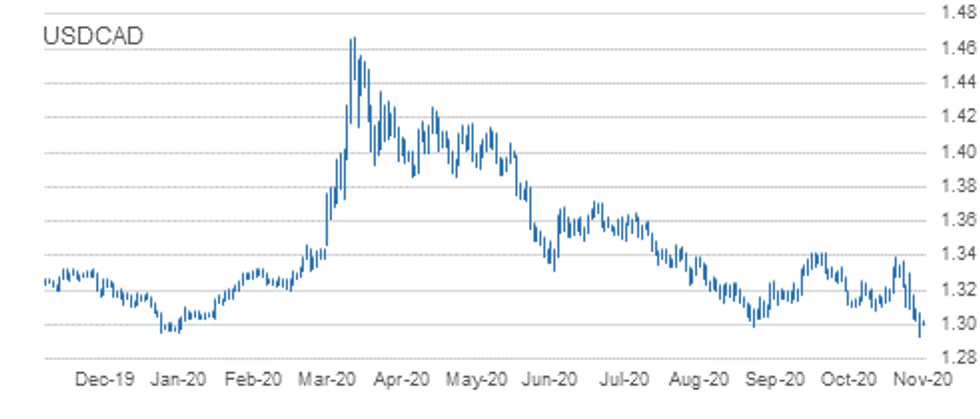
- RES 4: 1.3300 High Nov 4
- RES 3: 1.3215 50-day EMA
- RES 2: 1.3178 High Nov 5
- RES 1: 1.3081 Low Oct 21
- PRICE: 1.3035 @ 10:58 GMT Nov 10
- SUP 1: 1.2929/17 Low Nov 9 / Low Oct 16, 2018
- SUP 2: 1.2912 2.0% 10-dma envelope
- SUP 3: 1.2857 Low Oct 4, 2018
- SUP 4: 1.2783 Low Oct, 1 2018 and a key support
USDCAD traded lower yesterday extending the most recent sell-off from 1.3390, Oct 29 high. More importantly, the pair fell solidly through the Dec 31 2019 lows, hitting the lowest level since mid-2018 in the process. Various levels of support, most notably 1.2952, the Dec 2019 low gave way Monday. This reinforces the bearish them and opens 1.2917 and 1.2857, the Oct 16 and Oct 4, 2018 lows respectively. 1.3081 is seen as a firm resistance.
EUR/USD: MNI KEY LEVELS
- *$1.2084 May01-2018 high
- *$1.2032 May02-2018 high
- *$1.2009/11 May03-2018 high/YTD Sep01 high
- *$1.1996 May14-2018 high
- *$1.1985 Upper Boll Band (3%), Upper 2.0% 10-dma env
- *$1.1938 May15-2018 high
- *$1.1914 Upper Bollinger Band (2%)
- *$1.1867 Upper 1.0% 10-dma envelope
- *$1.1850/51 100-mma/Jun14-2018 high
- *$1.1840 Intraday high
- *$1.1836 ***CURRENT MARKET PRICE 08:35GMT TUESDAY***
- *$1.1820/15 100-hma/Sep24-2018 high
- *$1.1807 Intraday low
- *$1.1796 Cloud top
- *$1.1783 55-dma
- *$1.1774/69 50-dma/21-dma
- *$1.1758/57 Cloud base/Sep27-2018 high
- *$1.1744 200-hma
- *$1.1736 Fibo 38.2% 1.3993-1.0341
- *$1.1691 100-dma
- *$1.1651 Sep28-2018 high
GBP/USD: MNI KEY LEVELS
- *$1.3472 Jun07-2018 high
- *$1.3442/47 Upper3.0% 10-dma env/Jun14-2018 high
- *$1.3408 Fibo 38.2% 1.1841-1.4377
- *$1.3380/81 50% 1.4377-1.2382/Mar13-2019 high
- *$1.3363 Jul09-2018 high
- *$1.3311/12/16 Mar19-2019 high/Upper 2.0% 10-dma env/Upper Boll Band (3%)
- *$1.3276 Mar20-2019 high
- *$1.3269 Mar27-2019 high
- *$1.3220/24 Upper Boll Band (2%)/Intraday high
- *$1.3213 Mar28-2019 high
- *$1.3209 ***CURRENT MARKET PRICE 08:35GMT TUESDAY***
- *$1.3196 Apr03-2019 high
- *$1.3191 Apr04-2019 high
- *$1.3185/81 May06-2019 high/Upper 1.0% 10-dma env
- *$1.3157 Intraday low
- *$1.3144 Fibo 38.2% 1.4377-1.2382
- *$1.3133/31 Apr12-2019 high/May07-2019 high
- *$1.3111/09 100-hma/50% 1.1841-1.4377
- *$1.3080/79 May08-2019 high/Cloud top
- *$1.3041 May13-2019 high
- *$1.3030 200-hma
EUR/GBP: MNI KEY LEVELS
- *Gbp0.9100 Cloud top
- *Gbp0.9094 Upper 1.0% 10-dma envelope
- *Gbp0.9079 Cloud base
- *Gbp0.9074 50-dma
- *Gbp0.9061/62 55-dma/Jan11-2019 high
- *Gbp0.9048/51 Jul16-2019 high/Jul17-2019 high, 100-dma
- *Gbp0.9037/39 21-dma/Jul18-2019 high
- *Gbp0.9010/13/15 Jul10-2019 high/200-hma/100-hma
- *Gbp0.9000/05 Jul22-2019 high/Jul23-2019 high
- *Gbp0.8981 Intraday high
- *Gbp0.8960 ***CURRENT MARKET PRICE 08:35GMT TUESDAY***
- *Gbp0.8953/49 Jul23-2019 low/Intraday low
- *Gbp0.8946 Lower Bollinger Band (2%)
- *Gbp0.8924/21 200-dma/Jul02-2019 low
- *Gbp0.8914 Lower 1.0% 10-dma envelope
- *Gbp0.8902 Lower Bollinger Band (3%)
- *Gbp0.8874/73/72 Jun19-2019 low/Jun20-2019 low/Jun12-2019 low
- *Gbp0.8865 Fibo 61.8% 0.9108-0.8473
- *Gbp0.8830 Jun06-2019 low
- *Gbp0.8824/22 Lower 2.0% 10-dma env/May31-2019 low, 100-wma
- *Gbp0.8816 200-wma
USD/JPY: MNI KEY LEVELS
- *Y106.57 Fibo 38.2% 75.35-125.86
- *Y106.54 Upper 2.0% 10-dma envelope
- *Y106.52 Upper Boll Band (3%), 61.8% 99.02-118.66
- *Y105.93 Upper Bollinger Band (2%)
- *Y105.88 100-dma
- *Y105.53 Cloud top
- *Y105.50 Upper 1.0% 10-dma envelope
- *Y105.38 Intraday high
- *Y105.32 55-dma
- *Y105.26/31 50-dma/Cloud base
- *Y105.00 ***CURRENT MARKET PRICE 08:35GMT TUESDAY***
- *Y104.87 Jan03-2019 low
- *Y104.82 Intraday low
- *Y104.78 21-dma
- *Y104.65 Cloud Kijun Sen
- *Y104.56 Mar26-2018 low
- *Y104.42 Cloud Tenkan Sen
- *Y104.36 200-hma
- *Y104.09 100-hma
- *Y103.94 200-mma
- *Y103.57 Lower Bollinger Band (2%)
EUR/JPY: MNI KEY LEVELS
- *Y125.21 200-wma
- *Y125.19 Upper 2.0% 10-dma envelope
- *Y125.09 Upper Bollinger Band (2%)
- *Y125.04 Apr11-2019 low
- *Y124.96 50-mma
- *Y124.93 Fibo 38.2% 149.78-109.57
- *Y124.73 Cloud top
- *Y124.53 Intraday high
- *Y124.51 Fibo 61.8% 126.81-120.78
- *Y124.34 Apr01-2019 low
- *Y124.28 ***CURRENT MARKET PRICE 08:35GMT TUESDAY***
- *Y124.25/22 May07-2019 high/38.2% 133.13-118.71
- *Y124.14 38.2% 118.71-127.50, Cloud base
- *Y124.11 55-dma
- *Y123.99 Intraday low
- *Y123.96 Upper 1.0% 10-dma envelope
- *Y123.93 50-dma
- *Y123.80 Fibo 50% 126.81-120.78
- *Y123.76 100-dma
- *Y123.74 May21-2019 high
- *Y123.72 Fibo 61.8% 115.21-137.50
AUD/USD: MNI KEY LEVELS
- *$0.7484 Jul10-2018 high
- *$0.7463/64 Jul26-2018 high/Jul25-2018 high
- *$0.7453 Aug09-2018 high
- *$0.7425 Fibo 38.2% 0.8136-0.6985
- *$0.7414 YTD Sep01 high
- *$0.7393/94 Upper Boll Band (3%)/Dec04-2018 high
- *$0.7376 Upper 3.0% 10-dma envelope
- *$0.7356 Dec05-2018 high
- *$0.7305/07 Upper 2.0% 10-dma env/Upper Boll Band (2%)
- *$0.7293/95 Intraday high/Jan31-2019 high
- *$0.7287 ***CURRENT MARKET PRICE 08:35GMT TUESDAY***
- *$0.7274 Dec06-2018 high
- *$0.7267 Intraday low
- *$0.7253/50 50-mma/100-hma
- *$0.7242 200-wma
- *$0.7233 Upper 1.0% 10-dma envelope
- *$0.7210/07/06 Cloud top/Feb21-2019 high/Apr17-2019 high
- *$0.7190 55-dma
- *$0.7177 50-dma
- *$0.7159/54 Cloud base/200-hma
- *$0.7153 Apr17-2019 low
USD/CAD: MNI KEY LEVELS
- *C$1.3159/62/63 200-wma/21-dma/Feb21-2019 low
- *C$1.3150/51 Feb20-2019 low/Jun20-2019 low
- *C$1.3120 Fibo 61.8% 1.2783-1.3665
- *C$1.3113/16 Feb25-2019 low/Jul23-2019 low
- *C$1.3107 Jun26-2019 low
- *C$1.3061/66 100-hma/38.2% 1.4690-1.2062
- *C$1.3053 Fibo 38.2% 1.2062-1.3665
- *C$1.3027 Lower 1.0% 10-dma envelope
- *C$1.3021 Intraday high
- *C$1.3015 Oct25-2018 low
- *C$1.3013 ***CURRENT MARKET PRICE 08:35GMT TUESDAY***
- *C$1.2998 Intraday low
- *C$1.2976 Lower Bollinger Band (2%)
- *C$1.2970 Oct24-2018 low
- *C$1.2933/29 Oct17-2018 low/YTD Nov09 low
- *C$1.2917 Oct16-2018 low
- *C$1.2895/91 Lower 2.0% 10-dma env/Oct05-2018 low
- *C$1.2883 Lower Bollinger Band (3%)
- *C$1.2864 Fibo 50% 1.2062-1.3665
- *C$1.2857 Oct04-2018 low
- *C$1.2808 Oct03-2018 low
Expiries for Nov10 NY cut 1000ET (Source DTCC)
- EUR/USD: $1.1600(E587mln), $1.1695-1.1705(E2.1bln), $1.1800(E1.2bln), $1.1825-30(E561mln),
$1.1840-50(E672mln), $1.2000(E615mln), $1.2100(E674mln) - USD/JPY: Y103.00($1.5bln-USD puts), Y103.75($1.1bln), Y104.00($515mln), Y104.30($715mln),
Y104.40-50($3.0bln), Y104.75($953mln), Y105.00-05($1.6bln), Y105.50($980mln) - AUD/USD: $0.6930-35(A$820mln)
- AUD/JPY: Y78.45-50(A$523mln)
- USD/CAD: C$1.3195-00($500mln)
Larger Option Pipeline
- EUR/USD: Nov11 $1.1650-55(E1.1bln), $1.1830-35(E1.0bln); Nov13 $1.2000(E1.78bln-EUR calls); Nov17 $1.1850(E1.2bln-EUR calls)
- USD/JPY: Nov12 Y103.00($1.9bln-USD puts), Y105.40-50($1.3bln); Nov13 Y101.00($995mln-USD puts)
- EUR/JPY: Nov16 Y123.00(E1.25bln)
- EUR/AUD: Nov12 A$1.6520(E973mln)
- AUD/NZD: Nov16 N$1.0650(A$1.16bln)
- USD/CNY: Nov11 Cny6.65($1.0bln); Nov13 Cny6.60($1.1bln); Nov20 Cny6.60($1.0bln), Cny6.90($2.0bln)
To read the full story
Sign up now for free trial access to this content.
Please enter your details below.
Why MNI
MNI is the leading provider
of intelligence and analysis on the Global Fixed Income, Foreign Exchange and Energy markets. We use an innovative combination of real-time analysis, deep fundamental research and journalism to provide unique and actionable insights for traders and investors. Our "All signal, no noise" approach drives an intelligence service that is succinct and timely, which is highly regarded by our time constrained client base.Our Head Office is in London with offices in Chicago, Washington and Beijing, as well as an on the ground presence in other major financial centres across the world.
