
Free Trial
Why MNI
MNI is the leading provider
of intelligence and analysis on the Global Fixed Income, Foreign Exchange and Energy markets. We use an innovative combination of real-time analysis, deep fundamental research and journalism to provide unique and actionable insights for traders and investors. Our "All signal, no noise" approach drives an intelligence service that is succinct and timely, which is highly regarded by our time constrained client base.Our Head Office is in London with offices in Chicago, Washington and Beijing, as well as an on the ground presence in other major financial centres across the world.
Executive Summary:
- The S&P E-Minis contract has been in a downtrend since peaking early September.
- Technical trend signals are beginning to warn of a change in direction and if correct, highlight the risk of a deeper correction.
- The 20- and 50-day EMA's are reliable trend signals that clearly highlight this potential shift in market sentiment.
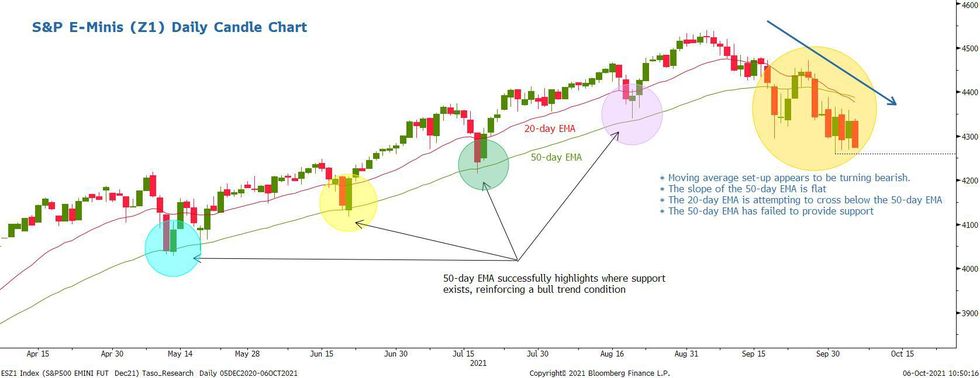
Fig 1. S&P E-Minis (Z1) and the change in the EMA set-up
On Sep 21, we discussed the importance of the sharp sell-off in the S&P E-Minis on Oct 20. It represented a bearish break but it was too early to determine whether this was merely part of a deeper short-term correction or the start of a much stronger bearish cycle instead. Technical trend signals, taking into account price activity since Sep 20, are beginning to display bearish threats and if correct, signal the potential for a deeper retracement.
The key factors to note are:
- Price remains below its 50-day EMA following a recent failed attempt to reestablish a base above this average. The EMA intersects at 4392.41 and currently represents resistance.
- Last week saw the contract clear support at 4293.75, Sep 20 low. This is an important breach as the move lower establishes a bearish price sequence of lower lows and lower highs.
- Previously, we have highlighted the importance of the 50-day EMA as a trend support and a parameter that highlights the direction of a trend. The bearish pressure that has dominated since the contract peaked early September appears to be resulting in a directional shift in the 50-day EMA. Its slope is flat and if price remains under pressure, this will likely result in a negative sloping EMA - a negative slope highlights a bear market.
- Furthermore, the 20-day EMA appears to be crossing below the 50-day average. A confirmed cross would reinforce a bearish theme. The relationship between the 20- and 50-day EMA is also an important input when assessing the direction of a trend.
- Key levels to watch:
- Initial key resistance is the 50-day EMA, currently at 4392.41 today. If breached, price will need to establish a base above this EMA to undermine the developing bearish threat. This would refocus attention on; 4472.00, Sep 27 high and 4539.50, the Sep 3 high and the key bull trigger.
- On the downside, the immediate bear trigger is 4260.00, the Oct 1 low and near-term bear trigger. A break would pave the way for weakness toward 4214.50, the Jul 19 low.
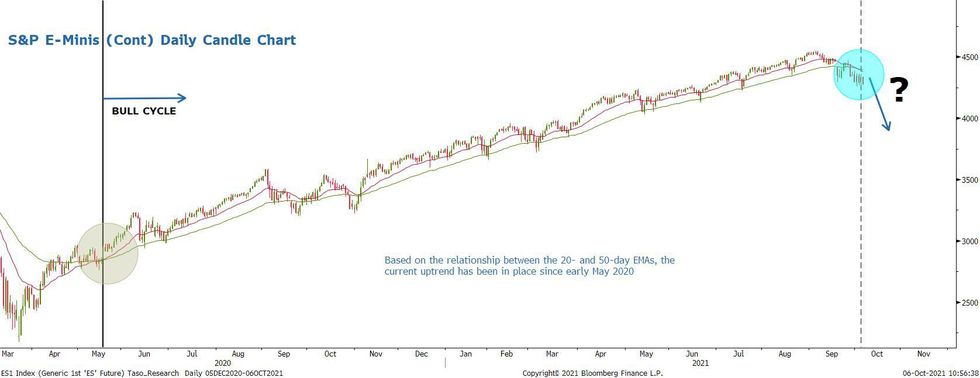
Fig 2. S&P E-Minis cont. chart highlighting the current bull cycle based on the EMA relationship
Why MNI
MNI is the leading provider
of intelligence and analysis on the Global Fixed Income, Foreign Exchange and Energy markets. We use an innovative combination of real-time analysis, deep fundamental research and journalism to provide unique and actionable insights for traders and investors. Our "All signal, no noise" approach drives an intelligence service that is succinct and timely, which is highly regarded by our time constrained client base.Our Head Office is in London with offices in Chicago, Washington and Beijing, as well as an on the ground presence in other major financial centres across the world.
We are facing technical issues, please contact our team.
ok
Your request was sent sucessfully! Our team will contact you soon.
ok