
Free Trial
Why MNI
MNI is the leading provider
of intelligence and analysis on the Global Fixed Income, Foreign Exchange and Energy markets. We use an innovative combination of real-time analysis, deep fundamental research and journalism to provide unique and actionable insights for traders and investors. Our "All signal, no noise" approach drives an intelligence service that is succinct and timely, which is highly regarded by our time constrained client base.Our Head Office is in London with offices in Chicago, Washington and Beijing, as well as an on the ground presence in other major financial centres across the world.
AUD
The relentless sell-off in AUD/JPY continues. The pair is down a further 0.88% so far today. Since this time last week, the pair has lost a little over -3.5%, see the chart below. This is the steepest 5 day drop since mid-May. As the chart suggests, outside of the onset of the Covid pandemic, in recent years we don't tend to see weekly falls stretch beyond the magnitude of -4% to -5%. Hence we aren’t too far off these levels.
- In the current context, the pair is close to early July lows around the 91.40/91.50 region (we last tracked 91.65/70 in AUD/JPY). Beyond these levels is the late May highs in the low 91.00 region.
- Weaker equity tones across the region and US futures (-0.50%) are adding to downside momentum in the pair
- The market has largely ignored the mixed Australian housing data from earlier. AUD/USD is down a little from NY closing levels to the low 0.7010/15 region.
- The value of home loans fell -4.4% (versus -3.0% expected), while building approvals only dipped by -0.7%, versus a -5.0% forecast dip.
Fig 1: AUD/JPY: Rolling Weekly Rate Of Change
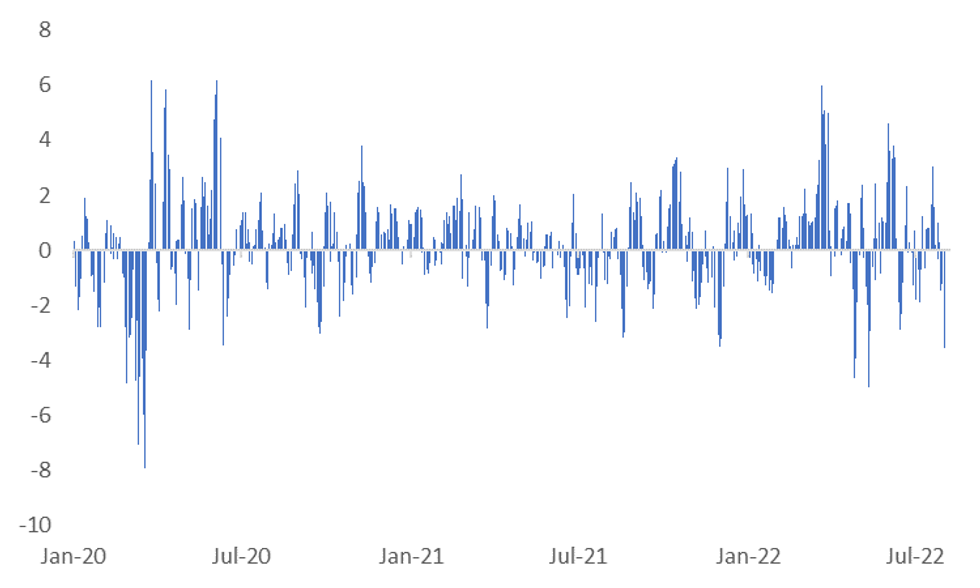 Source: MNI/ Market News/Bloomberg
Why MNI
MNI is the leading provider
of intelligence and analysis on the Global Fixed Income, Foreign Exchange and Energy markets. We use an innovative combination of real-time analysis, deep fundamental research and journalism to provide unique and actionable insights for traders and investors. Our "All signal, no noise" approach drives an intelligence service that is succinct and timely, which is highly regarded by our time constrained client base.Our Head Office is in London with offices in Chicago, Washington and Beijing, as well as an on the ground presence in other major financial centres across the world.
We are facing technical issues, please contact our team.
ok
Your request was sent sucessfully! Our team will contact you soon.
ok