
Why MNI
MNI is the leading provider
of intelligence and analysis on the Global Fixed Income, Foreign Exchange and Energy markets. We use an innovative combination of real-time analysis, deep fundamental research and journalism to provide unique and actionable insights for traders and investors. Our "All signal, no noise" approach drives an intelligence service that is succinct and timely, which is highly regarded by our time constrained client base.Our Head Office is in London with offices in Chicago, Washington and Beijing, as well as an on the ground presence in other major financial centres across the world.
Tech Focus: Price Signal Summary – EURJPY Bearish Engulfing Candle
- The technical pattern focus today is on EURJPY.
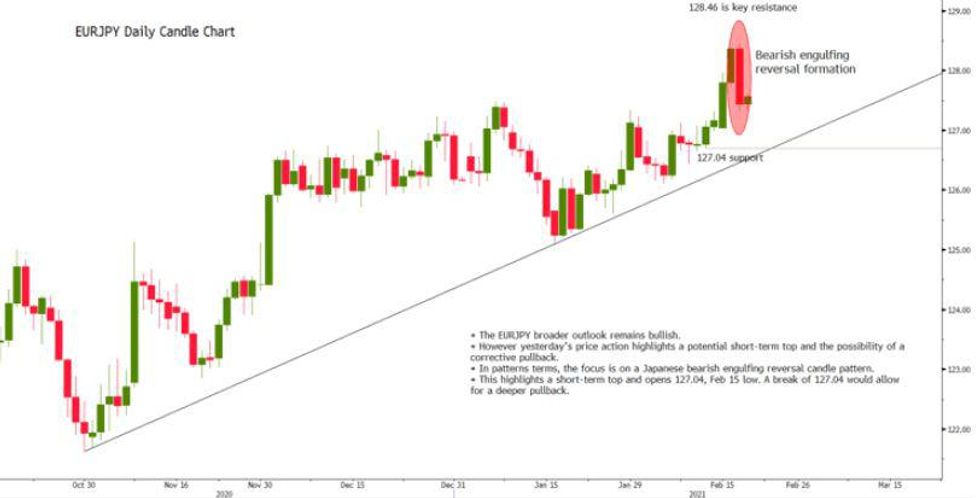
- The broader outlook remains bullish. However, yesterday's price action highlights a potential short-term top and the possibility of a corrective pullback. In patterns terms, the focus is on a Japanese bearish engulfing reversal candle pattern.
- This highlights a short-term top and opens 127.04, Feb 15 low. A break of 127.04 would allow for a deeper pullback.
- Key resistance has been defined at 128.46. A break higher would negate the bearish pattern and resume the underlying uptrend.
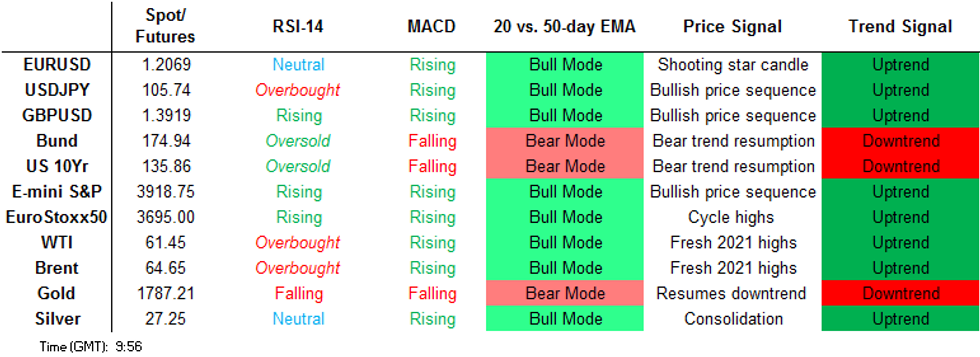
- Note too that Tuesday's shooting star bearish candle pattern in EURUSD, is significant too. If both patterns in EURJPY and EURUSD result in short-term weakness this would suggest USDJPY consolidates near-term. The trend in USDJPY remains bullish and a consolidation would represent a pause in the uptrend.
- Equity indices outlook is unchanged and bullish, E-mini S&P futures target the psychological 4000.00 handle.
- An initial objective is at 3988.40, 2.236 projection of the Sep 24 - Oct 12 - Oct 30 price swing last year.
- In the FX space, EURUSD has stabilised close to the weekly lows. Tuesday's candle pattern - a shooting star formation is a concern for bulls. Support to watch lies at 1.2020, the Feb 8 low. The key support to watch in the USD Index is 90.05, Jan 21 low. This level remains intact and is still a key pivot point. A break would negate the recent reversal pattern - an inverted head and shoulders. USDJPY key resistance at 106.26 next, 1.50 projection of Jan 6 / 11 / 21 price swing.
- On the commodity front, Gold has slipped through $1785.0, Feb 4 low. A clear break confirms a resumption of the downtrend that started Jan 6 and open $1764.8, Nov 30 low.
- In the FI space, Bunds (H1) have found support but the trend remains down and gains are considered corrective. Resistance is seen at 175.45, Dec 16 high. Gilts (H1) remain in a downtrend and gains are also considered corrective. Resistance is seen at 131.49, Feb 16 high. Initial resistance in Treasuries is seen at 136-01, Jan 12 low. The trend remains down.
FOREIGN EXCHANGE
EURUSD TECHS: Bearish Shooting Star Still In Play
- RES 4: 1.2223 High Jan 13
- RES 3: 1.2190 High Jan 22 and a key resistance
- RES 2: 1.2169 High Feb 16
- RES 1: 1.2110 High Feb 17
- PRICE: 1.2043 @ 06:11 GMT Feb 18
- SUP 1: 1.2023 Low Feb 17
- SUP 2: 1.2020 Low Feb 8
- SUP 3: 1.1952 Low Feb 5 and the bear trigger
- SUP 4: 1.1945 23.6% retracement March - Jan rally
EURUSD traded lower yesterday having failed to hold onto Tuesday's high. The price pattern on Feb 16 is a bearish candle - a shooting star. Following yesterday's extension lower, scope is seen for a deeper pullback with the next support at 1.2020, Feb 8 low. A break of this level would expose key support at 1.1952, Feb 5 low. Gains above yesterday's high of 1.2110 would refocus attention on key resistance at 1.2169, Tuesday's high.
GBPUSD TECHS: Corrective Pullback
- RES 4: 1.4082 1.00 proj of May - Sep 2020 rally from Sep 23 low
- RES 3: 1.4031 High Apr 23, 2018
- RES 2: 1.3998 High Apr 26, 2018
- RES 1: 1.3952 High Feb 16
- PRICE: 1.3845 @ 06:18 GMT Feb 18
- SUP 1: 1.3830 Low Feb 17
- SUP 2: 1.3776 Low Feb and Key near-term support
- SUP 3: 1.3737 Low Feb 9
- SUP 4: 1.3636 50-day EMA
GBPUSD remains below Tuesday's high of 1.3952. Dips are considered corrective with the pair maintaining a bullish tone following the recent resumption of the uptrend. Moving average studies are in a bull mode too and this reinforces current conditions. The focus is on 1.3998 next, Apr 26, 2018 high. On the downside, firm near-term support lies at 1.3776, Feb 12 low. A break would dent the current sentiment.
EURGBP TECHS: Bearish Conditions Remain Intact
- RES 4: 0.8886 50-day EMA
- RES 3: 0.8840 High Feb 4
- RES 2: 0.8797 High Feb 9
- RES 1: 0.8739 Low Feb 5
- PRICE: 0.8698 @ 06:27 GMT Feb 18
- SUP 1: 0.8680 Low Feb 17
- SUP 2: 0.8671 Low Apr 30 2020
- SUP 3: 0.8659 1.0% 10-dma envelope
- SUP 4: 0.8570 76.4% Feb-Mar 2020 Rally
EURGBP traded lower again Wednesday, hitting new cycle lows of 0.8680. This narrows the gap with the April 2020 lows and firms the current bearish condition. Moving average conditions are also in a bear mode set-up and this continues to highlight the current path of least resistance. The focus is on 0.8671, Apr 30, 2020 low. On the upside, firm resistance is at 0.8797, Feb 9 high. Initial resistance is at 0.8739, Feb 5 low.
USDJPY TECHS: Resumes Uptrend
- RES 4: 106.95 High Aug 28, 2020
- RES 3: 106.55 High Sep 3, 2020
- RES 2: 106.26 1.50 projection of Jan 6 / 11 / 21 price swing
- RES 1: 106.22 High Feb 17
- PRICE: 105.91 @ 06:33 GMT Feb 18
- SUP 1: 105.18 Low Feb 16
- SUP 2: 104.68 Trendline drawn off the Jan 6 low / Low Feb 10
- SUP 3: 104.41 Low Feb 10
- SUP 4: 104.07 Low Jan 28
USDJPY maintains a bullish tone and is trading closer to recent highs following Tuesday's rally. Tuesday's climb resulted in a break of resistance at 105.77, Feb 5 high. This confirms a resumption of the uptrend that started Jan 6 and reinforces the significance of the recent key technical break - the breach on Jan 27 of the bear channel resistance drawn off the Mar 2020 high. The focus is on 106.26 next, a Fibonacci projection.
EURJPY TECHS: Bearish Engulfing Candle
- RES 4: 129.47 1.00 proj of the Jun - Aug - Oct 2020 price swing
- RES 3: 129.26 High Dec 13, 2018
- RES 2: 128.59 High Dec 17, 2018
- RES 1: 128.46 High Feb 17 and bull trigger
- PRICE: 127.55 @ 06:45 GMT Feb 18
- SUP 1: 127.04 Low Dec 15
- SUP 2: 126.98 Low Feb 12
- SUP 3: 126.85 20-day EMA
- SUP 4: 126.10 Low Feb 4
The EURJPY broader outlook remains bullish however yesterday's price action highlights a potential short-term top and the possibility of a corrective pullback. In patterns terms, yesterday' Japanese candle pattern is a bearish engulfing reversal. If correct, this highlights a short-term top and opens 127.04, Feb 15 low. A break of this level would allow for a deeper pullback. On the upside, the bull trigger for a resumption of gains is at 128.46.
AUDUSD TECHS: Bullish Theme Remains In Place
- RES 4: 0.7917 High Mar 14, 2018 and a key resistance
- RES 3: 0.7885 High Mar 15. 2018
- RES 2: 0.7820 High Jan 6 and the bull trigger
- RES 1: 0.7805 High Feb 16
- PRICE: 0.7752 @ 06:48 GMT Feb 18
- SUP 1: 0.7712 20-day EMA
- SUP 2: 0.7651 Low Feb 8
- SUP 3: 0.7583/64 Low Feb 5 / Low Feb 2 and the bear trigger
- SUP 4: 0.7557 Low Dec 28
AUDUSD is unchanged and maintains a firm posture despite the recent pullback. Price action on Feb 5 highlighted a reversal signal following the inability to clear the 50-day EMA. The pair has breached resistance at 0.7704, Jan 29 high and this opens 0.7820, Jan 6 high and the bull trigger. On the downside, a break of 0.7564, Feb 2 low would resume recent bearish pressure. Initial support lies at 0.7712, the 20-day EMA.
USDCAD TECHS: Key Support Remains Exposed
- RES 4: 1.2915 High Dec 23
- RES 3: 1.2845/81 High Feb 4 / High Jan 28
- RES 2: 1.2763/82 High Jan 12 / 50-day EMA
- RES 1: 1.2746 High Feb 17
- PRICE: 1.2706 @ 06:52 GMT Feb 18
- SUP 1: 1.2610 Low Feb 16
- SUP 2: 1.2590 Low Jan 21 and major support
- SUP 3: 1.2547 Bear channel base drawn off the Jun 26, 2020 high
- SUP 4: 1.2528 Low Apr 17, 2018
USDCAD found support Tuesday at 1.2610. The recent move lower is seen as a deeper corrective move however price has recently cleared 1.2686, Jan 27 low and a key S/T level. This is a bearish development and exposes the Jan 21 trend low of 1.2590 that also marks a bear trigger. Clearance of this level would resume the underlying downtrend. A 1.2881 break, Jan 28 high, is required to reinstate bullish activity. 1.2763 is the initial firm resistance.
FIXED INCOME
BUND TECHS: (H1) Corrective Bounce
- RES 4: 17688 50-day EMA
- RES 3: 176.64 High Feb 11
- RES 2: 175.70 High Feb 15
- RES 1: 175.45 High Dec 16
- PRICE: 174.10 @ 05:06 GMT Feb 18
- SUP 1: 174.37 Low Dec 2, 2020 (cont)
- SUP 2: 174.06 2.00 proj of Jan 4 - 12 sell-off from Jan 27 high
- SUP 3: 173.58 2.236 proj of Jan 4 - 12 sell-off from Jan 27 high
- SUP 4: 173.06 Low Sep 10, 2020 (cont)
Bund futures found support yesterday. The bounce is likely a correction though with a bearish cycle dominating. Monday's sell-off resulted in price trading through 175.61, Feb 8 low. This confirmed a resumption of the downtrend that started mid-December. Momentum and MA studies remain in a bear mode, reinforcing current conditions. Attention is on 174.37 next, Dec 2, 2020 low (cont). Initial resistance is at Wednesday's high of 175.45.
BOBL TECHS: (H1) Bearish Cycle Intact
- RES 4: 135.150 High Feb 11 and key resistance
- RES 3: 135.010 20-day EMA
- RES 2: 134.850 High Feb 15
- RES 1: 134.789 Low Feb and intraday high
- PRICE: 134.750 @ 05:13 GMT Feb 18
- SUP 1: 134.530 Low Feb 17
- SUP 2: 134.479 76.4% retracement of the Jun - Nov 2020 rally
- SUP 3: 134.450 Low Aug 14, 2020 (cont)
- SUP 4: 134.417 1.236 proj of Dec 11-Jan 12 sell-off from Jan 27 high
BOBL futures maintain a bearish tone despite yesterday's corrective bounce. This week price has traded below the key support and bear trigger at 134.790, Feb 5 low. The break strengthens a bearish argument and confirms a resumption of the underlying downtrend. Attention is on 134.417 next, a Fibonacci projection. Initial resistance is seen at 134.790. The Feb 11 high of 135.150 marks the key trend resistance.
SCHATZ TECHS: (H1) Still Vulnerable
- RES 4: 112.335 High Jan 1
- RES 3: 112.300 50-day EMA
- RES 2: 112.290 High Feb 11 and key resistance
- RES 1: 112.250 High Feb 15
- PRICE: 112.240 @ 05:20 GMT Feb 18
- SUP 1: 112.205 Low Feb 17
- SUP 2: 112.201 0.764 proj of Dec 11 -28 sell-off from Jan 27 high
- SUP 3: 112.185 50.0% retracement of the Jun - Nov 2020 rally
- SUP 4: 112.150 1.00 proj of Dec 11 -28 sell-off from Jan 27 high
Schatz futures remain softer and gains are considered corrective. On Monday the contract cleared key support at 112.235, Dec 23 low and 112.240, Jan 2, 21 and 22 low. The break negated the recent triple bottom reversal and instead confirmed a resumption of the downtrend that started early November 2020. Attention is on further bearish pressure and 112.201 next, a Fibonacci projection. Trend resistance has been defined at 112.290, Feb 11 high.
GILT TECHS: (H1) Bounce Considered Corrective
- RES 4: 133.55 Low Dec 1 and a recent breakout level
- RES 3: 132.67 High Feb 11
- RES 2: 131.73 Low Feb 8 and today's breakout level
- RES 1: 131.49 HIgh Feb 16
- PRICE: 131.31 @ Close Feb 17
- SUP 1: 130.57 Low Feb 17
- SUP 2: 130.49 2.764 proj of the Dec 11 - 24 sell-off from Jan 4 high
- SUP 3: 130.18 Low Mar 19, 2020 (cont)
- SUP 4: 130.00 Psychological round number
Gilt futures found support yesterday retracing some of this week's bear leg. Gains are considered corrective though with a bearish cycle still dominating. The move this week to fresh lows reinforces the bearish theme and confirms a resumption of the underlying downtrend that started early August last year. With further downside likely near-term, the focus is on 130.49 next, a Fibonacci projection. Initial resistance is at 131.49, Feb 16 high.
BTP TECHS: (H1) Corrective Cycle Extends
- RES 4: 154.00 Round number resistance
- RES 3: 153.82 High Feb 12 and the bull trigger
- RES 2: 152.89 High Dec 15
- RES 1: 152.06 20-day EMA
- PRICE: 151.82 @ Close Feb 17
- SUP 1: 151.51/43 50-day EMA / Low Jan 4 and Feb 17
- SUP 2: 151.19 61.8% retracement of the Jan 22 - Feb 12 rally
- SUP 3: 150.70 Low Feb 2
- SUP 4: 150.57 76.4% retracement of the Jan 22 - Feb 12 rally
BTP futures remain bullish but have this week entered a corrective cycle. Last week saw the contract register successive all-time highs reinforcing bullish conditions. For now though a top has been defined at 153.82, Feb 12 high. Attention is on the 50-day EMA that was probed yesterday. The average intersects at 151.51, a clear break would signal scope for a deeper pullback. Initial resistance is seen at 152.09, the 20-day EMA.
EQUITIES
EUROSTOXX 50 Techs: Corrective Pullback
- RES 4: 3867.28 High Feb 20, 2020
- RES 3: 3858.79 1.50 proj of Dec 21 - Jan 8 rally from Jan 28 low
- RES 2: 3798.19 0.764 proj of Mar - Jul - Oct 2020 swing
- RES 1: 3742.53 High Feb 15
- PRICE: 3699.85 @ Close Feb 17
- SUP 1: 3681.82 High Feb 8
- SUP 2: 3645.57 20-day EMA
- SUP 3: 3628.47 Low Feb 10
- SUP 4: 3580.98 50-day EMA
EUROSTOXX 50 remains bullish despite the recent corrective pullback. The focus is on 3798.19 further out, a Fibonacci projection. Moving average studies remain in a bull mode reinforcing underlying conditions. On the downside, the index needs to clear support at 3473.76 to reinstate a bearish theme, the Jan 28 low. Initial support is at 3645.57,the 20-day EMA. The bull trigger is Monday's high of 3742.53.
COMMODITIES
BRENT TECHS: (J1) Resumes Its Uptrend
- RES 4: $67.00 - Round number resistance
- RES 3: $66.00 - High Jan 20, 2020 (cont)
- RES 2: $65.88 - 1.764 proj of the Apr - Aug - Nov 2020 price swing
- RES 1: $65.52 - Intraday high
- PRICE: $64.91 @ 06:57 GMT Feb 18
- SUP 1: $62.73 - Low Feb 17
- SUP 2: $60.35 - Low Dec 12
- SUP 3: $59.12 - 20-day EMA
- SUP 4: $57.31 - High Jan 13 and former breakout level
Brent futures have resumed their uptrend and extended gains plus traded above $65.00. The continued climb confirms a resumption of the underlying bull trend and maintains the bullish price sequence of higher highs and higher lows. Moving average studies are in a bull mode too, reinforcing current trend conditions. The focus is on $65.88 next, a Fibonacci projection. On the downside, initial firm support lies at $60.35, the Feb 12 low.
WTI TECHS: (H1) Extends Gains Above $60.00
- RES 4: $65.71 - 1.764 proj of Apr - Aug rally from the Nov 2 low
- RES 3: $64.00 - Round number resistance
- RES 2: $63.17 - 1.618 proj of Apr - Aug rally from the Nov 2 low
- RES 1: $62.26 - Intraday high
- PRICE: $61.68 @ 07:06 GMT Feb 18
- SUP 1: $59.33 - Low Feb 16
- SUP 2: $57.41 - Low Feb 12
- SUP 3: $56.30 - 20-day EMA
- SUP 4: $55.30 - Low Feb 4
WTI futures maintain a bullish tone. The contract is trading above $60.00 and further gains are likely near-term. The recent break higher confirms a resumption of the underlying uptrend and maintains the bullish price sequence of higher highs and higher lows. The focus is on $63.17 next, a Fibonacci projection. On the downside, the near-term firm support lies at $57.41, the Feb 12 low. Initial support is at $59.33, Feb 16 low.
GOLD TECHS: Approaching Key Support
- RES 4: $1875.7 - High Jan 29 and key near-term resistance
- RES 3: $1855.5 - High Feb 10
- RES 2: $1828.3 - 20-day EMA
- RES 1: $1795.1 - High Feb 17
- PRICE: $1782.3 @ 07:26 GMT Feb 18
- SUP 1: $1769.7 - Low Feb 17
- SUP 2: $1764.8 - Low Nov 30 and a key support
- SUP 3: $1757.8 - Low Jul 2, 2020
- SUP 4: $1747.6 - Low Jun 26, 2020
Gold traded below $1810.7 Tuesday, the Feb 12 low and remains heavy. Price traded lower again yesterday and in the process support at $1785.00, Feb 4 low was cleared. This reinforces the current bearish theme with last week's failure at $1855.5, Feb 10 high clearly weighing on the yellow metal. The break lower paves the way for a sell-off towards $1764.8, Nov 30 low. The 20-day EMA at $1828.3 offers initial firm resistance.
SILVER TECHS: Bearish Risk Remains Present
- RES 4: $30.100 - High Feb 1
- RES 3: $29.053 - High Feb 2
- RES 2: $28.498 - 61.8% retracement of the Feb 1 - 4 sell-off
- RES 1: $28.003 - 50.0% retracement of the Feb 1 - 4 sell-off
- PRICE: $27.212 @ 07:50 GMT Feb 18
- SUP 1: $26.835 - Low Feb 16
- SUP 2: $25.905 - Low Feb 4
- SUP 3: $25.483 - 76.4% retracement of the Jan 18 - Feb 1 rally
- SUP 4: $24.700 - Low Jan 27
Silver is consolidating but remains vulnerable following the sharp sell-off on Feb 2. Recent gains are considered a correction and a resumption of weakness is seen likely near-term. A move lower would refocus attention on $25.905, Feb 4 low and clearance of this support would set the scene for a deeper pullback. On the upside, resistance is seen at $28.003 and $28.498, Fibonacci retracement levels. Key resistance is at $30.100, Feb 1 high.
Why MNI
MNI is the leading provider
of intelligence and analysis on the Global Fixed Income, Foreign Exchange and Energy markets. We use an innovative combination of real-time analysis, deep fundamental research and journalism to provide unique and actionable insights for traders and investors. Our "All signal, no noise" approach drives an intelligence service that is succinct and timely, which is highly regarded by our time constrained client base.Our Head Office is in London with offices in Chicago, Washington and Beijing, as well as an on the ground presence in other major financial centres across the world.