
Why MNI
MNI is the leading provider
of intelligence and analysis on the Global Fixed Income, Foreign Exchange and Energy markets. We use an innovative combination of real-time analysis, deep fundamental research and journalism to provide unique and actionable insights for traders and investors. Our "All signal, no noise" approach drives an intelligence service that is succinct and timely, which is highly regarded by our time constrained client base.Our Head Office is in London with offices in Chicago, Washington and Beijing, as well as an on the ground presence in other major financial centres across the world.
FOREIGN EXCHANGE
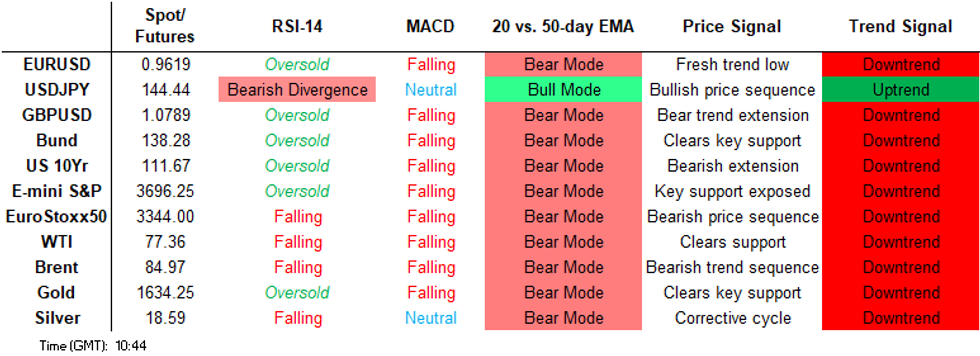
Price Signal Summary - Gilt Futures Trend Needle Still Points South
- In the equity space, S&P E-Minis trend conditions remain bearish following last week’s extension lower - the trend has accelerated following the break of the July support. This strengthens bearish conditions and attention is on key support at 3657.00, Jun 17 low and an important medium-term bear trigger. A break would confirm a resumption of the broader downtrend. EUROSTOXX 50 futures remain soft following the reversal on Sep 13, from 3678.00, the Jun 13 high and last week’s follow through. Key short-term support at 3423.00, the Sep 5 low has been cleared, the break strengthens bearish conditions and has led to a breach of 3341.00, the Jul 5 low. The focus is on 3300.00.
- In FX, the EURUSD is vulnerable. The break lower last week and Monday, confirms a resumption of the primary downtrend - reinforced too by last week’s breach of 0.9864, the Sep 6 low. The move lower maintains the bearish price sequence of lower lows and lower highs. Price is also trending down inside a bear channel drawn from the Feb 10 high. The channel base intersects at 0.9513. Bearish trend conditions in GBPUSD remain intact. An important short-term support has been defined at 1.0350, Monday’s low. The trend is down and a break of this support would confirm a resumption of bearish activity. Yesterday’s close also highlights an important candle pattern - a hammer and potential reversal signal. A break above Monday’s high is required to strengthen this signal and highlight a potential short-term base. The pullback on Sep 22 in USDJPY resulted in a print below the 20-day EMA, currently at 142.17. The trend structure remains bullish and recent weakness is considered corrective. A continuation higher would expose 145.90, the Sep 22 high and the next bull trigger. Key short-term support has been defined at 140.36, Sep 22 low. A break would highlight a short-term top in the trend.
- On the commodity front, Gold traded lower Friday, breaking out of its recent range and in the process confirmed the bear flag formation evident on the daily chart. The break confirms a resumption of the downtrend and opens $1610.5, the 1.00 projection of the Jun 13 - Jul 21 - Aug 10 swing. In the Oil space, a bearish threat in WTI futures remains present. The recent break of support at $84.25, the Jul 14 low, confirmed a resumption of the downtrend that started Jun 8 and marks the end of a broad sideways move that has been in place since mid-July. Yesterday’s move lower reinforces current conditions. Attention is on $76.11, 1.618 projection of the Jul 29 - Aug 16 - 30 price swing.
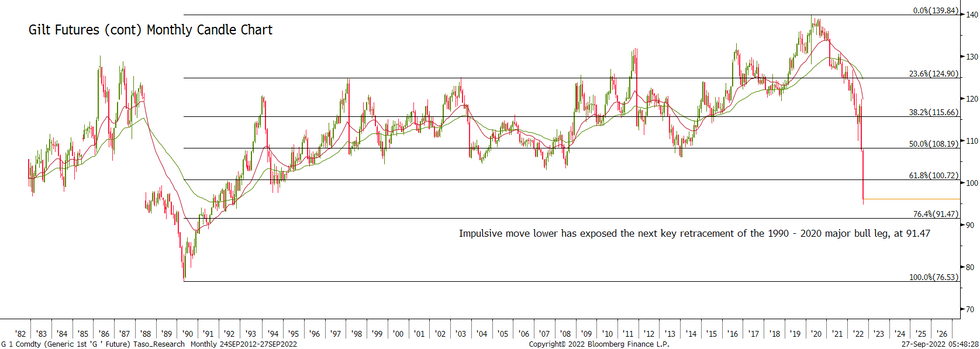
- In the FI space, Bund futures remain in a clear downtrend and the extension lower last week and yesterday, confirmed a resumption of the bear leg that started early August. The major support at 140.67, the Jun 16 low (cont), has been cleared. The focus is on 137.00. Gilts resumed bearish activity Monday and gapped lower. The extension maintains the bearish price sequence of lower lows and lower highs. The psychological 100.00 handle has been cleared, attention is on 94.72, the Sep 1992 low (cont). Further out, the focus is on the next key retracement of the 1990 - 2020 major bull leg, at 91.47
EURUSD TECHS: Sights Are On Bear Channel Support
- RES 4: 1.0051 Bear channel top drawn from the Feb 10 high
- RES 3: 0.9923 20-day EMA
- RES 2: 0.9852 High Sep 23
- RES 1: 0.9710 High Sep 26
- PRICE: 0.9638 @ 06:05 BST Sep 27
- SUP 1: 0.9554 Low Sep 26
- SUP 2: 0.9513 Bear channel base drawn from the Feb 10 high
- SUP 3: 0.9501 1.382 projection of the Aug 10 - Sep 6 - 12 price swing
- SUP 4: 0.9442 1.50 projection of the Aug 10 - Sep 6 - 12 price swing
EURUSD remains vulnerable and started this week on a bearish note. Fresh trend lows again confirm a resumption of the primary downtrend - reinforced too by last week’s breach of 0.9864, the Sep 6 low. The move lower maintains the bearish price sequence of lower lows and lower highs. Price is also trending lower inside a bear channel drawn from the Feb 10 high. The channel base intersects at 0.9513 and represents a key support.
GBPUSD TECHS: Hammer Candle Formation?
- RES 4: 1.1391 20-day EMA
- RES 3: 1.1274 High Sep 23
- RES 2: 1.1000 Round number resistance
- RES 1: 1.0931 High Sep 26
- PRICE: 10770 @ 06:11 BST Sep 27
- SUP 1: 1.0350 All Time Low
- SUP 2: 1.0203 3.236 proj of the Jun 16 - Jul 14 - Aug 1 price swing
- SUP 3: 1.0108 3.382 proj of the Jun 16 - Jul 14 - Aug 1 price swing
- SUP 4: 1.0032 3.50 proj of the Jun 16 - Jul 14 - Aug 1 price swing
Bearish trend conditions in GBPUSD remain intact. Monday’s volatile price activity highlights an important short-term support at 1.0350. The trend is down and a break of this support would confirm a resumption of bearish activity. Yesterday’s close also highlights an important candle pattern - a hammer and potential reversal signal. A break above Monday’s high is required though to strengthen this signal and highlight a potential S/T base.
EURGBP TECHS: Bull Trend Remains Intact
- RES 4: 0.9501 High Mar 19 2020 and major resistance
- RES 3: 0.9388 High Mar 23 2020
- RES 2: 0.9292 High Sep 11 2020
- RES 1: 0.9060/9266 50.0% of Monday’s range / High Sep 26
- PRICE: 0.8945 @ 06:34 BST Sep 27
- SUP 1: 0.8853 Low Sep 26
- SUP 2: 0.8788 High Sep 19
- SUP 3: 0.8692 Low Sep 22 and a key short-term support
- SUP 4: 0.8610 50-day EMA
EURGBP rallied sharply higher Monday before reversing lower and retracing the rally - the cross is currently trading closer to Monday’s low. The break higher reinforces bullish conditions and maintains the positive price sequence of higher highs and lows. This has exposed the top of a broad multi-year range at the 0.9300 handle and a key resistance area. Short-term weakness would be considered corrective - for now. 0.8692 is a key short-term support.
USDJPY TECHS: Sights Still Set On The 145.90 Bull Trigger
- RES 4: 146.52 1.236 proj of the May 24 - Jul 14 - Aug 2 price swing
- RES 3: 146.03 2.764 proj of the Aug 2 - 8 - 11 price swing
- RES 2: 145.90 High Sep 22
- RES 1: 144.79 High Sep 26
- PRICE: 144.48 @ 06:41 BST Sep 27
- SUP 1: 142.17 20-day EMA
- SUP 2: 140.36 Low Sep 22 and key short-term support
- SUP 3: 139.87 Low Sep 2
- SUP 4: 139.25 50-day EMA
The pullback on Sep 22 in USDJPY resulted in a print below the 20-day EMA, currently at 142.17. The trend structure remains bullish and recent weakness is considered corrective. A continuation higher would expose 145.90, the Sep 22 high and the next bull trigger. On the downside, key short-term support has been defined at 140.36, Sep 22 low. A break of this level would highlight a short-term top in the trend.
EURJPY TECHS: Corrective Cycle Still In Play
- RES 4: 146.23 2.236 proj of the Aug 2- 10 - 16 price swing
- RES 3: 145.64 High Sep 12 and the bull trigger
- RES 2: 144.04 High Sep 20
- RES 1: 140.27/141.08 High Sep 23 / 20-day EMA
- PRICE: 139.32 @ 06:45 BST Sep 27
- SUP 1: 137.40 Low Sep 26
- SUP 2: 136.02 Low Aug 25
- SUP 3: 135.52 Low Aug 24
- SUP 4: 134.95 Low Aug 16 and a key support
A sharp reversal lower in EURJPY last week resulted in a break below the 50-day EMA and the cross remains below this average. At this stage, recent weakness is considered corrective, despite a deep retracement - technical trend signals continue to highlight a bull cycle. Price action is likely to remain volatile though and the daily close below the 50-day EMA has strengthened a bearish threat. Initial firm resistance to watch is 141.08, the 20-day EMA.
AUDUSD TECHS: Gains Considered Corrective
- RES 4: 0.6823 50-day EMA
- RES 3: 0.6747 High Sep 20
- RES 2: 0.6656 High Sep 23
- RES 1: 0.6550 High Sep 26
- PRICE: 0.6499 @ 07:02 BST Sep 27
- SUP 1: 0.6438 Low Sep 26
- SUP 2: 0.6402 Low May 15 2020
- SUP 3: 0.6373 Low May 4 2020
- SUP 4: 0.6255 1.236 proj of the Apr 5 - May 12 - Jun 3 price swing
AUDUSD resumed its downtrend Monday. The outlook remains bearish and gains are considered corrective. Last week’s move lower resulted in a break of support at 0.6682, the Jul 14 low and bear trigger. The break strengthens bearish conditions and maintains the broader bearish price sequence of lower lows and lower highs. This has opened 0.6402 next, the May 15 2020 low. Initial firm resistance has been defined at 0.6747, the Sep 20 high.
USDCAD TECHS: Northbound
- RES 4: 1.3970 3.236 proj of the Aug 25 - Sep 7 - 13 price swing
- RES 3: 1.3896 3.00 proj of the Aug 25 - Sep 7 - 13 price swing
- RES 2: 1.3822 2.764 proj of the Aug 25 - Sep 7 - 13 price swing
- RES 1: 1.3808 High Sep 26
- PRICE: 1.3660 @ 08:06 BST Sep 27
- SUP 1: 1.3468/3358 Low Sep 23 / 21
- SUP 2: 1.3280 20-day EMA
- SUP 3: 1.3105 50-day EMA
- SUP 4: 1.2954 Low Sep 13 amd a key support
USDCAD maintains a clear bullish tone and the pair traded higher again Monday. The extension reinforces bullish conditions and maintains the positive price sequence of higher highs and higher lows. Moving average studies are in a bull mode position, highlighting current market sentiment. Sights are set on 1.3822 next, a Fibonacci projection. On the downside, initial firm support is at 1.3280, the 20-day EMA.
FIXED INCOME
BUND TECHS: (Z2) Trend Needle Still Points South
- RES 4: 143.20 20-day EMA
- RES 3: 142.58 High Sep 20
- RES 2: 142.02 High Sep 22
- RES 1: 140.99 High Sep 23
- PRICE: 137.98 @ 05:07 BST Sep 27
- SUP 1: 137.41 Low Sep 26
- SUP 2: 137.00 Round number support
- SUP 3: 136.46 4.00 proj of the Aug 2 - 12 - 15 price swing
- SUP 4: 135.41 4.236 proj of the Aug 2 - 12 - 15 price swing
Bund futures remain in a clear downtrend and the extension lower last week and yesterday, confirm a continuation of the bear leg that started early August. The major support at 140.67, the Jun 16 low (cont), has been cleared. The break strengthens the broader bearish outlook and confirms a resumption of the primary downtrend. With 140.00 pierced, attention turns to the 137.00 handle. The 20-day EMA, at 143.20 is a firm resistance.
BOBL TECHS: (Z2) Trend Outlook Remains Bearish
- RES 4: 122.010 High Sep 14
- RES 3: 121.517 20-day EMA
- RES 2: 120.940 High Sep 21
- RES 1: 120.150 High Sep 23
- PRICE: 118.750 @ 05:12 BST Sep 27
- SUP 1: 118.370 Low Sep 26
- SUP 2: 118.274 2.236 proj of the Aug 25 - Sep 1 - Sep 6 price swing
- SUP 3: 117.918 2.382 proj of the Aug 25 - Sep 1 - Sep 6 price swing
- SUP 4: 117.630 2.50 proj of the Aug 25 - Sep 1 - Sep 6 price swing
The trend needle in Bobl futures still points south and the contract traded lower once again Monday reinforcing bearish conditions. A key support at 119.940, the Jun 16 low (cont) and the bear trigger, has been cleared. The break of this level confirms a resumption of the broader downtrend and opens 118.274 next, a Fibonacci projection. Firm resistance is seen at 121.517, the 20-day EMA.
SCHATZ TECHS: (Z2) Bears Remain In The Driver’s Seat
- RES 4: 107.840 High Sep 14
- RES 3: 107.610 20-day EMA
- RES 2: 107.380 High Sep 20
- RES 1: 107.035 High Sep 22
- PRICE: 106.680 @ 05:20 BST Sep 27
- SUP 1: 106.513 2.236 proj of the Aug 25 - Sep 1 - Sep 6 price swing
- SUP 2: 106.379 2.382 proj of the Aug 25 - Sep 1 - Sep 6 price swing
- SUP 3: 106.000 Round number support
- SUP 4: 105.800 Low Nov 2008 (cont)
The Schatz futures trend direction remains down and the contract traded to a fresh trend low once again on Monday, confirming an extension of the bear cycle. This also maintains the current bearish price sequence of lower lows and lower highs with moving average studies in a bear mode position. The focus is on 106.513 next, a Fibonacci projection. On the upside, initial firm resistance is seen at 107.610, the 20-day EMA.
GILT TECHS: (Z2) Path Of Least Resistance Remains Down
- RES 4: 104.69 20-day EMA
- RES 3: 102.45 High Sep 23
- RES 2: 98.68 Low Sep 23 and gap high on the daily chart
- RES 1: 97.38 High Sep 26
- PRICE: 96.16 @ Close Sep 26
- SUP 1: 94.72 Low Sep 1992 (cont)
- SUP 2: 93.06 Low Apr 1992 (cont)
- SUP 3: 92.00 Round number support
- SUP 4: 91.47 76.4% retracement of the 1990 - 2020 major bull cycle
Gilt futures started the week on a bearish note as the downtrend continues to accelerate. The break lower maintains the bearish price sequence of lower lows and lower highs. Note too that recent corrections have proved to be short-lived and shallow - clearly highlighting current bearish sentiment. Attention is on 94.72, the September 1992 low. Further out, the focus is on the next key retracement of the 1990 - 2020 major bull leg, at 91.47.
BTP TECHS: (Z2) Remains Vulnerable
- RES 4: 119.06 High Sep 8 and a reversal trigger
- RES 3: 117.63 High Sep 14
- RES 2: 116.69 20-day EMA
- RES 1: 113.46/114.67 High Sep 26 / Low Sep 20
- PRICE: 112.35 @ Close Sep 26
- SUP 1: 110.14 Low Sep 26
- SUP 2: 110.00 Round number support
- SUP 3: 109.16 2.00 proj of the Aug 25 - Sep 1 - 8 price swing
- SUP 4: 107.99 2.236 proj of the Aug 25 - Sep 1 - 8 price swing
BTP futures remain bearish and the contract started the week on a softer note as it extends the current bearish cycle. Last week’s extension lower confirmed a resumption of the bear cycle - the contract traded through the early September lows. Moving averages are in a bear mode too, highlighting the current sentiment. The focus is on 110.00 next. On the upside, initial firm resistance is seen at 116.69, the 20-day EMA.
US 10YR FUTURE TECHS: (Z2) Bearish Outlook
- RES 4: 116-18+ 50 day EMA values
- RES 3: 115-06+ High Sep 14
- RES 2: 114-26 20-day EMA
- RES 1: 112-30+/114-00 High Sep 23 / 22
- PRICE: 112-06+ @ 15:19 BST Sep 26
- SUP 1: 111-00+ Low Sep 26
- SUP 2: 110-26+ 3.0% 10-dma envelope
- SUP 3: 110-00 Psychological Support
- SUP 4: 109-23+ Low Nov 30 20074 (cont)
Treasuries remain soft following last week’s extension of its downtrend. A bearish price sequence of lower lows and lower highs, bearish moving average studies and a lack of any meaningful correction, clearly highlights the markets current bearish sentiment. Prices have shown below the 112-00 handle, thereby opening 110-26+, a lower moving average band value. Initial resistance is Friday’s high of 112-30+.
EQUITIES
EUROSTOXX50 TECHS: (Z2) Trend Needle Still Points South
- RES 4: 3810.00 High Aug 17 and key resistance zone
- RES 3: 3753.00 High Aug 19
- RES 2: 3692.00 High Aug 26
- RES 1: 3497.50/3678.00 20-day EMA / High Sep 13 and bull trigger
- PRICE: 3355.00 @ 05:41 BST Sep 26
- SUP 1: 3314.00 Low Sep 26
- SUP 2: 3300.00 Round number support
- SUP 3: 3329.00 Low Nov 9 2020 (cont)
- SUP 4: 3163.00 Low Nov 6 2020
EUROSTOXX 50 futures remain soft following the reversal on Sep 13, from 3678.00, the Jun 13 high and last week’s follow through. Key short-term support at 3423.00, the Sep 5 low has been cleared, the break strengthens bearish conditions and has led to a breach of 3341.00, the Jul 5 low, opening 3300.00 next. MA studies are in a bear mode position too, highlighting the current trend direction. Initial firm resistance is at 3497.50, the 20-day EMA.
E-MINI S&P (Z2): Key Support Remains Exposed
- RES 4: 4313.50 High Aug 18
- RES 3: 4234.25 High Aug 26
- RES 2: 3996.40/4175.00 50-day EMA / High Sep 13
- RES 1: 3783.25/3936.25 High Sep 23 / 20
- PRICE: 3699.75 @ 05:59 BST Sep 27
- SUP 1: 3657.00 Low Jun 17 and a key M/T bear trigger
- SUP 2: 3600.00 Round number support
- SUP 3: 3558.97 1.382 proj of the Aug 16 - Sep 7 - 13 price swing
- SUP 4: 3506.38 1.50proj of the Aug 16 - Sep 7 - 13 price swing
S&P E-Minis trend conditions remain bearish following last week’s extension lower and break of the July support. The move lower strengthens bearish conditions and attention is on key support at 3657.00, Jun 17 low and an important medium-term bear trigger. A break would confirm a resumption of the broader downtrend. On the upside, initial firm resistance has been defined at 3936.25, the Sep 20 high.
COMMODITIES
BRENT TECHS: (X2) Bearish Extension
- RES 4: $107.30 - High Jul 5
- RES 3: $96.99/103.86 - High Sep 5 / High Jul 29 and key resistance
- RES 2: $94.56 - 50-day EMA
- RES 1: $91.36 - 20-day EMA
- PRICE: $85.09 @ 07:04 BST Sep 27
- SUP 1: $83.65 - Low Sep 26
- SUP 2: $82.59 - 1.618 proj of the Jul 29 - Aug 17 - 30 price swing
- SUP 3: $80.71 - 1.764 proj of the Jul 29 - Aug 17 - 30 price swing
- SUP 4: $79.12 - Low Jan 24
Brent futures traded lower Monday, confirming a resumption of the broader downtrend once again. Price has breached support at $87.24, Sep 18 low and bear trigger. The move lower strengthens bearish conditions and maintains the price sequence of lower lows and lower highs. This paves the way for $82.59 next, a Fibonacci projection. Firm trend resistance is at the 50-day EMA, at $94.56.
WTI TECHS: (X2) Bear Cycle Still In Play
- RES 4: $97.91 - High Jul 29 and a reversal trigger
- RES 3: $92.26/96.82 - High Aug 30 / 31 and key resistance
- RES 2: $88.46 - 50-day EMA
- RES 1: $84.77 - 20-day EMA
- PRICE: $77.49 @ 07:14 BST Sep 27
- SUP 1: $76.11 - 1.618 proj of the Jul 29 - Aug 16 - 30 price swing
- SUP 2: $75.70 - Low Jan 24
- SUP 3: $71.22 - 2.00 proj of the Jul 29 - Aug 16 - 30 price swing
- SUP 4: $68.20 - 2.236 proj of the Jul 29 - Aug 16 - 30 price swing
Bearish conditions in WTI futures were reinforced last week - the contract cleared support at $80.89, the Sep 8 low. This marks a resumption of the downtrend and maintains the bearish price sequence of lower lows and lower highs. The focus is on $76.11 next, a Fibonacci projection. On the upside, key short-term resistance is unchanged at $88.46 the 50-day EMA. Initial resistance is seen at $84.77, the 20-day EMA.
GOLD TECHS: Southbound
- RES 4: $1765.5 - High Aug 25 and a key resistance
- RES 3: $1725.0/35.1 - 50-day EMA / High Sep 12
- RES 2: $1688.0/1707.1 - High Sep 21 / High Sep 14
- RES 1: $1654.0 - Low Sep 21 and a recent breakout level
- PRICE: $1636.3 @ 07:21 BST Sep 27
- SUP 1: $1621.2 - Low Sep 26
- SUP 2: $1610.5 - 1.00 proj of the Jun 13 - Jul 21 - Aug 10 swing
- SUP 3: $1569.1 - Low Apr 1 2020
- SUP 4: $1563.9 - 1.236 proj of the Jun 13 - Jul 21 - Aug 10 swing
Gold traded lower Friday, breaking out of its recent range and in the process confirmed the bear flag formation evident on the daily chart. The break confirms a resumption of the downtrend and maintains the bearish price sequence of lower lows and lower highs. Moving average studies are in a bear mode position, clearly highlighting current market sentiment. The focus is on $1610.5, a Fibonacci projection. Initial firm resistance is at $1688.0.
SILVER TECHS: Bearish Threat Still Present
- RES 4: $21.967 - High Jun 17
- RES 3: $21.540 - High Jun 27
- RES 2: $20.876 - High Aug 15 and the bull trigger
- RES 1: $20.014 - High Sep 12
- PRICE: $18.709 @ 08:10 BST Sep 27
- SUP 1: $18.329/17.562 - Low Sep 26 / Low Sep 1 and bear trigger
- SUP 2: $16.955 - Low Jun 15 2020
- SUP 3: $16.473 - 1.00 proj of the Jun 6 - Jul 14 - Aug 10 price swing
- SUP 4: $15.998 - 76.4% retracement of the 2020 - 2021 bull leg
Silver maintains a softer tone. The recent break of $18.845, Sep 12 low, signals the end of the recent corrective recovery between Sep 1 - 12. A continuation lower would pave the way for a move towards the key support and bear trigger at $17.562, the Sep 1 low. Clearance of this level would confirm a resumption of the broader downtrend. On the upside, a break of $20.014, Sep 12 high, is required to reinstate a bullish theme.
Why MNI
MNI is the leading provider
of intelligence and analysis on the Global Fixed Income, Foreign Exchange and Energy markets. We use an innovative combination of real-time analysis, deep fundamental research and journalism to provide unique and actionable insights for traders and investors. Our "All signal, no noise" approach drives an intelligence service that is succinct and timely, which is highly regarded by our time constrained client base.Our Head Office is in London with offices in Chicago, Washington and Beijing, as well as an on the ground presence in other major financial centres across the world.