
Why MNI
MNI is the leading provider
of intelligence and analysis on the Global Fixed Income, Foreign Exchange and Energy markets. We use an innovative combination of real-time analysis, deep fundamental research and journalism to provide unique and actionable insights for traders and investors. Our "All signal, no noise" approach drives an intelligence service that is succinct and timely, which is highly regarded by our time constrained client base.Our Head Office is in London with offices in Chicago, Washington and Beijing, as well as an on the ground presence in other major financial centres across the world.
Price Signal Summary - Gilts Head South
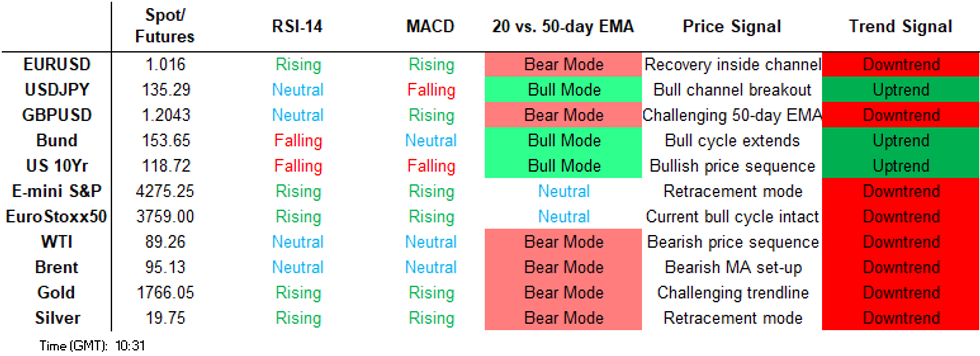
- In the equity space, the trend condition in S&P E-Minis remains up and short-term pullbacks are considered corrective. The focus is on 4345.75 next, 2.00 projection of the Jun 17 - 28 - Jul 14 price swing and potentially 4400.00 further out. On the downside, initial firm support is at 4144.39, the 20-day EMA. The short-term uptrend in EUROSTOXX 50 futures remains intact and yesterday’s pullback is considered corrective. Attention is on resistance at 3840.00, the Jun 6 high. A break of this hurdle would strengthen bullish conditions. On the downside, initial firm support is seen at the 20-day EMA which intersects at 3701.10.
- In FX, EURUSD remains below last week’s 1.0368 high (Aug 10). The recent move down appears to be a short-term reversal and means that the pair has failed to clear channel resistance. The bear channel is drawn from the Feb 10 high and intersects at 1.0299. Attention is on support at 1.0123, Aug 3 low. A break would strengthen the bearish theme. Key resistance is at 1.0368. Aug 10 high. Recent price action GBPUSD highlights two important short-term directional triggers; resistance at 1.2293, the Aug 1 high and support at 1.2004, the Aug 5 low. The short-term trend outlook is bullish but a break of 1.2293 is required to reinforce this theme. A clear break below 1.2004 would be bearish - this level has been tested today. USDJPY traded higher Wednesday, extending the bounce off Monday’s 132.56 low. Firm short-term resistance is unchanged at 135.58, Aug 8 high. The Aug 10 sell-off continues to highlight a potential reversal of the recent Aug 2 - 8 correction. A resumption of weakness would open 130.41, the Aug 2 low. A breach of 135.58 would instead expose 135.96, 61.8% retracement of the Jul 14 - Aug 2 downleg.
- On the commodity front, Gold traded lower yesterday, extending the pullback from last week’s high of $1807.9 (Aug 10). Recent gains saw price trade above trendline resistance drawn from the Mar 8 high. The break potentially represents an important technical breach. On the downside, a stronger pullback however would threaten the bullish theme. Watch support at $1754.4 Aug 3 low. The bull trigger is $1807.9. In the Oil space, WTI futures remain vulnerable. This week’s move down has resulted in a print below support at $87.01, the Aug 5 low. The weakness reinforces bearish conditions and a clear break of $87.01 would confirm a resumption of the downtrend. Attention is on $85.37, the Mar 15 low. Key short-term resistance has been defined at $95.05, the Aug 11 high.
- In the FI space, Bund futures traded lower Wednesday, extending the pullback from the Aug 2 high of 159.70. Attention is on the 50-day EMA which intersects at 153.85. This has been pierced and a clear break would signal scope for a deeper pullback. This would open 152.43 next,38.2% retracement of the Jun 16 - Aug 2 rally. Gilts remain vulnerable and yesterday’s sharp sell-off reinforces the current bearish climate. Attention is on 113.69, 61.8% of the Jun 16 - Aug 2 upleg. A clear break would signal scope for a continuation lower and open 113.03, the Jun 30 low.
FOREIGN EXCHANGE
EURUSD TECHS: Bearish Threat Remains Present
- RES 4: 1.0488 High Jun 30
- RES 3: 1.0449 High Jul 5
- RES 2: 1.0299/68 Channel top from Feb 10 high / High Aug 10
- RES 1: 1.0217 20-day EMA
- PRICE: 1.0167 @ 06:02 BST Aug 18
- SUP 1: 1.0123 Low Aug 3 & 16
- SUP 2: 1.0097 Low Jul 27 and key short-term support
- SUP 3: 1.0007/0.9952 Low Jul 15 / 14 and the bear trigger
- SUP 4: 0.9944 1.618 projection of the Jun 9 - 15 - 27 price swing
EURUSD is consolidating and remains below last week’s 1.0368 high (Aug 10). The recent move down appears to be a short-term reversal and means that the pair has failed to clear channel resistance. The bear channel is drawn from the Feb 10 high and intersects at 1.0299. Attention is on support at 1.0123, Aug 3 low - a level traded on Tuesday. A break would strengthen the bearish theme. Key resistance is at 1.0368.
GBPUSD TECHS: Watching Support
- RES 4: 1.2518 High Jun 6
- RES 3: 1.2406 High Jun 16 and a key resistance
- RES 2: 1.2332 High Jun 27
- RES 1: 1.2175/2293 20-day EMA / High Aug 01
- PRICE: 1.2049 @ 10:15 BST Aug 18
- SUP 1: 1.2004/1995 Low Aug 5 / Intraday low
- SUP 2: 1.1961 Low Jul 25
- SUP 3: 1.1890/1760 Low Jul 21 / Low Jul 14 and the bear trigger
- SUP 4: 1.1673 1.00 proj of the May 27 - Jun 14 - 16 price swing
Recent price action in GBPUSD highlights two important short-term directional triggers; resistance at 1.2293, the Aug 1 high and support at 1.2004, the Aug 5 low. The short-term trend outlook is bullish but a break of 1.2293 is required to reinforce this and signal a resumption of the bull cycle. A break would open 1.2406, the Jun 16 high. On the downside, clearance of support at 1.2004 would instead expose 1.1890, the Jul 21 low.
EURGBP TECHS: Remains Below The Aug 12 High
- RES 4: 0.8627 High Jul 4
- RES 3: 0.8585 High Jul 21 and a key resistance
- RES 2: 0.8525 High Jul 25
- RES 1: 0.8493 High Aug 12
- PRICE: 0.8446 @ 06:20 BST Aug 18
- SUP 1: 0.8388/40 Low Aug 17 / 2 and the bear trigger
- SUP 2: 0.8313 Low Apr 22
- SUP 3: 0.8270 2.0% 10-dma envelope and low Apr 14
- SUP 4: 0.8250 Low Apr 14
EURGBP traded higher Wednesday but has remained below 0.8493, the Aug 12 high. The broader outlook is bearish. Price action since mid-June has established a sequence of lower lows and lower highs and moving average studies are in a bear mode set-up too, reinforcing a bearish theme. A continuation lower would open 0.8313, Apr 22 low. The bear trigger is 0.8340, Aug 2 low. Last Friday’s high of 0.8493 is the first key short-term resistance.
USDJPY TECHS: Approaching Resistance
- RES 4: 137.27 76.4% retracement of the Jul 14 - Aug 2 downleg
- RES 3: 136.58 High Jul 28
- RES 2: 135.96 61.8% retracement of the Jul 14 - Aug 2 downleg
- RES 1: 135.58 High Aug 8
- PRICE: 135.09 @ 06:25 BST Aug 18
- SUP 1: 134.04 50-day EMA
- SUP 2: 132.56/31.74 Low Aug 15 / Low Aug 11
- SUP 3: 130.41/130.00 Low Aug 2 / Round number support
- SUP 4: 129.51 Low Jun 2
USDJPY traded higher again Wednesday, extending the bounce off Monday’s 132.56 low. Firm short-term resistance is unchanged at 135.58, Aug 8 high. The Aug 10 sell-off continues to highlight a potential reversal of the recent Aug 2 - 8 correction. Note, a broader bearish theme remains in place following the Jul 28 bull channel breakout. The channel is drawn from the Mar 4 low. A resumption of weakness would open 130.41, the Aug 2 low.
EURJPY TECHS: Firm Resistance Is Seen At The 50-Day EMA
- RES 4: 140.01 Trendline resistance drawn from the Jun 28 high
- RES 3: 139.41 High Jul 28
- RES 2: 138.13/40 50-day EMA / High Aug 10
- RES 1: 137.88 High Aug 17
- PRICE: 137.43 @ 06:42 BST Aug 18
- SUP 1: 136.27/134.95 Low Aug 17 / 16
- SUP 2: 133.40 Low Aug 2 and a bear trigger
- SUP 3: 132.66 Low May 12 and a key support
- SUP 4: 131.99 61.8% retracement of the Mar 7 - Jun 28 bull leg
EURJPY traded higher again Wednesday. Despite the climb this week, the short-term outlook remains bearish. Moving average studies highlight a downtrend and the 50-day EMA, at 138.13, marks a firm resistance. A resumption of weakness would open the 133.40 bear trigger. Clearance of resistance at the 50-day EMA would alter the picture and instead signal scope for a climb towards the 140.01 trendline resistance.
AUDUSD TECHS: Retracement Lower Extends
- RES 4: 0.7246 High Jun 7
- RES 3: 0.7166 3.0% Upper Bollinger Band
- RES 2: 0.7137 High Aug 11
- RES 1: 0.6978/7040 50-day EMA / igh Aug 16
- PRICE: 0.6940 @ 10:17 BST Aug 18
- SUP 1: 0.6870 Low Aug 5 and key support
- SUP 2: 0.6789 76.4% retracement of the Jul 14 - Aug 11 upleg
- SUP 3: 0.6719 Low Jul 15
- SUP 4: 0.6682 14 and the bear trigger
AUDUSD traded lower Wednesday, extending the retracement from last week’s high of 0.7137 (Aug 11). A continuation lower would expose support at 0.6870, the Aug 5 low. Clearance of this level would undermine the recent bull theme and also signal scope for a deeper pullback. Initial firm resistance has been defined at 0.7040, the Aug 16 high where a break is required to ease the current bearish pressure.
USDCAD TECHS: Maintains This Week’s Bullish Theme
- RES 4: 1.3224 High Jul 14 and key resistance
- RES 3: 1.3135 High Jul 15
- RES 2: 1.2995/3038 3.0% Upper Bollinger Band / High Jul 18
- RES 1: 1.2985 High Aug 5 and key near-term resistance
- PRICE: 1.2938 @ 08:05 BST Aug 18
- SUP 1: 1.2828/2752 Low Aug 17 / 200-dma
- SUP 2: 1.2728 Low Aug 11 and key support
- SUP 3: 1.2685 76.4% retracement of the Jun 8 - Jul 14 upleg
- SUP 4: 1.2596 2.0% 10-dma envelope
USDCAD maintains this week’s bullish theme and the pair is trading higher. A continuation to the upside would expose resistance at 1.2985, the Aug 5 high and the next key short-term resistance. Clearance of this level would strengthen bullish conditions. On the downside, key support has been defined at 1.2728, the Aug 11 low where a break would reinstate a bearish threat and also highlight a breach of the 200-dma.
FIXED INCOME
BUND TECHS: (U2) Bearish Retracement Extends
- RES 4: 159.79 High Apr 4 (cont)
- RES 3: 158.33/159.70 High Aug 3 / 2 and the bull trigger
- RES 2: 157.74 High Aug 10
- RES 1: 155.96/156.88 High Aug 17 / 15
- PRICE: 153.78 @ 09:47 BST Aug 18
- SUP 1: 153.24 Intraday low
- SUP 2: 152.43 38.2% retracement of the Jun 16 - Aug 2 rally
- SUP 3: 149.69 Low Jul 21 and key short-term support
- SUP 4: 148.24 Low Jul 1
Bund futures traded lower Wednesday, extending the pullback from the Aug 2 high of 159.70. Attention is on the 50-day EMA which intersects at 153.85. This is a key support area and has today been pierced. A clear break would strengthen bearish conditions and signal scope for a deeper pullback. This would open 152.43 next, a Fibonacci retracement. On the upside, initial firm resistance is at 156.88, Aug 15 high.
BOBL TECHS: (U2) Clears Trendline Support
- RES 4: 129.001 1.764 projection of the Jun 16 -24 - 28 price swing
- RES 3: 128.060/128.760 High Aug 3 / 2 and the bull trigger
- RES 2: 127.580 High Aug 10
- RES 1: 126.930/127.290 High Aug 17 / 15
- PRICE: 125.690 @ 09:53 BST Aug 18
- SUP 1: 125.440 Intraday low
- SUP 2: 125.391 38.2% retracement of the Jun 16 - Aug 2 rally
- SUP 3: 124.350 50.0% retracement of the Jun 16 - Aug 2 rally
- SUP 4: 124.030 Low Jul 21 and a reversal trigger
Bobl futures faced more selling pressure Wednesday and traded lower, piercing the 50-day EMA in the process. The average intersects at 126.093 and a deeper pullback would open 125.391 next, a Fibonacci retracement. The 50.0% level is at 124.350. Note that the contract has also breached a trendline support drawn from the Jun 16 low. Initial firm resistance has been defined at 127.290, the Aug 15 high.
SCHATZ TECHS: (U2) Trades Through The 50-Day EMA
- RES 4: 110.412 1.50 proj of the May 16 - 24 - 28 price swing
- RES 3: 110.100/380 High Aug 3 / Aug 2 and the bull trigger
- RES 2: 109.940 High Aug 10
- RES 1: 109.830/915 High Aug 17 / 16
- PRICE: 109.535 @ 05:35 BST Aug 18
- SUP 1: 109.350 Low Jul 22
- SUP 2: 109.042 50.0% retracement of the Jun 16 - Aug 2 upleg
- SUP 3: 108.950 Low Jul 21 and a key support
- SUP 4: 108.727 61.8% retracement of the Jun 16 - Aug 2 upleg
Schatz futures continue to trade below the early August highs and price moved lower on Wednesday. This has resulted in a break of the 50-day EMA and signals scope for an extension lower. The focus is on support at 109.350, the Jul 22 low. On the upside, initial firm resistance has been defined at 109.915, the Aug 16 high. A break of this level is required to ease the current bearish pressure.
GILT TECHS: (U2) Pullback Extends
- RES 4: 118.88 High Aug 4
- RES 3: 118.10 High Aug 10
- RES 2: 117.15 High Aug 15 and key short-term resistance
- RES 1: 115.91 High Aug 17
- PRICE: 114.33 @ Close Aug 17
- SUP 1: 113.63 Intraday low
- SUP 2: 113.03 Low Jun 30
- SUP 3: 112.24 76.4% retracement of the Jun 16 - Aug 2 upleg
- SUP 4: 111.72 Low Jun 29
Gilt futures remain vulnerable and yesterday’s sharp sell-off reinforces the current bearish climate. Recent weakness has resulted in a break of trendline support drawn from the Jun 16 low. Attention is on 113.69, a Fibonacci retracement. A clear break would signal scope for a continuation lower and open 113.03, Jun 30 low. On the upside, initial resistance is at yesterday’s 115.91 high. A firmer level has been defined at 117.15, the Aug 15 high.
BTP TECHS: (U2) Approaching Trendline Support
- RES 4: 131.24 High May 12 (cont)
- RES 3: 130.00 Round number resistance
- RES 2: 129.36 High Aug 11 and the bull trigger
- RES 1: 127.15 High Aug 17
- PRICE: 125.06 @ Close Aug 17
- SUP 1: 123.86 Trendline support drawn from the Jun 14 low
- SUP 2: 123.31 61.8% retracement of the Jul 21 - Aug 11 upleg
- SUP 3: 121.88 76.4% retracement of the Jul 21 - Aug 11 upleg
- SUP 4: 119.57 Low Jul 21
BTP futures bearish conditions have strengthened following yesterday’s move lower. The sell-off has resulted in a break below both the 20- and 50-day EMAs and sets the scene for an extension lower near-term. The focus is on 123.86, trendline support drawn from the Jun 14 low. A break would open 121.88, a Fibonacci retracement. Initial resistance is seen at yesterday’s high of 127.15.
EQUITIES
EUROSTOXX50 TECHS: (U2) Corrective Pullback
- RES 4: 3902.00 High Mar 29 and a key resistance
- RES 3: 3877.30 50.0% of the Nov 18 ‘21 - Jul 5 bear leg (cont)
- RES 2: 3855.00 High Apr 21
- RES 1: 3840.00 High Jun 6 and key resistance
- PRICE: 3762.00 @ 05:42 BST Aug 18
- SUP 1: 3701.10 20-day EMA
- SUP 2: 3642.70/3553.00 50-day EMA / Low Jul 26
- SUP 3: 3467.00 Low Jul 18 / 19
- SUP 4: 3343.00 Low Jul 5 and the bear trigger
EUROSTOXX 50 futures remain in an uptrend and yesterday’s pullback is considered corrective. Recent gains have maintained the bullish price sequence of higher highs and higher lows and moving average studies are in a bull mode condition. Attention is on resistance at 3840.00, the Jun 6 high. A break of this hurdle would strengthen bullish conditions. On the downside, key support is seen at the 50-day EMA which intersects at 3642.70.
E-MINI S&P (U2): Trend Outlook Remains Bullish
- RES 4: 4419.15 2.236 proj of the Jun 17 - 28 - Jul 14 price swing
- RES 3: 4400.00 Round number resistance
- RES 2: 4345.75 2.00 proj of the Jun 17 - 28 - Jul 14 price swing
- RES 1: 4327.50 High Aug 16
- PRICE: 4267.25 @ 06:59 BST Aug 18
- SUP 1: 4208.25/4144.39 20-day EMA
- SUP 2: 4063.32/3913.25 50-day EMA / Low Jul 26 and a key support
- SUP 3: 3820.25 Low Jul 18
- SUP 4: 3723.75 Low Jul 14
The S&P E-Minis outlook remains bullish. Recent gains confirmed an extension of the positive price sequence of higher highs and higher lows. Moving average conditions are in a bull mode set-up too and the focus is on 4345.75 next, a Fibonacci projection and potentially 4400.00 further out. On the downside, initial firm support is at 4144.39, the 20-day EMA. The 50-day EMA intersects at 4063.32 - a key support.
COMMODITIES
BRENT TECHS: (V2) Bear Trigger Remains Exposed
- RES 4: $110.72 - High Jul 5
- RES 3: $106.50 - High Jul 29 and a key resistance
- RES 2: $100.38/67 - High Aug 12 / 50-day EMA
- RES 1: $97.66 20-day EMA
- PRICE: $93.71 @ 07:04 BST Aug 18
- SUP 1: $91.22 - Low Jul 14 and the bear trigger
- SUP 2: $90.00 - Round number support
- SUP 3: $88.31 - Low Mar 9 and a key support
- SUP 4: $85.88 - Low Feb 25
Brent futures started the week on a softer note and the contract remains vulnerable. The move lower this week has defined a key short-term resistance at $100.38, Aug 12 high, ahead of the 50-day EMA which intersects at $100.67. Attention is on support at $91.22, Jul 14 low. A break would confirm a resumption of the broader downtrend and strengthen bearish conditions. Clearance of $100.38/96 is required to highlight a reversal.
WTI TECHS: (U2) Remains Vulnerable
- RES 4: $108.28 - High Jul 5
- RES 3: $101.88 - High Jul 29 and key resistance
- RES 2: $95.05/96.64 - High Aug 11 / 50-day EMA values
- RES 1: $92.57 20-day EMA
- PRICE: $88.08 @ 07:08 BST Aug 18
- SUP 1: $85.73 - Low Aug 16
- SUP 2: $85.37/00 - Low Mar 15 / Round number support
- SUP 3: $83.51 - 1.50 projection of the Jun 8 - 22 - 29 price swing
- SUP 4: $81.34 - 1.618 projection of the Jun 8 - 22 - 29 price swing
WTI futures remain vulnerable. This week’s move down has resulted in a print below support at $87.01, the Aug 5 low. The weakness reinforces bearish conditions and a clear break of $87.01 would confirm a resumption of the downtrend. Attention is on $85.37, the Mar 15 low and the $85.00 handle. On the upside, key short-term resistance has been defined at $95.05, the Aug 11 high.
GOLD TECHS: Pullback Extends
- RES 4: $1875 7 - 50.0% retracement of the Mar 8 - Jul 21 bear leg
- RES 3: $1857.6 - High Jun 16
- RES 2: $1829.8 - 38.2% retracement of the Mar 8 - Jul 21 bear leg
- RES 1: $1783.6/1807.9 - 50-day EMA / High Aug 10 and bull trigger
- PRICE: $1763.7 @ 07:23 BST Aug 18
- SUP 1: $1754.4 - Low Aug 3 and key S/T support
- SUP 2: $1711.7/1681.0 - Low Jul 27
- SUP 3: $1681.0 - Low Jul 21 and the bear trigger
- SUP 4: $1676.9 - Low Mar 8 2021
Gold traded lower yesterday, extending the pullback from last week’s high of $1807.9 (Aug 10). Recent gains saw price trade above trendline resistance drawn from the Mar 8 high. The break represents an important technical breach, highlighting a potential reversal of the 5-month downtrend. On the downside, a stronger pullback however would threaten the bullish theme. Watch support at $1754.4 Aug 3 low. The bull trigger is $1807.9.
SILVER TECHS: Pullback Exposes Support
- RES 4: $21.540 - High Jun 27
- RES 3: $21.000 - Round number resistance
- RES 2: $21.540 - High Jun 27
- RES 1: $20.876 - High Aug 15 and the bull trigger
- PRICE: $19.643 @ 08:11 BST Aug 18
- SUP 1: $19.551/062 - Low Aug 5 / Low Jul 28
- SUP 2: $18.146/18.000 - Low Jul 14 / Round number support
- SUP 3: $17.312 - 3.00 proj of the Mar 8 - 29 - Apr 18 price swing
- SUP 4: $16.955 - Low Jun 15 2020
Silver has failed to hold on to its recent highs and is trading lower again today. The move has exposed support at $19.551, the Aug 5 low. A break of this level would undermine the recent bullish theme and signal scope for a deeper pullback, exposing $19.062 initially, the Jul 28 low. On the upside, key short-term resistance has been defined at $20.876, the Aug 15 high where a break is required to reinstate a bullish theme.
Why MNI
MNI is the leading provider
of intelligence and analysis on the Global Fixed Income, Foreign Exchange and Energy markets. We use an innovative combination of real-time analysis, deep fundamental research and journalism to provide unique and actionable insights for traders and investors. Our "All signal, no noise" approach drives an intelligence service that is succinct and timely, which is highly regarded by our time constrained client base.Our Head Office is in London with offices in Chicago, Washington and Beijing, as well as an on the ground presence in other major financial centres across the world.