
Why MNI
MNI is the leading provider
of intelligence and analysis on the Global Fixed Income, Foreign Exchange and Energy markets. We use an innovative combination of real-time analysis, deep fundamental research and journalism to provide unique and actionable insights for traders and investors. Our "All signal, no noise" approach drives an intelligence service that is succinct and timely, which is highly regarded by our time constrained client base.Our Head Office is in London with offices in Chicago, Washington and Beijing, as well as an on the ground presence in other major financial centres across the world.
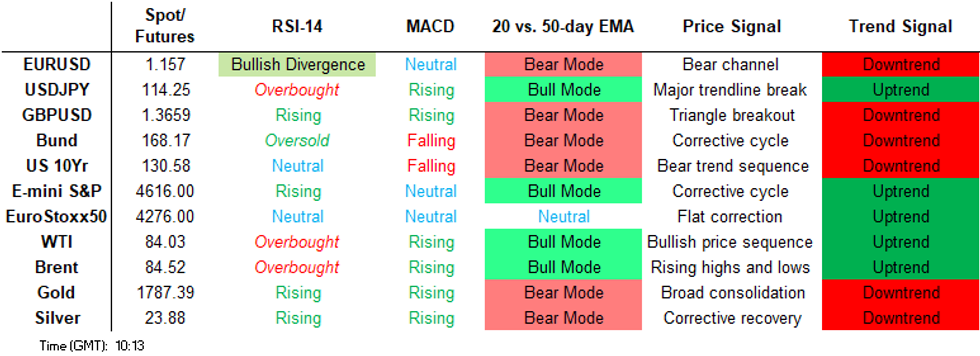
Price Signal Summary - S&P E-Minis Clear 4600.00
- In the equity space, S&P E-minis are trending higher once again and have cleared the 4600.00 handle. The focus is on 4650.60 1.236 projection of Jul 19 - Aug 16 - Aug 19 price swing. EUROSTOXX 50 futures have started the week on a firm note and have cleared key resistance at 4223.00, Sep 6 high and a key bull trigger. The break confirms a resumption of the underlying uptrend and opens 4290.50, 1.00 projection of the Jul 19 - Sep 6 - Oct 6 price swing.
- In FX, EURUSD sold off sharply Friday signalling the end of the recent corrective cycle. The move lower highlights a failure to clear the 50-day EMA and means the bear channel top - a key resistance - at 1.1701 today, remains intact. The channel is drawn off the Jun 1 high. The focus is on 1.1524, Oct 12 low and bear trigger. GBPUSD is softer this morning. A deeper pullback would open 1.3544, the Oct 6 low. USDJPY remains below recent highs but maintains a bullish tone. Scope is seen for a climb towards 114.99, 1.50 projection of the Apr 23 - Jul 2 - Aug 4 price swing. The support zone to watch is 113.21-00, the 20-day EMA and Oct 12 low respectively.
- On the commodity front, Gold is consolidating but maintains a positive short-term tone. Scope is seen for a climb towards $1834.0, the Sep 3 high. Initial support is at$1780.8, the 50-day EMA. WTI broader trend conditions are unchanged although futures remain below last week's high. Support to watch is at $80.58, Oct 28 low.
- In the FI space, Bund futures sights are on 167.52 next, Mar 19 2020 low (cont) following Friday's sell-off and a fresh trend low print. Gilts breached resistance at 152.57 last week. This confirmed a double bottom reversal on the daily chart and signals scope for a climb towards 126.39, 50.0% retracement of the Aug - Oct downleg. Next support is at 124.11, Oct 26 low. Key support though has been defined at 123.43, Oct 21 low.
FOREIGN EXCHANGE
EURUSD TECHS: Sharp Sell-Off
- RES 4: 1.1821 High Sep 16
- RES 3: 1.17155 / High Sep 22
- RES 2: 1.1701 Bear channel top drawn from the Jun 1 high
- RES 1: 1.1621/92 20-day EMA / High Oct 28
- PRICE: 1.1562 @ 05:56 BST Nov 1
- SUP 1: 1.1535/24 Low Oct 29 / Low Oct 12 and the bear trigger
- SUP 2: 1.1493 50.0% retracement of the Mar '20 - Jan '21 bull phase
- SUP 3: 1.1469 1.236 proj of the Jan 6 - Mar 31 - May 25 price swing
- SUP 4: 1.1361 Bear channel base drawn from the Jun 1 high
EURUSD sold off sharply Friday signalling the end of the recent corrective cycle. The move lower highlights a failure to clear the 50-day EMA and more importantly, means the bear channel top - a key resistance - at 1.1701 today, remains intact. A breakout of the channel is required to signal a trend reversal. The focus is on 1.1524, Oct 12 low and bear trigger. A break of this level would confirm a resumption of the downtrend.
GBPUSD TECHS: Back Below Its Key EMAs
- RES 4: 1.3983 High Jul 30
- RES 3: 1.3958 High Aug 4
- RES 2: 1.3913 High Sep 14 and a key resistance
- RES 1: 1.3835 High Oct 20
- PRICE: 1.3682 @ 06:05 BST Nov 1
- SUP 1: 1.3643 Intraday low
- SUP 2: 1.3544 Low Oct 6
- SUP 3: 1.3489 2.0% 10-dma env
- SUP 4: 1.3412 / Low Sep 29 and bear trigger
GBPUSD traded lower Friday and is back below both the 20- and 50-day EMAs. An extension lower would signal scope for a move towards 1.3544, Oct 16 low and this would also highlight the likely resumption of the broader downtrend. On the upside, key short-term resistance has been defined at 1.3835, Oct 20 high. A break would instead confirm a resumption of the recent upleg and open 1.3913, Seo 14 and a key resistance.
EURGBP TECHS: Consolidation Mode
- RES 4: 0.8624/58 High Oct 1 / High Sep 29
- RES 3: 0.8573 High Oct 4
- RES 2: 0.8508 50-day EMA
- RES 1: 0.8479 Intraday
- PRICE: 0.8451 @ 06:14 BST Nov 1
- SUP 1: 0.8403 Low Oct 26 and the bear trigger
- SUP 2: 0.8358/56 1.0% 10-dma envelope / Low Feb 26, 2020
- SUP 3: 0.8339 Low Feb 25, 2020
- SUP 4: 0.8282 Feb 2020 low and a major support
EURGBP remains in its recent consolidative range. For bears, the cross last week breached 0.8422, Oct 21/22 low and this reinforces bearish conditions, signalling scope for weakness below 0.8400 towards 0.8358, a vol based support and 0.8356, the Feb 26, 2020 low. Note that price is also approaching the base of a broad multi-year range at 0.8300. Initial resistance is 0.8479.
USDJPY TECHS: Support Remains Intact
- RES 4: 116.08 1.764 proj of Apr 23 - Jul 2 - Aug 4 price swing
- RES 3: 115.51 High Mar 10, 2017
- RES 2: 114.99 1.50 proj of Apr 23 - Jul 2 - Aug 4 price swing
- RES 1: 114.70/73 High Oct 20 / High Nov 6, 2017
- PRICE: 114.23 @ 06:17 BST Nov 1
- SUP 1: 113.21/00 20-day EMA / Low Oct 12
- SUP 2: 112.08 High Sep 30 and a recent breakout level
- SUP 3: 111.51 Low Oct 8
- SUP 4: 110.82/80 Low Oct 4 / High Aug 11
USDJPY is firmer but remains in a corrective cycle and below recent highs. The pair has held above 113.21, the 20-day EMA and 113.00, the Oct 12 low. A break of this support zone would signal scope for a deeper pullback and open 112.08, Sep 30 high and a recent breakout level. Any deeper short-term pullback however would be considered corrective. Trend conditions remain bullish and the trigger for a resumption of the uptrend is 114.70, Oct 20 high.
EURJPY TECHS: Holding Above Last Week's Lows
- RES 4: 134.40 2.382 proj of the Sep 22 - 29 - Oct 6 price swing
- RES 3: 134.13 High Jun 1 and a key resistance
- RES 2: 133.76 High Jun 10
- RES 1: 132.92/133.48 High Oct 29 / High Oct 20
- PRICE: 132.13 @ 06:31 BST Nov 1
- SUP 1: 131.56/57 Low Oct 28 / 20-day EMA
- SUP 2: 130.75 Sep 3 high / 50-day EMA
- SUP 3: 129.28 Low Oct 11
- SUP 4: 128.94 Low Oct 8
EURJPY last week found support just ahead of its 20-day EMA. Attention remains on this EMA that intersects at 131.57 today. A clear break of it would suggest scope for a deeper corrective pullback and expose 130.75, Sep3 high and a recent key breakout level. Note that 130.75 is where the 50-day EMA intersects today. Trend signals continue to point north, the trigger for a resumption of gains is 133.48, the Oct 20 high.
AUDUSD TECHS: Attention Is On The 200-Day MA
- RES 4: 0.7716 High Jun 16
- RES 3: 0.7630 1.236 proj of the Aug 20 - Sep 3 - Sep 29 price swing
- RES 2: 0.7599 High Jul 6
- RES 1: 0.7557/58 50.0% of the Feb - Aug sell-off / 200-Day MA
- PRICE: 0.7506 @ 06:40 BST Nov 1
- SUP 1: 0.7454 Low Oct 22
- SUP 2: 0.7434/7388 20-day EMA / 50-day EMA
- SUP 3: 0.7288 Low Oct 8
- SUP 4: 0.7226/7170 Low Oct 6 / Low Sep 29
Despite pulling back Friday, AUDUSD continues to trade closer to recent highs. Last week's breach of 0.7546, Oct 21 high confirms a resumption of the uptrend. The climb has narrowed the gap with the 200-dma at 0.7558. Clearance of the average would strengthen bullish conditions and extend the positive price sequence of higher highs and higher lows. Sights are set on 0.7599 next, the Jul 6 high. Firm support is seen at 0.7388, the 50-day EMA.
USDCAD TECHS: Bear Flag Formation
- RES 4: 1.2648 High Oct 6
- RES 3: 1.2507 50-day EMA
- RES 2: 1.2494 Low Sep 3 and a recent breakout level
- RES 1: 1.2433 20-day EMA
- PRICE: 1.2393 @ 06:46 BST Nov 1
- SUP 1: 1.2288 Low Oct 21 and the bear trigger
- SUP 2: 1.2253 Low Jun 23
- SUP 3: 1.2229 76.4% retracement of the Jun - Aug rally
- SUP 4: 1.2157 Low Jun 16
USDCAD remains in a range and continues to consolidate. Recent activity still appears to be a bear flag. If correct, this pattern reinforces current bearish conditions signalling scope for a break lower near-term. A bearish theme follows the recent break of the Jul 30 low of 1.2422 that has opened 1.2253 next, the Jun 23 low. Moving Average conditions remain in a bear mode. Initial firm resistance is seen at 1.2494, Sep 3 low.
FIXED INCOME
BUND TECHS: (Z1) Bearish Price Sequence Intact
- RES 4: 170.55 High Oct 4
- RES 3: 170.19 50-day EMA
- RES 2: 169.83 High Oct 27 and key resistance
- RES 1: 169.17 20-day EMA
- PRICE: 168.45 @ 05:10 BST Nov 1
- SUP 1: 167.71 Low Oct 29
- SUP 2: 167.52 Low Mar 19 2020 (cont)
- SUP 3: 166.33 Low May 21 2019 (cont)
- SUP 4: 166.16 2.50 proj of the Oct 14 - 22 - 27 price swing
Bund futures traded lower Friday and registered a fresh trend low of 167.71. This maintains the current bear trend condition and bearish price sequence of lower lows and lower highs. With momentum and moving average signals remaining in a bear mode condition, scope is seen for weakness towards 167.52 next, the Mar 19 2020 low (cont). Key short-term trend resistance has been defined at 169.83, Oct 27 high.
BOBL TECHS: (Z1) Bearish Extension
- RES 4: 135.200 Low Sep 17, high Oct 4 and recent breakout level
- RES 3: 135.060 High Oct 7
- RES 2: 134.860 High Oct 14
- RES 1: 134.180/610 High Oct 29 / High Oct 28 and key resistance
- PRICE: 133.930 @ 05:15 BST Nov 1
- SUP 1: 133.690 Low Oct 29
- SUP 2: 133.340 Low Mar 19 and key medium-term support (cont)
- SUP 3: 133.308 1.764 proj of the Oct 4 - 13 - 14 price swing
- SUP 4: 133.100 2.00 proj of the Oct 4 - 13 - 14 price swing
Bobl futures traded lower again Friday confirming a resumption of the underlying downtrend. This reinforces bearish conditions and maintains a price sequence of lower lows and lower highs. Key short-term trend resistance is at 134.610, Oct 28 high and a break is required to signal scope for a short-term reversal. With momentum still pointing south, the focus is on 133.340 next, the Mar 19 low on the continuation chart.
SCHATZ TECHS: (Z1) Trend Needle Still Points South
- RES 4: 112.255 High Sep 23 and Oct 5
- RES 3: 112.220 High Oct 14
- RES 2: 112.160 High Oct 26 and key near-term resistance
- RES 1: 112.050 High Oct 29
- PRICE: 111.980 @ 05:19 BST Nov 1
- SUP 1: 111.945 Low Oct 28
- SUP 2: 111.925 1.236 proj of the Oct 14 - 19 - 26 price swing
- SUP 3: 111.897 1.382 proj of the Oct 14 - 19 - 26 price swing
- SUP 4: 111.865 Low Jun 5/8 2020 low (cont)
From a trend perspective, Schatz futures remain bearish and last week's extension lower registered fresh trend lows. The break of 112.030, Oct 19 low confirmed a resumption of the downtrend and maintains the bearish price sequence of lower lows and lower highs. This signals scope for weakness towards 111.865, the Jun 5 / 8, 2020 low. Key short-term resistance has been defined at 112.160, Oct 26 high.
GILT TECHS: (Z1) Pullback Holds Above Initial Support
- RES 4: 127.09 61.8% retracement of the Aug - Oct downleg
- RES 3: 126.84 Low Sep 17
- RES 2: 126.39 50.0% retracement of the Aug - Oct downleg
- RES 1: 125.87 High Oct 27
- PRICE: 124.92 @ Close Oct 29
- SUP 1: 124.11 Low Oct 26
- SUP 2: 123.43 Low Oct 21 and the bear trigger
- SUP 3: 123.16 Low Feb 27, 2019 (cont)
- SUP 4: 122.75 2.236 proj of the Aug 31 - Sep 17 - 21 price swing
Gilt futures rallied Oct 27 signalling a short-term reversal. In pattern terms, Wednesday's breach of 125.27, Oct 14 high highlights a double bottom reversal. The close above 125.27 confirmed this pattern and sets the scene for an extension higher near-term above 126.00 towards 126.39, a retracement level. Initial support is at 124.11,Oct 26 low. Key trend support has been defined at 123.43, Oct 21 low.
BTP TECHS: (Z1) Remains Vulnerable
- RES 4: 154.64 High Sep 22 / 23
- RES 3: 153.59 High Sep 24
- RES 2: 152.54/87 High Oct 14 / High Oct 1
- RES 1: 149.69/151.89 High Oct 29 / High Oct 27 and key resistance
- PRICE: 148.26 @ Close Oct 29
- SUP 1: 147.82 Low Oct 29
- SUP 2: 147.51 1.382 proj of the Sep 23 - Oct 6 - 14 price swing
- SUP 3: 147.13 76.4% retracement of the May - Aug rally (cont)
- SUP 4: 146.65 1.618 proj of the Sep 23 - Oct 6 - 14 price swing
BTP futures sold off sharply once again Friday and bearish conditions continue to dominate. The break lower maintains and extends the bearish price sequence of lower lows and lower highs. With moving average signals also pointing south, the focus shifts to 147.51, a Fibonacci projection. Key short-term resistance has been defined at 151.89, Oct 27 high. A break of this level is required to signal a potential short-term base.
EQUITIES
EUROSTOXX 50 TECHS: (Z1) Clears Key Resistance
- RES 4: 4400.00 Round number resistance
- RES 3: 4385.00 1.236 proj of Mar 19- Jul 21-Oct 30 2020 swing (cont)
- RES 2: 4290.50 1.00 proj of the Jul 19 - Sep 6 - Oct 6 price swing
- RES 1: 4284.00 Intraday high
- PRICE: 4264.00 @ 05:43 BST Nov 1
- SUP 1: 4178.00/4125.80 Low Oct 29 / 50-day EMA
- SUP 2: 4004.00 / 3949.50 Low Oct 12 / Low Oct 6 and bear trigger
- SUP 3: 3902.50 Low Jul 20
- SUP 4: 3882.00 Low Jul 19 and a key support
EUROSTOXX 50 futures trading higher once again and have started the week on a firm note. The contract has cleared key resistance at 4223.00, the Sep 6 high and a key bull trigger. The clear break of this hurdle confirms a resumption of the underlying uptrend and opens 4290.50, a Fibonacci projection. On the downside, the 50-day EMA, at 4125.80 today, marks an initial key support. A break would signal a potential short-term top.
E-MINI S&P (Z1): Fresh Trend Highs
- RES 4: 4700.00 Round number resistance
- RES 1: 4687.32 1.382 proj of Jul 19 - Aug 16 - Aug 19 price swing
- RES 3: 4650.60 1.236 proj of Jul 19 - Aug 16 - Aug 19 price swing
- RES 1: 4618.25 Intraday high
- PRICE: 4604.25 @ 06:54 BST Nov 1
- SUP 1: 4543.75/4472.00 Low Oct 27 / High Sep 27
- SUP 2: 4442.53 50-day EMA and key near-term support
- SUP 3: 4317.25/4260.00 Low Oct 12 / Low Oct 1 and the bear trigger
- SUP 4: 4243.50 Low Jul 20
S&P E-minis remain bullish and have started the week on a firmer note, breaching last week's high and the 4600.00 handle. Fresh trend highs confirm a resumption of the uptrend and the focus is on 4650.60 next, a Fibonacci projection. Trend signals such as moving average studies remain in a bull mode, reinforcing current trend conditions. The 50-day EMA at 4442.53 represents the initial firm support handle.
COMMODITIES
BRENT TECHS: (F2) Remains Below Recent Highs
- RES 4: $91.20 - 2.382 proj of the Aug 23 - Sep 3 - Sep 9 price swing
- RES 3: $90.00 - Psychological round number
- RES 2: $87.73 - 2.00 proj of the Aug 23 - Sep 3 - Sep 9 price swing
- RES 1: $86.70/87.00 - High Oct 25 / Round number resistance
- PRICE: $83.36 @ 06:56 BST Nov 1
- SUP 1: $81.61/57 - Low Oct 28 / Low Oct 13
- SUP 2: $80.00 - Round number support
- SUP 3: $78.50/42 - 50-day EMA / Low Oct 7
- SUP 4: $75.80 - Low Sep 30
Brent futures found resistance last week and price remains below the Oct 25 high of $85.77. The contract has recently traded through $83.36, Oct 21 low and probed the 20-day EMA. A resumption of weakness would signal scope for a deeper corrective pullback and expose $80.00, with the 50-day EMA at $78.50. Key resistance and the bull trigger has been defined at $86.70, Oct 25 high. A break would resume the uptrend.
WTI TECHS: (Z1) Eyeing The 20-Day EMA
- RES 4: $88.96 - 1.382 proj of the Sep 21 - Oct 6 - 7 price swing
- RES 3: $87.45 - 1.236 proj of the Sep 21 - Oct 6 - 7 price swing
- RES 2: $86.00 - Round number resistance
- RES 1: $85.41 - High Oct 25 and the bull trigger
- PRICE: $83.03 @ 07:05 BST Nov 1
- SUP 1: $80.86/58 - 20-day EMA / Low Oct 28
- SUP 2: $78.78 - Low Oct 13
- SUP 3: $76.36 - 50-day EMA
- SUP 4: $74.67 - Low Oct 7 and key near-term support
WTI futures faced resistance last week and the contract remains below recent highs. Attention is on the 20-day EMA that intersects at $80.86. A clear breach of this average would signal scope for a deeper pullback and open $78.78, Oct 13 low. The 50-day EMA lies at $76.36. Key resistance and the bull trigger has been defined at $85.41, Oct 25 high. A break would confirm a resumption of the uptrend.
GOLD TECHS: Off Recent Highs
- RES 4: $1863.3 - 76.4% retracement of the Jun - Aug sell-off
- RES 3: $1844.9 - Low Jun 14
- RES 2: $1834.0 - High Sep 3 and the bull trigger
- RES 1: $1813.8 - High Oct 22 and key short-term resistance
- PRICE: $1783.8 @ 07:20 BST Nov 1
- SUP 1: $1772.0/1760.4 - Low Oct 29 / Low Oct 18
- SUP 2: $1746.0 - Low Oct 6 and key near-term support
- SUP 3: $1721.7 - Low Sep 29 and the bear trigger
- SUP 4: $1717.8 - Low Aug 10
Gold traded lower Friday. Although the pullback does threaten the recent bullish tone, the yellow metal remains in a short-term uptrend for now. Price recently cleared resistance at $1800.6, Oct 14 high and this highlighted a S/T bullish theme. A resumption of gains would open $1834.0, Sep 3 high. On the downside, a key S/T support has been defined at $1760.4, Oct 18 low. A break would instead suggest scope for a deeper pullback.
SILVER TECHS: Pullback Considered Corrective
- RES 4: $26.002 - High Aug 4
- RES 3: $25.206 - High Jun 8
- RES 2: $24.867 - High Sep 3 and the reversal trigger
- RES 1: $24.828 - High Oct 22
- PRICE: $23.859 @ 07:24 BST Nov 1
- SUP 1: $23.015 - Low Oct 18
- SUP 2: $22.213 - Low Oct 6
- SUP 3: $21.423 - Low Sep 29 and key support
- SUP 4: $20.871 - 50.0% retracement of the Mar '20 - Feb '21 rally
The current bull cycle in Silver remains intact despite the recent pullback. The metal recently cleared both the 20- and 50 day EMAs and remains above these averages. The extension higher paves the way for $24.867, Sep 3 high and a key near-term resistance. Clearance of this hurdle would strengthen the case for bulls and open $26.00. Initial firm support to watch is $23.015, Oct 18 low. A break would threaten the current bullish price structure.
Why MNI
MNI is the leading provider
of intelligence and analysis on the Global Fixed Income, Foreign Exchange and Energy markets. We use an innovative combination of real-time analysis, deep fundamental research and journalism to provide unique and actionable insights for traders and investors. Our "All signal, no noise" approach drives an intelligence service that is succinct and timely, which is highly regarded by our time constrained client base.Our Head Office is in London with offices in Chicago, Washington and Beijing, as well as an on the ground presence in other major financial centres across the world.