
Why MNI
MNI is the leading provider
of intelligence and analysis on the Global Fixed Income, Foreign Exchange and Energy markets. We use an innovative combination of real-time analysis, deep fundamental research and journalism to provide unique and actionable insights for traders and investors. Our "All signal, no noise" approach drives an intelligence service that is succinct and timely, which is highly regarded by our time constrained client base.Our Head Office is in London with offices in Chicago, Washington and Beijing, as well as an on the ground presence in other major financial centres across the world.
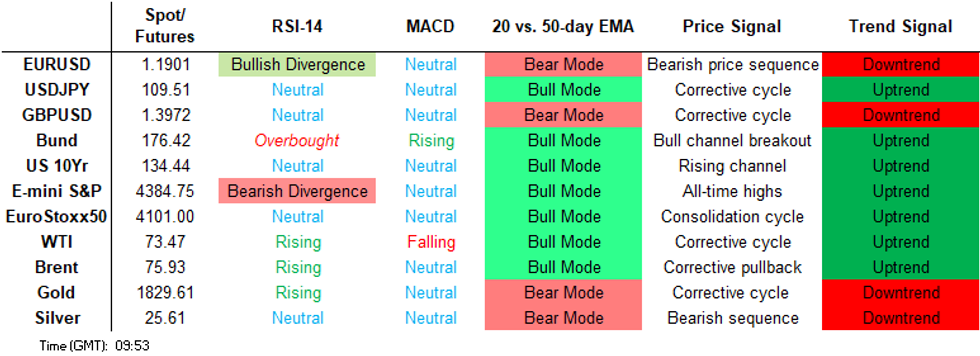
Price Signal Summary - USD Faces Selling Pressure
- In the equity space, the recent pullback in the S&P E-minis is considered corrective. The outlook is bullish and the focus is on 4420.92, 0.764 projection of the Jun 21 - Jul 14 - 19 price swing. Support is at 4348.92, the 20-day EMA. A bullish theme remains intact in EUROSTOXX 50 and potential is for a climb towards 4153.00 key resistance, Jun 17 high. Support is at 4029.50, Jul 22 high.
- In FX, the USD is facing some selling pressure. EURUSD has traded above 1.1851, Jul 15 high. The focus is on the 50-day EMA at 1.1916. This represents an important resistance area. GBPUSD is holding onto recent gains. The pair has cleared its 50-day EMA strengthening the current bullish recovery. The next band of resistance is at 1.3990, 61.8% retracement of the Jun 1 - Jul 20 sell-off and 1.4001, the Jun 23 high. {JN} USDJPY remains above 109.07, Jul 19 low. This represents the key short-term support and the bear trigger. Key near-term resistance is 110.70, Jul 14 high. A break of 110.70 would be bullish.
- On the commodity front, Gold is recovering from recent lows. The focus is on the bull trigger at $1834.1, Jul 15 high. Key short-term support is at $1790.0, Jul 23 low. Brent (V1) has cleared $74.47, 76.4% of the Jul 6 - 20 downleg. The focus is on $75.92, Jul 14 high. WTI (U1) is firmer and the focus is on $74.90, Jul 13 high.
- Within FI, Bund futures remain firm with sights on 176.79, 1.50 projection of the May 19 - Jun 11 - Jun 22 price swing. Gilts maintain a bullish tone. The recent break of 129.92, Jul 8 high opens 130.72, 2.236 projection of the May 13 - 26 - Jun 3 price swing. We continue to monitor a bearish candle pattern, an evening star reversal from the Jul 21 close. A deeper pullback would expose 128.54, low Jul 14.
FOREIGN EXCHANGE
EURUSD TECHS: Approaching The 50-Day EMA
- RES 4: 1.2006 High Jun 29 / Jun 17
- RES 3: 1.1948/75 38.2% of the May 25 - Jul 21 sell-off / High Jun 25
- RES 2: 1.1930 High Jun 29
- RES 1: 1.1916 50-day EMA
- PRICE: 1.1888 @ 06:02 BST Jul 30
- SUP 1: 1.1752 Low Jul 21 and the bear trigger
- SUP 2: 1.1738 Low Apr 5
- SUP 3: 1.1704 Low Mar 31 and a key support
- SUP 4: 1.1603 Low Nov 4, 2020
EURUSD traded higher Thursday and cleared a former resistance at 1.1851, Jul 15 high. The extension has exposed the 50-day EMA at 1.1916. This average represents a key short-term resistance. A clear break is required to signal scope for a more significant reversal. On the downside, the bear trigger is at 1.1752, Jul 21 low. Note, gains still appear corrective, in line with a bearish trend direction.
GBPUSD TECHS: Approaching Key Resistance
- RES 4: 1.4133 High Jun 16
- RES 3: 1.4088 76.4% retracement of the Jun 1 - Jul 20 sell-off
- RES 2: 1.4001 High Jun 23
- RES 1: 1.3990 61.8% retracement of the Jun 1 - Jul 20 sell-off
- PRICE: 1.3946 @ 06:11 BST Jul 30
- SUP 1: 1.3836/3767 20-day EMA / Low Jul 27
- SUP 2: 1.3691 Low Jul 22
- SUP 3: 1.3572 Low Jul 20 and the bear trigger
- SUP 4: 1.3520/10 Low Jan 18 / 2.0%10-dma envelope
GBPUSD traded higher again Thursday. The pair has cleared the 50-day EMA. The move above this average strengthens the current corrective recovery, signalling scope for gains towards 1.3990 next, a Fibonacci retracement. This lies ahead of a key short-term level at 1.4001, the Jun 23 high. A failure ahead of these resistance points would suggest the end of the current correction. First support is at 1.3836, the 20-day EMA.
EURGBP TECHS: Consolidating At Recent Lows
- RES 4: 0.8701/21 High May 7 / High Apr 26 and the bull trigger
- RES 3: 0.8672 High May 25
- RES 2: 0.8610/70 High Jul 22 / High Jul 20 and a key resistance
- RES 1: 0.8580 50-day EMA
- PRICE: 0.8521 @ 06:20 BST Jul 30
- SUP 1: 0.8500 Low Jul 28
- SUP 2: 0.8479 1% 10-dma envelope
- SUP 3: 0.8472 Low Apr 5
- SUP 4: 0.8430 Low Feb 27, 2020
EURGBP is consolidating at this week's lows. The recent sharp move lower has resulted in a probe of support at 0.8504, the Jul 14 low and a near-term bear trigger. A clear break of this level would strengthen a bearish case and open 0.8472, the Apr 5 low. Moving average studies are in a bear mode highlighting a bearish theme. On the upside, key resistance is unchanged at 0.8670, the Jul 20 high.
USDJPY TECHS: Approaching Support
- RES 4: 111.71 High Mar 24, 2020
- RES 3: 111.66 High Jul 2 and the bull trigger
- RES 2: 110.70/82 High Jul 14/ High Jul 7
- RES 1: 110.59 High Jul 23
- PRICE: 109.53 @ 06:26 BST Jul 30
- SUP 1: 109.36/07 Intraday low / Low Jul 19
- SUP 2: 108.56 Low May 25
- SUP 3: 108.47/34 76.4% of the Apr 23 - Jul 2 rally / Low May 7
- SUP 4: 108.08 Low Apr 27
USDJPY traded lower Thursday. A bearish focus dominates. This follows the recent Jul 19 break of support at 109.48, Jul 29 low. The move lower marks a resumption of the reversal from early July and paves the way for an extension lower. Note that support at 109.19 has also been breached, Jun 7 low. Attention is on 108.47, a Fibonacci retracement. Firm short-term resistance is at 110.70, Jul 14 high, a break would alter the picture.
EURJPY TECHS: Consolidation Mode
- RES 4: 132.43 High Jul 1
- RES 3: 131.86 Jul 6 high
- RES 2: 131.01/09 50-day EMA / High Jul 13
- RES 1: 130.56 High Jul 29
- PRICE: 130.09 @ 06:34 BST Jul 30
- SUP 1: 129.49 Low Jul 22
- SUP 2: 128.63/60 200-dma / Low Jul 20 and the bear trigger
- SUP 3: 128.29 Low Mar 24 and key support
- SUP 4: 127.88 38.2% retracement of the Oct '20 - Jun rally
EURJPY remains in a consolidation mode. The outlook is bearish and recent gains are still considered corrective. Attention is on the 200-dma at 128.63. A clear break of the average would reinforce the current bearish theme and signal scope for an extension of the downtrend. Note, moving average studies remain bearish. Potential is for a move to 127.88, 38.2% of the Oct '20 - Jun rally. 131.01 marks resistance, the 50-day EMA.
AUDUSD TECHS: Bearish Focus
- RES 4: 0.7523 50-day EMA
- RES 3: 0.7503 High Jul 13
- RES 2: 0.7487 High Jul 15
- RES 1: 0.7429 High Jul 19
- PRICE: 0.7382 @ 06:38 BST Jul 30
- SUP 2: 0.7290 Low Jul 21 and the bear trigger
- SUP 3: 0.7284 Low Nov 24, 2020
- SUP 3: 0.7235 1.382 proj of Feb 25 - Apr 1 - May 10 price swing
- SUP 4: 0.7222 Low Nov 13, 2020
AUDUSD remains in a range. The trend outlook is unchanged and bearish. This follows the recent breach of a channel base drawn from the Feb 25 high. Despite the fact that price has moved back inside the channel area, the move lower marks an important technical break, signalling potential for 0.7235 next, a 1.236 projection of the Feb 25 - Apr 1 - May 10 price swing. On the upside, initial resistance is at 0.7429, Jul 19 high.
USDCAD TECHS: Watching The 50-Day EMA
- RES 4: 1.2881 High Jan 28
- RES 3: 1.2807/46 High Jul 19 / 1.236 proj of Jun 1 - 21- 23 swing
- RES 2: 1.2730 High Jul 20
- RES 1: 1.2607 High Jul 23
- PRICE: 1.2455 @ 06:42 BST Jul 30
- SUP 1: 1.2421 50-day EMA
- SUP 2: 1.2407 50.0% retracement of the Jun 1 - Jul 19 rally
- SUP 3: 1.2313 61.8% retracement of the Jun 1 - Jul 19 rally
- SUP 4: 1.2253 Low Jun 23
USDCAD traded lower Thursday. The pair has breached immediate support at 1.2525, Jul 28 low and 1.2502, Jul 14 low. The break suggests scope for a deeper corrective pullback and attention is the 50-day EMA that intersects at 1.2421. A clear breach of the average is needed to strengthen the current downward cycle. On the upside, initial resistance is at 1.2607, Jul 23 high. A break of this level would signal the resumption of bullish activity.
FIXED INCOME
BUND TECHS: (U1) Heading North
- RES 4: 178.32 High Jan 27 (cont)
- RES 3: 177.69 1.764 proj of the May 19 - Jun 11 - Jun 22 price swing
- RES 2: 177.19 1.618 proj of the May 19 - Jun 11 - Jun 22 price swing
- RES 1: 176.79 1.50 proj of the May 19 - Jun 11 - Jun 22 price swing
- PRICE: 176.68 @ 05:21 BST Jul 30
- SUP 1: 175.82/24 Low Jul 27 / Low Jul 22
- SUP 2: 174.77/45 High Jul 8 / Low Jul 15
- SUP 3: 173.79 50-day EMA
- SUP 4: 173.70 Low Jul 13 and 14
Bund futures are trading at this week's highs and maintain a firmer tone. The current bullish sequence of higher highs and higher lows remains intact and this signals scope for a climb towards 176.79 next, a Fibonacci extension. Moving average conditions remain in bull mode, reinforcing the current positive trend structure. On the downside, initial firm support is seen at 175.24, Jul 22 low.
BOBL TECHS: (U1) Holding Onto Gains
- RES 4: 135.575 1.618 proj of May 20 - Jun 11 - Jun 22 price swing
- RES 3: 135.520 High Mar 25, (cont)
- RES 2: 135.450 1.50 proj of the May 20 - Jun 11 - Jun 22 price swing
- RES 1: 135.410 High Jul 29
- PRICE: 135.380 @ 05:08 BST Jul 30
- SUP 1: 135.030/134.900 Low Jul 26 / Low Jul 22
- SUP 2: 134.834/710 20-day EMA / High Jul 8
- SUP 3: 134.562 50-day EMA
- SUP 4: 134.410 Low Jul 13 and a key support
Bobl futures are holding onto gains and traded higher yesterday as a bullish theme continues to dominate. The break on Jul 8 of 134.510, Jun 11 high and a Fibonacci projection confirmed a resumption of the uptrend and bulls have not looked back. Note too that the rising channel top drawn from the May 20 low has also been breached. The focus is on 135.450, a Fibonacci projection. Initial firm support lies at 134.900, Jul 22 high.
SCHATZ TECHS: (U1) Still Defying Gravity
- RES 4: 112.450 High Dec 11, 2020 (cont)
- RES 3: 112.412 2.50 proj of the Jun 22 - Jul 8 - Jul 13 price swing
- RES 2: 112.400 2.382 proj of the Jun 22 - Jul 8 - Jul 13 price swing
- RES 1: 112.385 2.236 proj of the Jun 22 - Jul 8 - Jul 13 price swing
- PRICE: 112.370 @ 05:35 BST Jul 30
- SUP 1: 112.325/285 Low Jul 28 / Low Jul 26
- SUP 2: 112.245 Low Jul 21
- SUP 3: 112.210 Low Jul 20
- SUP 4: 112.180/150 Low Jul 16 / Low Jul 13
Schatz futures remain bullish and the contract continues to climb. The clear break on Jul 20 of resistance at 112.210, Jun 11 high established an uptrend. Further gains are favoured with the focus on 112.385 next, a Fibonacci projection. Recent gains have also established a bullish price sequence of higher highs and higher lows, the definition of an uptrend. Initial firm support is seen at 112.285, Jul 26 low.
GILT TECHS: (U1) Still Below Recent Highs
- RES 4: 131.37 38.2% retracement of the Aug '20 - Jun sell-off
- RES 3: 130.72 2.236 proj of the May 13 - 26 - Jun 3 price swing
- RES 2: 130.62 High Feb 22 (cont)
- RES 1: 130.48 High Jul 20 and the bull trigger
- PRICE: 129.75 @ Close Jul 29
- SUP 1: 129.10 Low Jul 22
- SUP 2: 128.54/39 Low Jul 14 / High Jun 11 and recent breakout level
- SUP 3: 128.03 Jul 6
- SUP 4: 127.25 Low Jun 10
Gilt futures are consolidating. A bullish condition dominates following recent gains and the break of 129.92, Jul 8 high. The move above this level confirmed a resumption of the uptrend from mid-May and maintains a bullish price sequence of higher highs and higher lows. The focus is on 130.62, Feb 22 high (cont). Note, the Jul 21 close highlights a 3-day evening star candle reversal pattern, a concern for bulls. Watch support at 128.54, low Jul 14.
BTP TECHS: (U1) Bulls Remain In Charge
- RES 4: 156.73 1.236 proj of May 19 - Jun 14 - Jun 25 price swing
- RES 3: 155.44 1.00 proj of May 19 - Jun 14 - Jun 25 price swing
- RES 2: 155.00 Round number resistance
- RES 1: 154.47 High Jul 29
- PRICE: 154.35 @ Close Jul 29
- SUP 1: 153.16/152.65 20-day EMA / Low Jul 14
- SUP 2: 152.59 Bull channel base drawn off the May 19 low
- SUP 3: 151.93/54 Low Jul 8 / Low Jul 6
- SUP 4: 151.19 High Jul 1
BTPs remain bullish and are trading at recent highs. A positive outlook follows the recent resumption of the uptrend that started May 19 - gains on Jul 6 and 7 resulted in a breach of a former key resistance at 152.47, Jun 14 high and established a bullish price sequence of higher highs and higher lows. Subsequent gains reinforce the positive theme and attention is on the 155.00 handle next. Initial support is at 153.16, the 20-day EMA.
EQUITIES
EUROSTOXX 50 TECHS: (U1) Bullish Focus
- RES 4: 4218.00 1.00 proj of the May 13 - Jun 17 - Jul 19 price swing
- RES 3: 4153.00 High Jun 17 and the bull trigger
- RES 2: 4141.80 0.764 proj of the May 13 - Jun 17 - Jul 19 price swing
- RES 1: 4123.50 High Jul 29
- PRICE: 4078.50 @ 05:56 BST Jul 30
- SUP 1: 4029.50 Low Jul 22
- SUP 2: 3944.00/3895.00 Low Jul 21 / Low Jul 19
- SUP 3: 3871.00 Low Jul 21 / Low May 19
- SUP 4: 3830.00 Low May 13 and a key support
EUROSTOXX 50 futures traded higher yesterday. A bullish short-term theme remains intact following the recent print above a key near-term resistance at 4101.50, Jul 1 high. The breach of this level places on hold a recent bearish outlook and instead signals scope for a stronger recovery. Attention shifts to the 4153.00 key resistance, Jun 17 high and the bull trigger. Key support has been defined at 3895.00.
E-MINI S&P (U1): Corrective Pullback
- RES 4: 4542.58 1.236 proj of Jun 21 - Jul 14 - 19 price swing
- RES 3: 4500.00 Round number resistance
- RES 2: 4481 75.1.00 proj of Jun 21 - Jul 14 - 19 price swing
- RES 1: 4420.92 0.764 proj of Jun 21 - Jul 14 - 19 price swing
- PRICE: 4377.25 @ 07:02 BST Jul 30
- SUP 1: 4348.92 20-day EMA
- SUP 2: 4276.18/4224.00 50-day EMA / Low Jul 19 and key support
- SUP 3: 4126.75 Low Jun 21
- SUP 4: 4046.00 Low May 19
S&P E-minis outlook remains bullish despite the current pullback. Recent gains confirmed a resumption of the uptrend and signal scope for a continuation near-term. The sell-off Jul 14 - 19 resulted in a break of 4279.25, Jul 8 low. However the contract found support at the 50-day EMA - this EMA represents an important support and the bounce from it is bullish. The focus is on 4420.92, a Fibonacci projection. Key support is at 4224.00, Jul 19 low.
COMMODITIES
BRENT TECHS: (V1) Clears All Key Retracement Levels
- RES 4: $78.03 - High Oct 29, 2018 (cont)
- RES 3: $76.80 - High Jul 6 and the bull trigger
- RES 2: $75.92 - High Jul 14
- RES 1: $75.15 - High Jul 29
- PRICE: $74.44 @ 06:47 BST Jul 30
- SUP 1: $71.62 50-day EMA
- SUP 2: $71.11 Low Jul 22
- SUP 3: $66.91/43 - Low Jul 20 and the bear trigger
- SUP 4: $65.75 - Low May 24
Brent futures remain firm. Price has recently cleared $74.47, the 76.4% retracement of the Jul 6 - 20 downleg. The breach of this level strengthens the short-term bullish case, signalling scope for further upside and opens the key resistance at $76.80, Jul 6 high. A break of this hurdle would confirm a resumption of the broader uptrend. A reversal lower is required to refocus attention on $66.91, Jul 20 low and key support.
WTI TECHS: (U1) Extends Gains
- RES 4: $76.90 High Oct 3, 2018 (cont)
- RES 3: $76.48 0.764 proj of the May 21 - Jul 6 - Jul 20 price swing
- RES 2: $76.07 - High Jul 6 and the bull trigger
- RES 1: $73.68/74.90 - High Jul 29 / High Jul 13
- PRICE: $73.07 @ 07:01 BST Jul 30
- SUP 1: $69.86 - 50-day EMA
- SUP 2: $65.01/64.60 - Low Jul 20 / 76.4% of the May 21 - Jul 6 rally
- SUP 3: $63.10 - Low May 24
- SUP 4: $61.06 - Low May 21 and key support
WTI futures are firmer and yesterday resumed the rebound from $65.01, Jul 20 low. Price has cleared the 76.4% retracement of the Jul 6 - 20 downleg at $73.46. The break strengthens a bullish case and has put on hold a recent bearish theme. This signals scope for a climb towards key resistance at $76.07, the Jul 6 high. A reversal lower would refocus attention on $65.01, Jul 20 low and the key support.
GOLD TECHS: Key Near-Term Resistance Exposed
- RES 4: $1877.5 - 76.4% retracement of the Jun 1 - 29 decline
- RES 3: $1863.3 - High Jun 16
- RES 2: $1853.3 - 61.8% retracement of the Jun 1 - 29 decline
- RES 1: $1834.1 - High Jul 15 and the bull trigger
- PRICE: $1827.1 @ 07:16 BST Jul 30
- SUP 1: $1790.0 Low Jul 23
- SUP 2: $1774.4/1750.8 - Low Jul 2 / Low Jun 29
- SUP 3: $1733.5 -76.4% retracement of the Mar 8 - Jun 1 rally
- SUP 4: $1723.8 - Low Apr 13
Gold has recovered from recent lows and support has remained intact. The outlook is bullish and the recent pullback was considered corrective. Price still needs to clear $1834.1, Jul 15 high to confirm a resumption of the bull cycle. This would open $1853.3, a Fibonacci retracement. Support to watch is $1790.0, Jul 23 low. A clear breach would be bearish and instead signal scope for an extension lower towards key support at $1750.8, Jun 29 low.
SILVER TECHS: Corrective Rally
- RES 4: $27.831 - High Jun 16
- RES 3: $26.775/27.245 - High Jul 6 and key resistance / High Jun 17
- RES 2: $26.467 - High Jul 14
- RES 1: $25.801 - High Jul 29
- PRICE: $25.507 @ 07:24 BST Jul 30
- SUP 1: $24.496 - Low Jul 28
- SUP 2: $24.257 - Low Apr 1
- SUP 3: $23.781 - Low Mar 31and key support
- SUP 4: $23.524 - Low Dec 7, 2020
Silver traded lower Tuesday confirming a resumption of the downtrend. Price has since recovered although gains are likely corrective. The outlook is bearish with a price sequence of lower lows and lower highs continuing to dominate. Attention is on $24.257, Apr 1 low and key support at $23.781, the Mar 31 low. Moving average studies also point south, reinforcing the current trend direction. Initial resistance is at $25.801, Jul 29 high.
Why MNI
MNI is the leading provider
of intelligence and analysis on the Global Fixed Income, Foreign Exchange and Energy markets. We use an innovative combination of real-time analysis, deep fundamental research and journalism to provide unique and actionable insights for traders and investors. Our "All signal, no noise" approach drives an intelligence service that is succinct and timely, which is highly regarded by our time constrained client base.Our Head Office is in London with offices in Chicago, Washington and Beijing, as well as an on the ground presence in other major financial centres across the world.