
Why MNI
MNI is the leading provider
of intelligence and analysis on the Global Fixed Income, Foreign Exchange and Energy markets. We use an innovative combination of real-time analysis, deep fundamental research and journalism to provide unique and actionable insights for traders and investors. Our "All signal, no noise" approach drives an intelligence service that is succinct and timely, which is highly regarded by our time constrained client base.Our Head Office is in London with offices in Chicago, Washington and Beijing, as well as an on the ground presence in other major financial centres across the world.
Chinese GDP Miss Moderates Risk-On Flows, NZD Bid After Labour Landslide
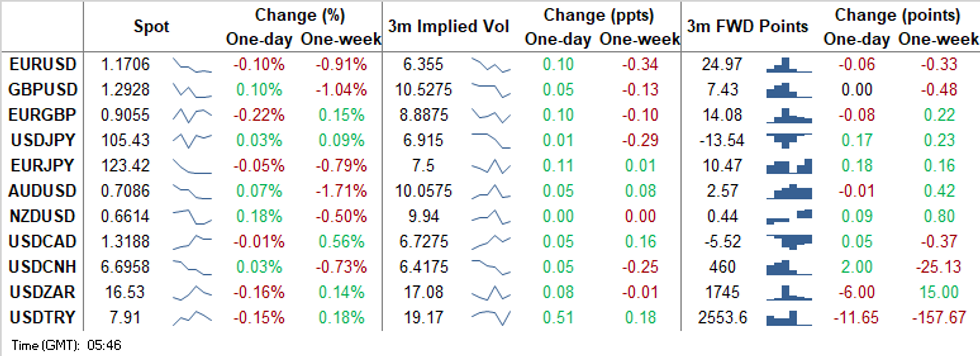
A miss in China's Q3 GDP arrested the upswing in commodity-tied FX, linked to an early uptick in e-minis, but failed to generate any sustained risk-off impulse as local economic activity indicators topped forecasts, sending an optimistic signal re: economic recovery dynamics. Onshore yuan printed its best levels vs. the greenback since Apr 2019 in the lead-up to the release, but both CNY & CNH wiped out initial gains. Yuan dynamics inspired the Antipodeans to trim gains, but they remained afloat nonetheless.
- NZD outperformed its G10 peers after New Zealand's ruling Labour Party secured a landslide victory in the country's general election. PM Ardern's party will be able to govern alone, but still intends to talk with the Greens over an unspecified form of potential collaboration. AUD drew some support from demand for its Antipodean cousin.
- GBP started on a softer footing, as regional players digested Friday's downgrade to the UK's sovereign rating by Moody's, but regained poise amid reports noting that the UK is willing to water down its controversial Internal Markets Bill in a bid to revive talks with the EU.
- USD/JPY erased its initial modest gains on the back of a round of sales into the Tokyo fix.
- KRW led gains in Asia. Broader risk-on impetus allowed USD/KRW to print a fresh 18-month low, despite the absence of any meaningful local catalysts.
- Focus turns to the BoC's Business Outlook Survey and comments from a whole host of central bankers from the Fed, ECB, BoE, Riksbank & Norges Bank.
TECHNICALS:
EUR/USD: Consolidating But Remains Vulnerable
- RES 4: 1.1917 High Sep 10 and 76.4% of the Sep 1 - 25 sell-off
- RES 3: 1.1859 61.8% retracement of the Sep 1 - 25 sell-off
- RES 2: 1.1817/31 High Oct 13 / High Oct 9 and the bull trigger
- RES 1: 1.1771 High Oct 14
- PRICE: 1.1705 @ 05:51 BST Oct 19
- SUP 1: 1.1685 Low Sep 30
- SUP 2: 1.1612/1581 Low Sep 25 and the bear trigger / Low Jul 24
- SUP 3: 1.1526 0.764 proj of Sep 1 - Sep 25 sell-off from Occt 9 high
- SUP 4: 1.1541 Low Jul 23
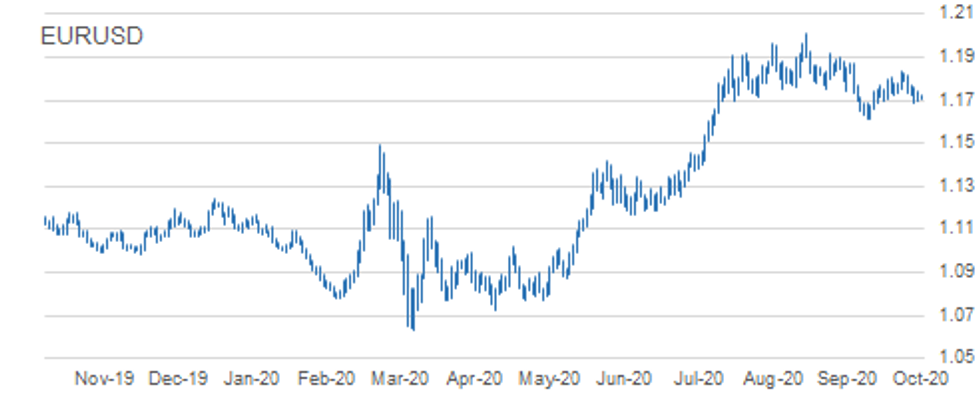
EURUSD is consolidating. The move lower last week followed the recent rejection off 1.1831, Oct 9 high. Attention is on the next important support handle at 1.1685, Sep 30 low. A break would signal scope for a deeper decline and expose the key 1.1612 level, Sep 25 low. 1.1612 also represents the trigger for a resumption of the downtrend that started on Sep 1. Resistance is at 1.1771 Oct 14 high.
GBP/USD: Trading Below Recent Highs
- RES 4: 1.3186 Former trendline support drawn off the Mar 20 low
- RES 3: 1.3174 61.8% retracement of the Sep 1 - 23 sell-off
- RES 2: 1.3083 High Oct 12
- RES 1: 1.3030 High Oct 15
- PRICE: 1.2927 @ 05:56 BST Oct 19
- SUP 1: 1.2863 Low Oct 14
- SUP 2: 1.2846 Low Oct 7 and key near-term support
- SUP 3: 1.2806 Low Sep 30
- SUP 4: 1.2745 Low Sep 28
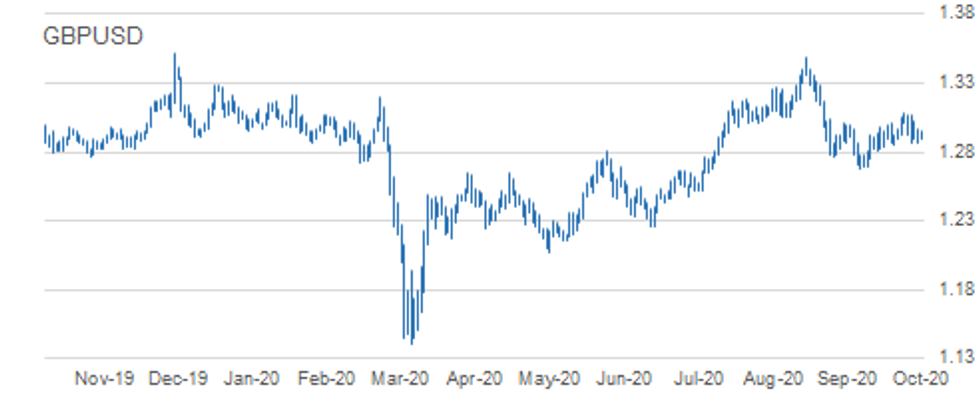
GBPUSD traded in a choppy manner last week. Price remains below the Oct 12 high of 1.3083. A break of this level is needed to resume the recent uptrend that would open 1.3000 and 1.3186. The latter is the former trendline support drawn off the Mar 20 low. The trendline was breached on Sep 9. A break of 1.3186 is required to strengthen a bullish theme. On the downside, firm near-term support lies at 1.2846. A breach of this level would instead signal scope for a deeper pullback.
EUR/GBP: Support Remains Exposed
- RES 4: 0.9190 61.8% retracement of the Sep 11 - 28 sell-off
- RES 3: 0.9162 High Oct 7 and the bull trigger
- RES 2: 0.9132 High Oct 10
- RES 1: 0.9122 Oct 14 high
- PRICE: 0.9056 @ 05:59 BST Oct 19
- SUP 1: 0.9007 Low Oct 14
- SUP 2: 0.9000 Round number support
- SUP 3: 0.8967 76.4% retracement of the Sep 3 - 11 rally
- SUP 4: 0.8808 Low May 13
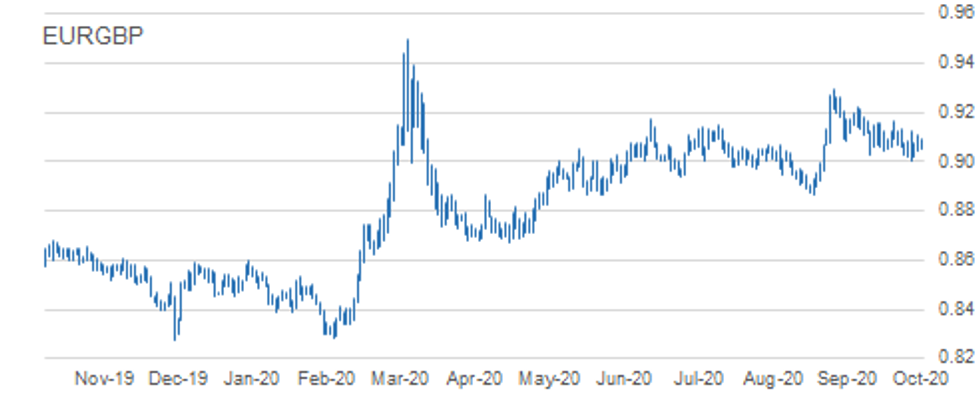
EURGBP maintains a bearish outlook despite recovering off recent lows. The move lower on Oct 14 followed another failed attempt to convincingly clear trendline resistance drawn off the Sep 11 high. Weakness that day also confirmed a resumption of the current downtrend setting the scene for a move to 0.9000 and below towards 0.8967, a retracement level. Resistance is at 0.9122, the Oct 14 high.
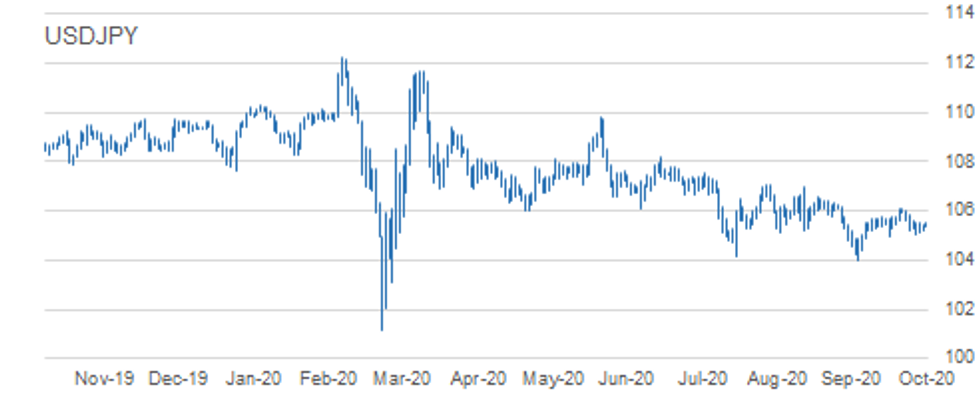
USD/JPY: Focus Is On The Key Near-Term Support
- RES 4: 106.95 High Sep 28
- RES 3: 106.48 Channel resistance drawn off Mar 24 high
- RES 2: 106.11/38 High Oct 7 and the bull trigger / High Sep 8
- RES 1: 105.63 High Oct 13
- PRICE: 105.44 @ 05:07 BST Oct 19
- SUP 1: 105.04 Low Oct 14
- SUP 2: 104.94 Low Oct 2 and key near-term support
- SUP 3: 104.41 Low Sep 22
- SUP 4: 104.00 Low Sep 21 and the bear trigger
USDJPY continues to display a weaker tone. Intraday momentum studies still point south however to strengthen a bearish theme, price needs to trade below 104.94, Oct 2 low. This would open 104.00, Sep 21 low. While 104.94 remains intact, the recent sell-off is considered a correction. The bull trigger is at 106.11, Oct 7 high where a break would resume bullish pressure. Initial resistance is at 105.63.
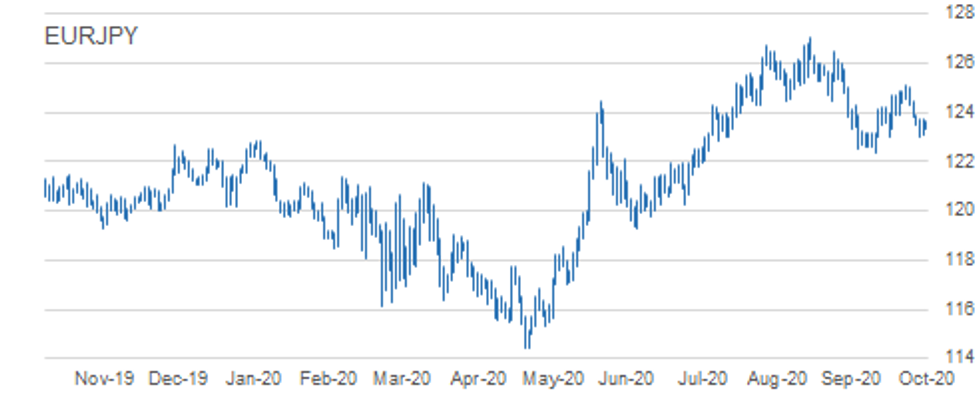
EUR/JPY: Support Still Intact
- RES 4: 125.77 High Sep 15
- RES 3: 125.09/28 High Oct 9 / 61.8% of the Sep 1 - 28 sell-off
- RES 2: 124.48 High Oct 13
- RES 1: 123.94 High Oct 14
- PRICE: 123.44 @ 07:11 BST Oct 19
- SUP 1: 123.03/02 Low Sep 29 and Oct 2 / Low Oct 15
- SUP 2: 122.38/28 Low Sep 28 / 61.8% of the Jun 22 - Sep 1 rally
- SUP 3: 122.25 38.2% retracement of the May - Sep rally
- SUP 4: 121.82 Low Jul 15 and 16
EURJPY maintains a softer tone having traded lower last week. While recent weakness is still considered a correction, attention turns to support at 123.03, Oct 6 low. This level was probed briefly last week. A clear breach of 123.03 would highlight scope for a deeper pullback and open the key support at 122.38, Sep 28 low and the bear trigger. On the upside, key resistance is at 125.09, Oct 9 high. Initial resistance is at 123.94.
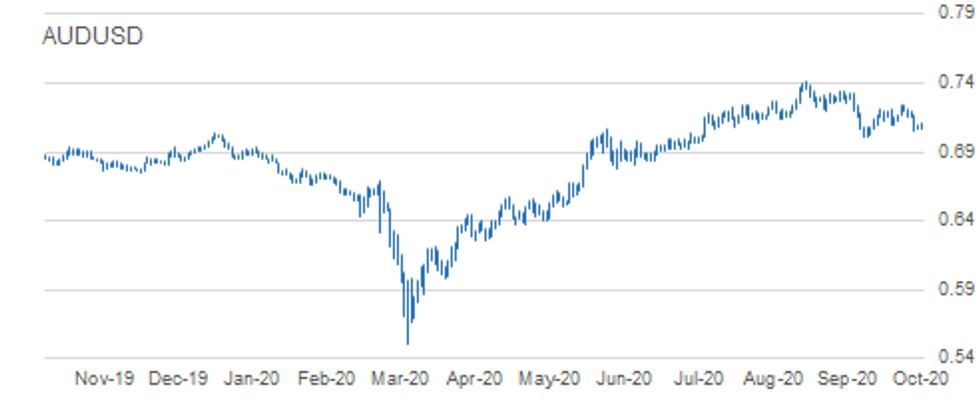
AUD/USD: Appears Vulnerable
- RES 4: 0.7258 61.8% retracement September Sell-Off
- RES 3: 0.7243 High Oct 10 and the intraday bull trigger
- RES 2: 0.7201 Trendline resistance drawn off the Sep 1 high
- RES 1: 0.7170 High Oct 15
- PRICE: 0.7089 @ 06:13 BST Oct 19
- SUP 1: 0.7056 Low Oct 15
- SUP 2: 0.7029 Low Sep 28
- SUP 3: 0.7006 Low Sep 25 and the bear trigger
- SUP 4: 0.6965 23.6% retracement of the Mar - Sep rally
AUDUSD remains vulnerable. On Oct 9, the pair cleared resistance at 0.7209, Oct 1 and 6 high resulting in a test of trendline resistance drawn off the Sep 1 high. The line intersects at 0.7201 today. A failure at the trendline is weighing on the Aussie and, with support at 0.7096, Oct 7 breached, the scene is set for a deeper pullback. Attention turns to the primary support and bear trigger at 0.7006, Sep 25 low. 0.7170 is resistance.
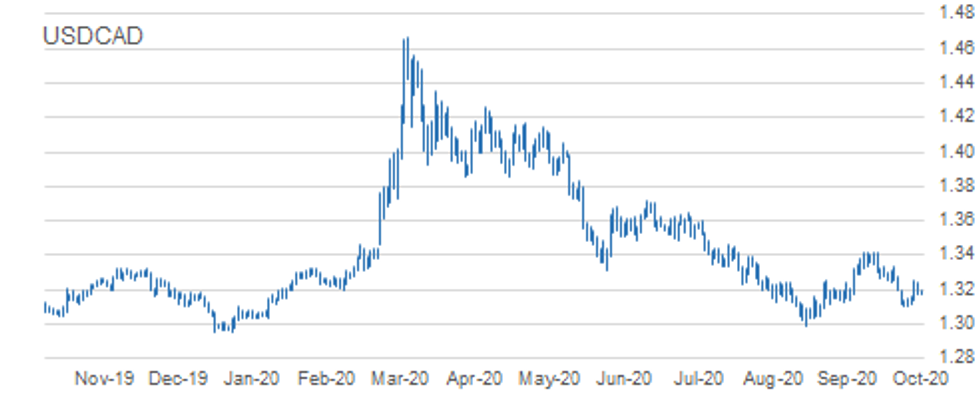
USD/CAD: Needle Still Pointing North
- RES 4: 1.3421 High Sep 30 and primary resistance
- RES 3: 1.3341 High Oct 7 and a reversal trigger
- RES 2: 1.3263/68 50-day EMA / High Oct 7
- RES 1: 1.3259 High Oct 15
- PRICE: 1.3188 @ 06:18 BST Oct 19
- SUP 1: 1.3143 Low Oct 15
- SUP 2: 1.3099 Low Oct 13 and the bear trigger
- SUP 3: 1.3095 76.4% retracement of the Sep 1 - 30 rally
- SUP 4: 1.3038 Low Sep 2
The USDCAD short-term outlook is bullish with recent gains signalling scope for a stronger corrective bounce. The pair has breached the 20-day EMA paving the way for move towards the 50-day EMA that intersects at 1.3263. A clear breach of this average would strengthen a bullish case. On the downside, initial support lies at 1.3143, Thursday's intraday low. A move through this level would however undermine the recent recovery.
MNI KEY LEVELS
EUR/USD: MNI Key Levels
- $1.1856/70 100-mma/Upper 1.0% 10-dma env
- $1.1831 Oct09 high
- $1.1817/27 Oct13 high/Upper Boll Band (2%), Oct12 high
- $1.1793/95 50-dma/55-dma
- $1.1758/60/71 Oct15 high/200-hma/Oct14 high
- $1.1736/46 38.2% 1.3993-1.0341/Oct16 high
- $1.1727/30/33 Intraday high/21-dma/100-hma
- $1.1707 ***CURRENT MARKET PRICE 05:06BST MONDAY***
- $1.1706/94 Intraday low/Oct16 low
- $1.1689/85 Oct15 low/Sep30 low, Sep25 high
- $1.1661 Sep29 low
- $1.1634/30 Lower 1.0% 10-dma env/Lower Boll Band (2%)
- $1.1615/12/09 Cloud base/Sep25 low/100-dma
- $1.1581 Jul24 low, Lower Boll Band (3%)
- $1.1541 Jul23 low
GBP/USD: MNI Key Levels
- $1.3083/84/91 Oct12 high/Upper 1.0% 10-dma env/Upper Boll Band (2%)
- $1.3064/72 Oct14 high/Oct13 high
- $1.3030 Oct15 high
- $1.3007/14/21 Oct06 high, Sep16 high/50-dma/55-dma
- $1.2964 200-hma
- $1.2952/60/62 100-hma/Cloud base/Oct16 high
- $1.2943/46/50 200-wma/Intraday high/50-mma
- $1.2929 ***CURRENT MARKET PRICE 05:09BST MONDAY***
- $1.2892/91 21-dma/Intraday low
- $1.2865/63 Oct16 low/Oct14 low
- $1.2846/41/38 Oct07 low/100-dma/Oct02 low
- $1.2831/24/20 61.8% 1.2676-1.3083/Lower 1.0% 10-dma env/Oct01 low
- $1.2806 Sep30 low
- $1.2781/72 Sep24 high/76.4% 1.2676-1.3083
- $1.2763/51/45 Sep11 low/100-wma/Sep28 low
EUR/GBP: MNI Key Levels
- Gbp0.9163 Upper 1.0% 10-dma envelope
- Gbp0.9156/57/62 Oct01 high/Sep30 high/Oct07 high
- Gbp0.9132 Oct09 high
- Gbp0.9110/22/23 Oct16 high/Oct14 high/Oct08 high
- Gbp0.9091/99 Intraday high/21-dma
- Gbp0.9072/73/79 200-hma/10-dma/Cloud base, Cloud top
- Gbp0.9058/60/63 100-hma/55-dma/50-dma
- Gbp0.9054 ***CURRENT MARKET PRICE 05:20BST MONDAY***
- Gbp0.9052/44/41 Intraday low/Oct16 low/100-dma
- Gbp0.9017/09/07 Oct15 low/Lower Boll Band (2%)/Oct14 low
- Gbp0.8982/67 Lower 1.0% 10-dma env/Sep08 low
- Gbp0.8966 Lower Bollinger Band (3%)
- Gbp0.8925 Sep07 low
- Gbp0.8900/91 Sep04 low/Lower 2.0% 10-dma env
- Gbp0.8880/66 200-dma/Sep03 low
USD/JPY: MNI Key Levels
- Y105.99 Cloud base
- Y105.85 Oct12 high
- Y105.75 50-dma, 55-dma
- Y105.63 Oct13 high
- Y105.58 Cloud Tenkan Sen
- Y105.56 200-hma
- Y105.46/50/52 21-dma/Intraday high/Oct14 high
- Y105.44 ***CURRENT MARKET PRICE 05:25BST MONDAY***
- Y105.35/34 100-hma/Intraday low
- Y105.19 Oct16 low
- Y105.09 Oct15 low, Cloud Kijun Sen
- Y105.04 Oct14 low
- Y105.00 Lower Bollinger Band (2%)
- Y104.94 Oct02 low
- Y104.88 Sep23 low
EUR/JPY: MNI Key Levels
- Y123.94 Oct14 high
- Y123.77 Oct15 high
- Y123.72 21-dma
- Y123.71 Oct16 high
- Y123.68 Cloud base
- Y123.64 Intraday high
- Y123.47/60 100-dma/100-hma
- Y123.42 ***CURRENT MARKET PRICE 05:31BST MONDAY***
- Y123.37 Intraday low
- Y123.12 Oct16 low
- Y123.03 Oct02 low, Sep29 low
- Y123.02 Oct15 low, 76.4% 122.38-125.09
- Y122.80 Lower 1.0% 10-dma envelope
- Y122.43 Lower Bollinger Band (2%)
- Y122.38 Sep28 low
AUD/USD: MNI Key Levels
- $0.7235/43/44 Sep22 high, Oct12 high/Oct09 high/200-wma
- $0.7215/18 Upper 1.0% 10-dma env/Oct13 high
- $0.7191/01/03 Oct14 high/55-dma/50-dma
- $0.7170 Oct15 high
- $0.7153/58 200-hma/Cloud base
- $0.7123/24/37 Oct08 low/100-hma/21-dma
- $0.7100/08 100-dma/Intraday high
- $0.7086 ***CURRENT MARKET PRICE 05:35BST MONDAY***
- $0.7072/71 Lower 1.0% 10-dma env, Intraday low/Oct16 low
- $0.7056 Oct15 low
- $0.7029/19 Sep28 low/Lower Boll Band (2%)
- $0.7006/01 Sep25 low/Lower 2.0% 10-dma env
- $0.6973/63 Jul20 low/Jul16 low, Lower Boll Band (3%)
- $0.6930/21 Lower 3.0% 10-dma env/Jul14 low
- $0.6897 100-wma
USD/CAD: MNI Key Levels
- C$1.3377 100-wma
- C$1.3341/52/55 Oct07 high/Sep29 low/100-dma
- C$1.3320 Upper 1.0% 10-dma env, Cloud top
- C$1.3259/65/73 Oct15 high/21-dma/Oct08 high
- C$1.3238 Oct16 high
- C$1.3219 55-dma
- C$1.3196/09 Intraday high/50-dma
- C$1.3188 ***CURRENT MARKET PRICE 05:38BST MONDAY***
- C$1.3181/76/72 200-hma/50-mma/100-hma
- C$1.3168/62/61 Intraday low/Cloud base/200-wma
- C$1.3143 Oct15 low
- C$1.3117 Oct14 low
- C$1.3099/87 Oct13 low/Sep08 low
- C$1.3076 Lower Bollinger Band (2%)
- C$1.3056 Lower 1.0% 10-dma envelope
OPTIONS: Expiries for Oct19 NY cut 1000ET (Source DTCC)
- EUR/USD: $1.1540-50(E1.1bln), $1.1600(E767mln), $1.1615-20(E720mln-EUR puts), $1.1650(E1.1bln), $1.1700-15(E1.0bln), $1.1730-35(E601mln), $1.1770-75(E1.1bln), $1.1800(E1.0bln), $1.1850(E659mln), $1.1900(E751mln), $1.1950(E981mln)
- USD/JPY: Y105.00($557mln), Y106.00($1.1bln), Y107.00-10($886mln)
- EUR/JPY: Y125.00(E514mln)
- AUD/USD: $0.7280-85(A$718mln)
- USD/CNY: Cny6.7735($1.0bln), Cny6.80($829mln), Cny7.00($750mln)
Larger Option Pipeline
- EUR/USD: Oct20 $1.1745(E1.4bln); Oct22 $1.1600(E1.2bln), $1.1645-50(E1.8bln); Oct23 $1.1840-50(E1.1bln), $1.2000(E1.3bln); Oct26 $1.1500(E1.8bln), $1.1650-60(E1.5bln); Oct28 $1.1800-05(E1.4bln), $1.2000-05(E2.1bln); Oct30 $1.1800(E1.1bln)
- USD/JPY: Oct20 Y106.35-50($2.5bln-USD calls); Oct21 Y105.00-10($1.9bln), Y105.50($1.1bln), Y105.90-106.00($2.2bln), Y106.65($1.0bln); Oct22 Y104.00-10($1.6bln), Y104.50-55($2.1bln), Y104.95-105.00($1.1bln), Y105.95-106.00($1.2bln); Oct26 Y103.95-104.00($1.5bln-USD puts), Y106.95-107.00($1.6bln); Oct27 Y105.00($1.2bln); Oct28 Y105.00($1.1bln); Oct29 Y106.00($1.2bln); Oct30 Y104.50($1.9bln), Y106.00-05($1.9bln)
- EUR/GBP: Oct26 Gbp0.8900(E990mln), Gbp0.9000(E1.8bln-EUR puts)
- AUD/JPY: Oct22 Y76.44(A$2.1bln); Oct29 Y73.20(A$1.0bln-AUD puts), Y76.35-40(A$2.4bln-AUD calls)
- AUD/NZD: Oct27 N$1.0809-20(A$2.5bln); Oct30 N$1.0750(A$1.2bln)
Why MNI
MNI is the leading provider
of intelligence and analysis on the Global Fixed Income, Foreign Exchange and Energy markets. We use an innovative combination of real-time analysis, deep fundamental research and journalism to provide unique and actionable insights for traders and investors. Our "All signal, no noise" approach drives an intelligence service that is succinct and timely, which is highly regarded by our time constrained client base.Our Head Office is in London with offices in Chicago, Washington and Beijing, as well as an on the ground presence in other major financial centres across the world.