
Free Trial
Why MNI
MNI is the leading provider
of intelligence and analysis on the Global Fixed Income, Foreign Exchange and Energy markets. We use an innovative combination of real-time analysis, deep fundamental research and journalism to provide unique and actionable insights for traders and investors. Our "All signal, no noise" approach drives an intelligence service that is succinct and timely, which is highly regarded by our time constrained client base.Our Head Office is in London with offices in Chicago, Washington and Beijing, as well as an on the ground presence in other major financial centres across the world.
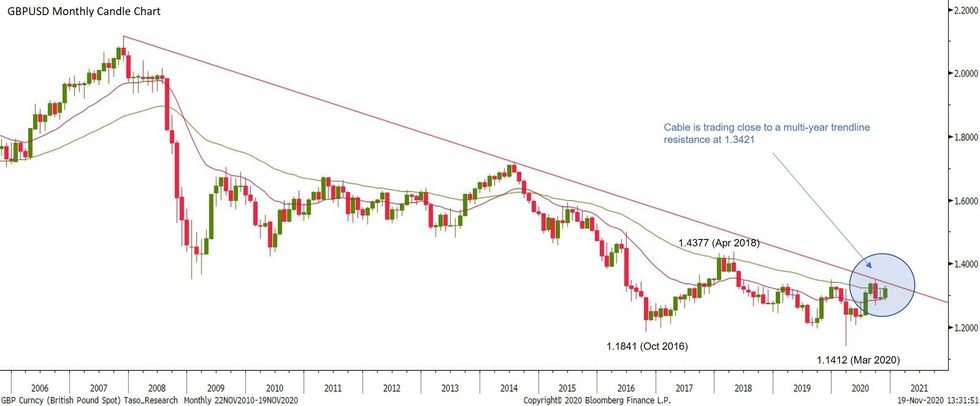
A look at long-term Sterling charts reveal some interesting price and trend features that may play a role in assessing price action over the medium-term.
- Cable is trading close to a trendline resistance drawn off the 2007 high that intersects at 1.3421. If the trendline is breached, it would certainly be a bullish development. However it would also be important to assess whether the break higher is down to USD weakness and/or Sterling strength to gauge the medium and even longer-term implications of a break. Cable is trading at 1.3221.
- A reversal lower with the trendline intact, would be a bearish outcome.
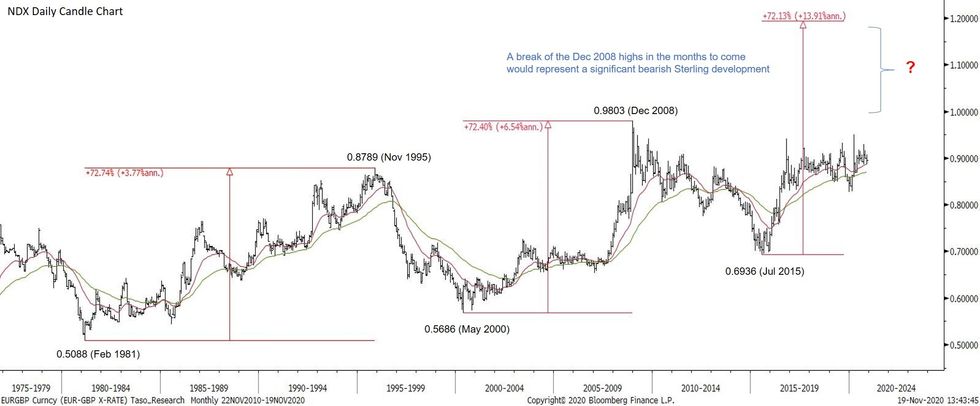
- The EURGBP chart is perhaps a concern for Sterling bulls. Looking at the bearish Sterling phases between 1981 - 1995 and 2000 - 2008, we note that the cross depreciated 72% on both occasions. Attention is on the current bear phase since the Jul 2015 low.
- A 72% depreciation would imply a move towards 1.2000. A break above the 2008 highs, if seen, would certainly highlight this potential risk. So, will history repeat itself?
Why MNI
MNI is the leading provider
of intelligence and analysis on the Global Fixed Income, Foreign Exchange and Energy markets. We use an innovative combination of real-time analysis, deep fundamental research and journalism to provide unique and actionable insights for traders and investors. Our "All signal, no noise" approach drives an intelligence service that is succinct and timely, which is highly regarded by our time constrained client base.Our Head Office is in London with offices in Chicago, Washington and Beijing, as well as an on the ground presence in other major financial centres across the world.
We are facing technical issues, please contact our team.
ok
Your request was sent sucessfully! Our team will contact you soon.
ok