
Why MNI
MNI is the leading provider
of intelligence and analysis on the Global Fixed Income, Foreign Exchange and Energy markets. We use an innovative combination of real-time analysis, deep fundamental research and journalism to provide unique and actionable insights for traders and investors. Our "All signal, no noise" approach drives an intelligence service that is succinct and timely, which is highly regarded by our time constrained client base.Our Head Office is in London with offices in Chicago, Washington and Beijing, as well as an on the ground presence in other major financial centres across the world.
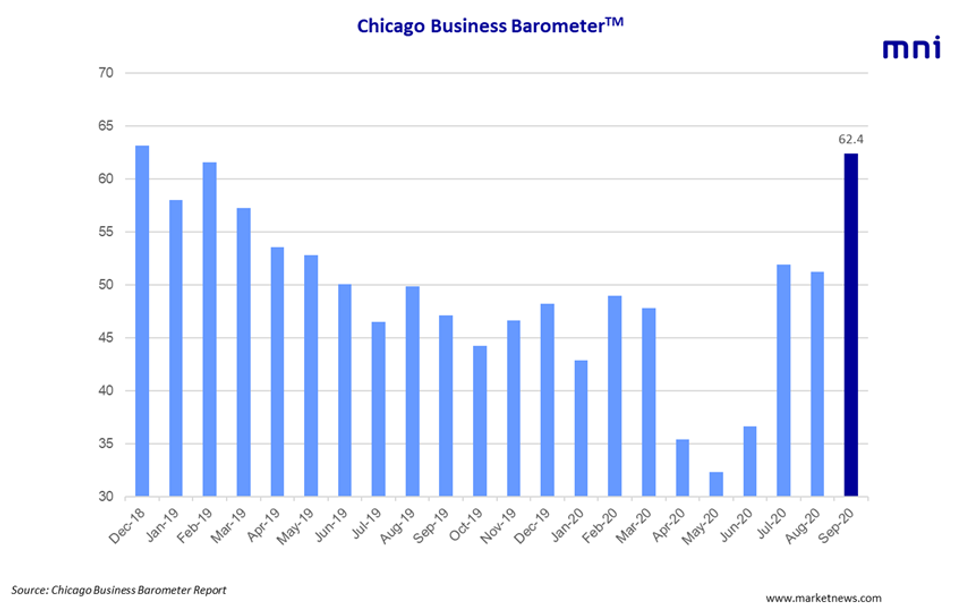
The Chicago Business Barometer rose sharply in September, beating market expectations that were looking for smaller uptick.
All five main indicators saw monthly gains in September, with Production and New Orders leading the way. On a quarterly basis, Supplier Deliveries was the only category to see a decline.
The headline index jumped to 62.4 in September, the highest level since December 2018, as business activity recovered across the board. Through Q3, business sentiment recovered sharply to 55.2, the strongest reading since Q1 2019.
Production recovered sharply in September, rising by 16.0 points to an almost two-year high of 67.9. Output jumped 29.2 points to 56.8 on a quarterly basis in Q3, while Demand gained 11.0 points in September, shifting the New Orders index up to 64.9, the highest level since November 2018. In Q3, New Orders saw the greatest uptick, rising by 32.0 points to 57.2.
Order Backlogs jumped 6.7 points in September to 52.9, while the quarterly index gained 16.7 points to touch 48.7, its highest level since Q1 2019. Inventories climbed to a four-month high of 47.8 in September, although the indicator has been stuck below the 50-mark since May.
JOBS
Despite the improvement in Employment to 45.7, firms continued to mention additional layoffs in September. Across Q3, the sub-index rose 8.1 points to 42.3. Supplier Deliveries edged up 2.8 points to 67.4, although Q3 dropped 9.2 points to 64.1 as Covid-19 related delays declined.
Prices paid at the factory gate leaped 9.7 points to 64.7. Companies noted increased costs for PPE, cleaning supplies and raw materials.
This month's special question asked: "Have your business costs changed during the crisis?". The majority, at 52.2%, reported an increase in business costs during the pandemic, while only 13.0% saw decreasing costs. Just over a third of respondents noted no changes in their expenses during the crisis.
The survey ran from September 1 to 15.
Why MNI
MNI is the leading provider
of intelligence and analysis on the Global Fixed Income, Foreign Exchange and Energy markets. We use an innovative combination of real-time analysis, deep fundamental research and journalism to provide unique and actionable insights for traders and investors. Our "All signal, no noise" approach drives an intelligence service that is succinct and timely, which is highly regarded by our time constrained client base.Our Head Office is in London with offices in Chicago, Washington and Beijing, as well as an on the ground presence in other major financial centres across the world.