
Why MNI
MNI is the leading provider
of intelligence and analysis on the Global Fixed Income, Foreign Exchange and Energy markets. We use an innovative combination of real-time analysis, deep fundamental research and journalism to provide unique and actionable insights for traders and investors. Our "All signal, no noise" approach drives an intelligence service that is succinct and timely, which is highly regarded by our time constrained client base.Our Head Office is in London with offices in Chicago, Washington and Beijing, as well as an on the ground presence in other major financial centres across the world.
HIGHLIGHTS:
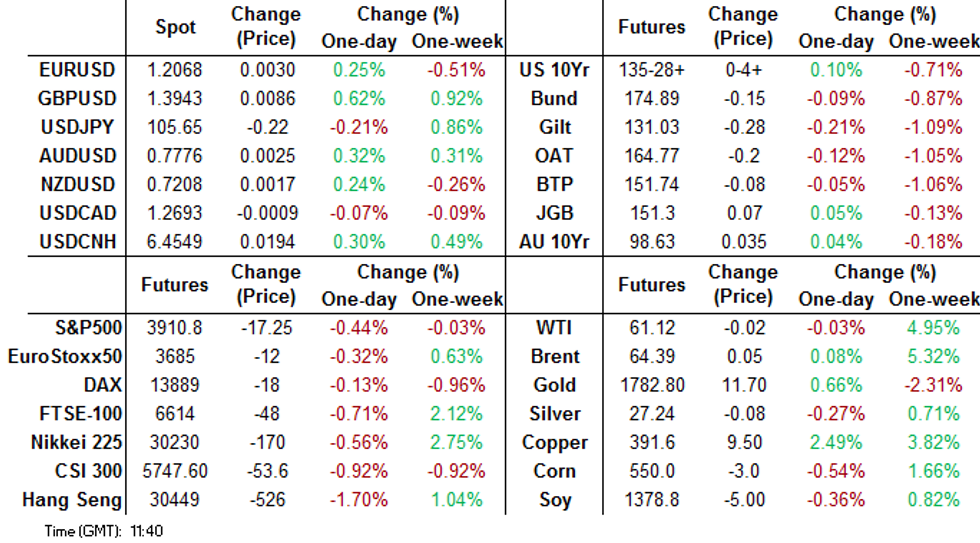
- Treasuries steady ahead of US jobless claims
- Greenback modestly weaker
- WTI RSI hits highest levels since 1990 oil price shock
US TSYS SUMMARY: Cautious Start, With Data Eyed
A cautious start to Thursday for Treasuries, with overnight gains slowly dissipating despite equities weakening in parallel.
- Mar 10-Yr futures (TY) up 3/32 at 135-27 (L: 135-26 / H: 136-02). Not much in the way of overnight drivers, with data eyed.
- Curve a little steeper: The 2-Yr yield is up 0.6bps at 0.1089%, 5-Yr is up 0.5bps at 0.5513%, 10-Yr is up 1.4bps at 1.2838%, and 30-Yr is up 2.2bps at 2.0586%.
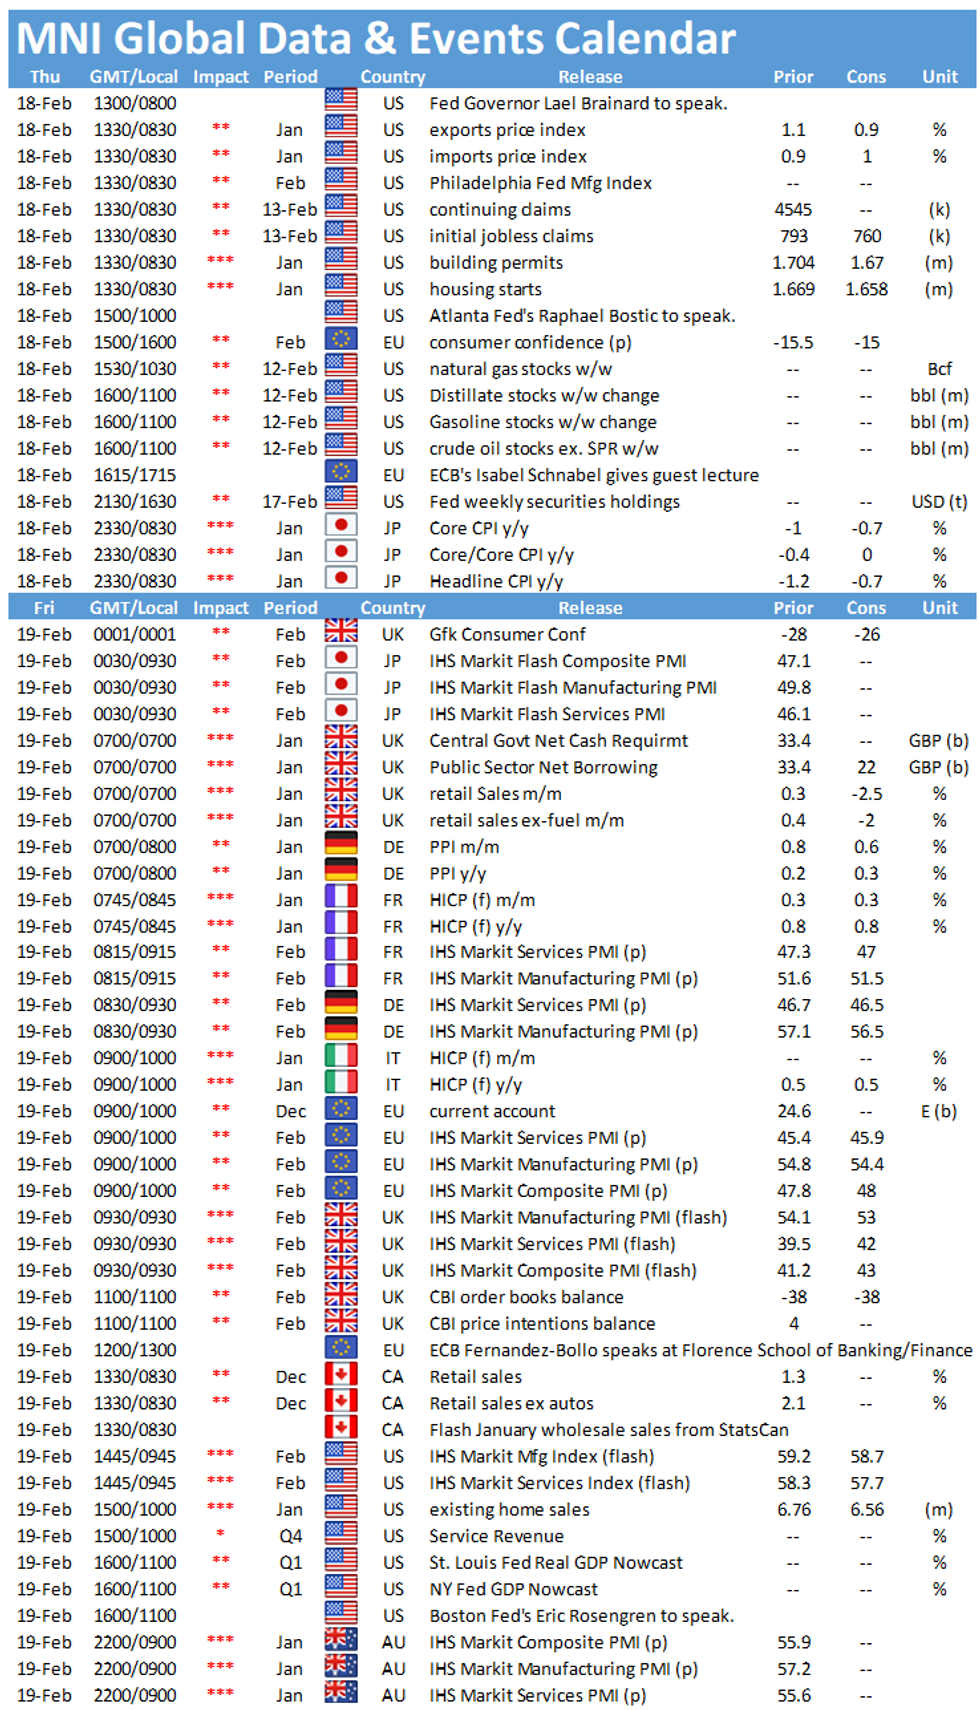
- Weekly jobless claims and Jan housing starts data feature at 0830ET, with Feb Philly Fed business outlook and Jan import/export prices as well.
- Fed Gov Brainard speaks at a climate summit at 0800ET, w Atlanta's Bostic speaking at 1000ET.
- In supply, $65B 4-/8-week bill auction at 1130ET, and $9B 30Y TIPS auction at 1300ET. NY Fed buys ~$6.025B of 4.5-7Y Tsys.
EGB/GILT SUMMARY: EGBs Broadly Weaker Despite Equities on Backfoot
European sovereign bonds have broadly traded weaker this morning with equities inching lower and the dollar on the backfoot against G10 FX.
- Gilts have sold off and have underperfomed EGBs. Cash yields are 2-4bp lower on the day with the curve bear steepening.
- Bunds have similarly traded weaker with the curve 1bp steeper. Last yields: 2-year -0.6953%, 5-year -0.6386%, 10-year -0.3507%, 30-year 0.1508%.
- OATs have slightly underperformed bunds on the day. There has been substantial nominal and linker supply this morning.
- BTP yields are 1-2bp higher with long-end spreads 1bp wider.
- Supply this morning came from France (OATs, EUR10.038bn; OATei/OATi, EUR1.656bn), Spain (Bonos/Oblis, EUR5.111bn) and Ireland (Bills, EUR0.75bn).
- The European data calendar was relatively light this morning.
EUROPE ISSUANCE: French & Spanish Auctions
France sells E10.038bln of MT OATs sold vs E9.5-10.5bln target
E4.340bln of 0% Feb-24 OAT
Ave yld -0.60% (-0.66%), bid-to-cover 2.33x (2.33x)
E2.658bln of 0% Feb-26 OAT
Ave yld -0.50% (-0.60%), bid-to-cover 2.60x (2.10x)
E3.040bln of 0.50% May-29 OAT
Ave yld -0.25% (-0.50%), bid-to-cover 1.87x (1.81x)
France Sells E1.656bln of OATei/OATi sold vs E1.25-1.75bln target
E883mln of 0.10% Mar-26 OATei
Ave yld -1.51% (-1.29%), bid-to-cover 2.44x (3.80x)
E275mln of 0.10% Mar-36 OATi
Ave yld -0.98% (-0.94%), bid-to-cover 3.58x (4.14x)
E498mln of 0.10% Jul-47 OATei
Ave yld -0.88% (-0.91%), bid-to-cover 2.24x (4.02x)
Spain sells E5.111bln of Bono/Obli vs E4.5-5.5bln target
E2.035bln of 0% May-24 Bono
Ave yld -0.410% (-0.458%), bid-to-cover 2.56x (2.09x)
E1.110bln of 0.80% Jul-27 Obli
Ave yld -0.121% (-0.254%), bid-to-cover 2.29x (1.91x)
E1.500bln of 0.10% Apr-31 Obli
Ave yld 0.271% (0.162%), bid-to-cover 2.12x (1.65x)
E0.46593bln of 4.90% Jul-40 Obli
Ave yld 0.752% (0.366%), bid-to-cover 3.75x
EUROPE OPTION FLOW SUMMARY
Eurozone:
RXJ1 173.5/175cs, bought for 24-24.5 in 25k
RXM1 170/174 RR, sold the call at 1 in 1k
UK:
3LZ1 99.00/98.62ps with 98.87/98.50ps, bought for 9.5 in 2.5k
3LZ1 99.00/98.87ps vs 99.75/99.87cs, bought the ps for 0.25 in ~9k
3LJ1 99.25p, bought for 2.5 in 2.5k
3LH1 99.62/99.75cs, bought for 2.5 in 3k
3LM1 99.87c, bought for 1.75 in 4k (ref 99.50, 11del)
3LM1 99.37/99.62 RR, bought the put for flat in 1k (ref 99.51)
US:
TYJ1 134/133ps, bought for '13 in 2k
FOREX: Greenback Bounce Hits Resistance, GBP Marches On
GBP/USD is staging a decent recovery from the Wednesday lows, with the pair bouncing close to a point since the Asia-Pac close. A generally weak dollar backdrop, twinned with persistent GBP vaccine-driven strength is contributing, with EUR/GBP's break to new multi-month lows a further catalyst.
Equities are a touch softer ahead of the US open, with the e-mini S&P off around 10 points to indicate a lower start at the opening bell today.
AUD initially rose as high as 0.7770 on labour market data was broadly in-line with estimates but the breakdown showed a lower participation rate and less hours worked, but a resumption of greenback weakness has propped the pair into the NY crossover.
Weekly US jobless claims, housing starts/building permits make up the data schedule Thursday, with Eurozone consumer confidence also due. Central bank speakers include BoE's Saunders, Fed's Brainard & Bostic.
OPTIONS: Expiries for Feb18 NY cut 1000ET (Source DTCC)
EUR/USD: $1.1800(E527mln), $1.1895-05(E859mln), $1.1940-41(E663mln), $1.2000-10(E2.0bln), $1.2050(E652mln), $1.2065-75(E1.1bln), $1.2080-85(E536mln), $1.2100(E1.3bln), $1.2125-35(E831mln), $1.2150-60(E811mln), $1.2200(E1.5bln), $1.2300(E910mln)
USD/JPY: Y104.50-70($826mln), Y104.95-00(E596mln), Y105.95-00($950mln), Y107.75($1bln)
GBP/USD: $1.3550-60(Gbp673mln)
EUR/GBP: Gbp0.8700(E546mln-EUR puts)
AUD/USD: $0.7400(A$1.2bln), $0.7575(A$851mln), $0.7700-10(A$674mln)
AUD/NZD: N$1.0735-40(A$720mln), N$1.0790(A$515mln), N$1.0820-30(A$769mln)
TECHS: Price Signal Summary - Bearish Engulfing Candle In EURJPY
- Equity indices outlook is unchanged and bullish, {US} E-mini S&P futures still target the 4000.00 handle.
- An initial objective is at 3988.40, 2.236 projection of the Sep 24 - Oct 12 - Oct 30 price swing last year.
- In the FX space, EURUSD traded lower yesterday. Tuesday's candle pattern, a shooting star formation, has defined a short-term top at 1.2169, Feb 16 high. Support to watch lies at 1.2020, Feb 8 low. EURJPY also appears to have defined a short-term top at yesterday's 128.46 high. A bearish engulfing candle yesterday suggests a corrective pullback is likely near-term. The next support is at 127.04, Feb 15 low. EURGBP downside extends with 0.8700 cleared. The April 2020 low has been breached, this opens 0.8646 next, the March 6, 2020 low.
- On the commodity front, Gold has cleared support at $1785.0, Feb 4 low. This confirms a resumption of the downtrend that started Jan 6 and opens $1764.8, Nov 30 low. Oil contracts remain firm. Brent (J1) targets $65.88 - 1.764 projection of the Apr - Aug - Nov 2020 price swing. WTI (H1) targets $63.17 - 1.618 projection of the Apr - Aug rally from the Nov 2 low.
- In the FI space, Bunds (H1) are likely to remain heavy. The focus is on 174.06, 2.00 projection of the Jan 4 - 12 sell-off from the Jan 27 high. Gilts (H1) remain in a downtrend and scope is for a move to 130.49, 2.764 projection of the Dec 11 - 24 sell-off from the Jan 4 high.
EQUITIES: Stocks Moderate as Risk Rally Hits Pause
Continental stock markets are moderately lower in early European hours, with losses of 0.1-0.3%. France's CAC-40 is very slightly underperforming, while German stocks are largely spared from the downside. Real estate and financials are among the poorest performers, while materials and tech names are providing some support.
Equity indices outlook is unchanged and bullish, E-mini S&P futures target the psychological 4000.00 handle. An initial objective is at 3988.40, 2.236 projection of the Sep 24 - Oct 12 - Oct 30 price swing last year.
Walmart Q4 earnings could take some focus later today, with the firm expected to post a decent rise in same store sales and e-commerce. The report crosses at 1200GMT/0700ET.
COMMODITIES: WTI RSI Hits Most Overbought Since 1990
WTI and Brent crude futures continue to poke higher, with new cycle highs posted in both contracts during Asia-Pac hours. This keeps the resolutely bullish trend in tact, but technical signals continue to flash overbought.
Early Thursday, WTI's Relative Strength Index hit its most overbought level for over 30 years, when 1990's oil price shock saw prices more than double over the course of a few months.
The NatGas rally has persisted, but prices seen at end-October remain resistance - $3.396.
Gold rebounded ahead of the late November lows of $1764.80, with yesterday's highs of $1795.10 providing the first upside target. Dollar weakness early Thursday is helped boost precious metals, although silver continues to lag.
Why MNI
MNI is the leading provider
of intelligence and analysis on the Global Fixed Income, Foreign Exchange and Energy markets. We use an innovative combination of real-time analysis, deep fundamental research and journalism to provide unique and actionable insights for traders and investors. Our "All signal, no noise" approach drives an intelligence service that is succinct and timely, which is highly regarded by our time constrained client base.Our Head Office is in London with offices in Chicago, Washington and Beijing, as well as an on the ground presence in other major financial centres across the world.