-
Policy
Policy
Exclusive interviews with leading policymakers that convey the true policy message that impacts markets.
LATEST FROM POLICY: -
EM Policy
EM Policy
Exclusive interviews with leading policymakers that convey the true policy message that impacts markets.
LATEST FROM EM POLICY: -
G10 Markets
G10 Markets
Real-time insight on key fixed income and fx markets.
Launch MNI PodcastsFixed IncomeFI Markets AnalysisCentral Bank PreviewsFI PiFixed Income Technical AnalysisUS$ Credit Supply PipelineGilt Week AheadGlobal IssuanceEurozoneUKUSDeep DiveGlobal Issuance CalendarsEZ/UK Bond Auction CalendarEZ/UK T-bill Auction CalendarUS Treasury Auction CalendarPolitical RiskMNI Political Risk AnalysisMNI Political Risk - US Daily BriefMNI Political Risk - The week AheadElection Previews -
Emerging Markets
Emerging Markets
Real-time insight of emerging markets in CEMEA, Asia and LatAm region
-
Commodities
Commodities
Real-time insight of oil & gas markets
-
Credit
Credit
Real time insight of credit markets
-
Data
-
Global Macro
Global Macro
Actionable insight on monetary policy, balance sheet and inflation with focus on global issuance. Analysis on key political risk impacting the global markets.
Global MacroDM Central Bank PreviewsDM Central Bank ReviewsEM Central Bank PreviewsEM Central Bank ReviewsBalance Sheet AnalysisData AnalysisEurozone DataUK DataUS DataAPAC DataInflation InsightEmployment InsightGlobal IssuanceEurozoneUKUSDeep DiveGlobal Issuance Calendars EZ/UK Bond Auction Calendar EZ/UK T-bill Auction Calendar US Treasury Auction Calendar Chart Packs -
About Us
To read the full story
Sign up now for free trial access to this content.
Please enter your details below.
Why MNI
MNI is the leading provider
of intelligence and analysis on the Global Fixed Income, Foreign Exchange and Energy markets. We use an innovative combination of real-time analysis, deep fundamental research and journalism to provide unique and actionable insights for traders and investors. Our "All signal, no noise" approach drives an intelligence service that is succinct and timely, which is highly regarded by our time constrained client base.Our Head Office is in London with offices in Chicago, Washington and Beijing, as well as an on the ground presence in other major financial centres across the world.
Real-time Actionable Insight
Get the latest on Central Bank Policy and FX & FI Markets to help inform both your strategic and tactical decision-making.
Free AccessTechnical Analysis: CZKHUF Breaking Below Its 200D SMA
- USDCZK stabilizes slightly below the 21 level after a strong bearish momentum since the start of April; next support to watch on the downside stands at 20.35 (April 2018 low). On the topside, first resistance stands now at 21, followed by 21.56 (100D SMA).
- EURCZK ticks lower today after failing to break its 25.50 resistance last week; next support to watch on the downside stands at 25.27 (March 2020 lows). On the topside, next resistance to watch above 25.50 stands at 25.80, followed by 25.86 (50D SMA).
- GBPCZK retraces lower this morning, falling below the 29.50 level; first support to watch on the downside stands at 29.22, followed by 29. On the topside, first resistance stands at 29.66 (200D SMA), followed by 29.86 (100D SMA).
- CZKJPY is trending again this morning after consolidating to 5.20 last week; key support to watch on the topside stands at 5.26 (April 2018), followed by 5.46, which represents the early February 2018 high (when liquidity reached its peak in the EM market). On the downside, ST support stands at 5.20, followed by 5.15.
- CZKPLN has been trending higher in the past two days after finding a local low of 0.1760 on Thursday; next resistance to watch on the topside stands at 0.1791 (March 30 high), a break above that level would open the door for a move up to 0.1834, which represents the pair's all time high. On the downside, first support to watch stand at 0.1752 (100D SMA), followed by 0.1740.
- CZKRUB has been trading sideways in the past week, oscillating around 3.53. Supports to watch on the downside stand at 3.47 (100D SMA), followed by 3.43 (200D SMA); on the topside, key resistance remains at 3.60, which represents the pair's all-time high.
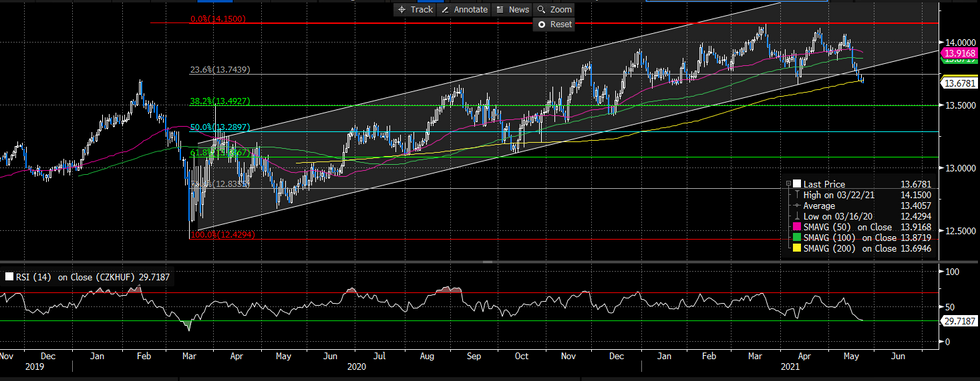
- CZKHUF keeps testing new lows amid HUF strength, with the pair breaking below its 200D SMA at 13.69 this morning; next support level stands at 13.50, which represents the 38.2% Fibo retracement of the 12.43 – 14.15 range (2020/2021 low high range), followed by 13.36. ON the topside, first resistance stands at 13.88 (100D SMA), followed by 13.92 (50D SMA). RSI 14 days is currently showing that the pair is slightly 'oversold'. (chart below)

Source: Bloomberg/MNI
To read the full story
Sign up now for free trial access to this content.
Please enter your details below.
Why MNI
MNI is the leading provider
of intelligence and analysis on the Global Fixed Income, Foreign Exchange and Energy markets. We use an innovative combination of real-time analysis, deep fundamental research and journalism to provide unique and actionable insights for traders and investors. Our "All signal, no noise" approach drives an intelligence service that is succinct and timely, which is highly regarded by our time constrained client base.Our Head Office is in London with offices in Chicago, Washington and Beijing, as well as an on the ground presence in other major financial centres across the world.
