
Free Trial
Why MNI
MNI is the leading provider
of intelligence and analysis on the Global Fixed Income, Foreign Exchange and Energy markets. We use an innovative combination of real-time analysis, deep fundamental research and journalism to provide unique and actionable insights for traders and investors. Our "All signal, no noise" approach drives an intelligence service that is succinct and timely, which is highly regarded by our time constrained client base.Our Head Office is in London with offices in Chicago, Washington and Beijing, as well as an on the ground presence in other major financial centres across the world.
TWD
USD/TWD has tracked within recent ranges during today's session, the pair last around 31.835. Recent lows rest at ~31.74, while highs from mid August near 32.00 haven't been threatened. It's a similar backdrop for the 1 month NDF, which last sits close to 31.74.
- Local equities are doing better today, but only at the margin (+0.25%), after last Friday's -1.72% correction, which also coincided with more than $1bn in offshore outflows. This didn't impact currency sentiment a great deal on Friday though.
- Equity outflows for August sit near -$4.7bn, the largest monthly outflow since October last year.
- Coming up we have the July monitoring indicator, which is a composite measure of important variables for the economy, like export orders, stock prices, payrolls, IP etc (see this link for more details).
- The index has been on the improve but from a low base, the chart below plots the monitoring indicator (inverted on the chart) versus USD/TWD. An improved monitoring trend should be better for TWD all else equal but there is somewhat of a levels difference at present between the two series.
Fig 1: USD/TWD Versus Monitoring Indicator
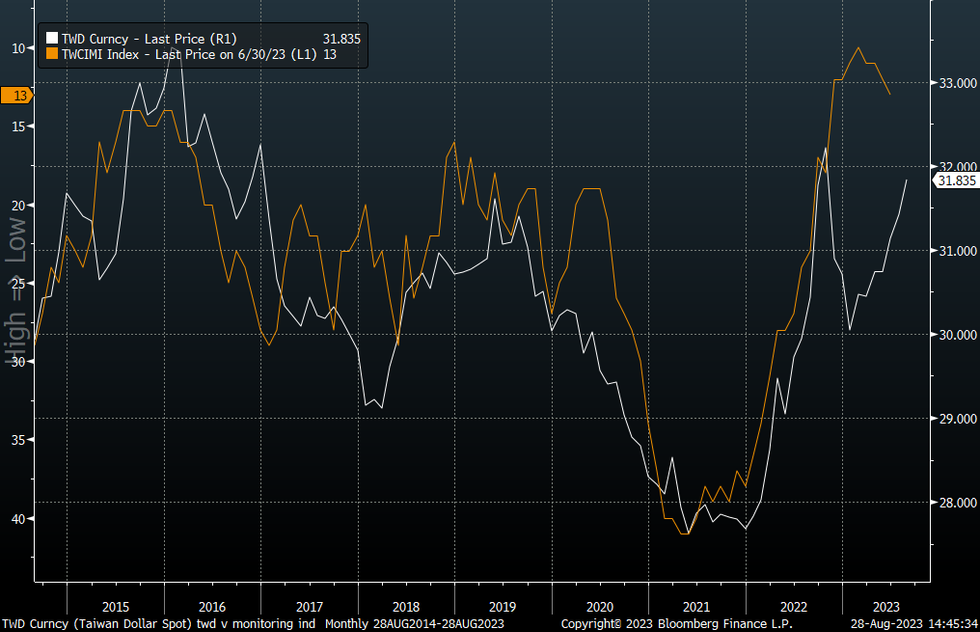
Source: MNI - Market News/Bloomberg
Why MNI
MNI is the leading provider
of intelligence and analysis on the Global Fixed Income, Foreign Exchange and Energy markets. We use an innovative combination of real-time analysis, deep fundamental research and journalism to provide unique and actionable insights for traders and investors. Our "All signal, no noise" approach drives an intelligence service that is succinct and timely, which is highly regarded by our time constrained client base.Our Head Office is in London with offices in Chicago, Washington and Beijing, as well as an on the ground presence in other major financial centres across the world.
We are facing technical issues, please contact our team.
ok
Your request was sent sucessfully! Our team will contact you soon.
ok