
Free Trial
Why MNI
MNI is the leading provider
of intelligence and analysis on the Global Fixed Income, Foreign Exchange and Energy markets. We use an innovative combination of real-time analysis, deep fundamental research and journalism to provide unique and actionable insights for traders and investors. Our "All signal, no noise" approach drives an intelligence service that is succinct and timely, which is highly regarded by our time constrained client base.Our Head Office is in London with offices in Chicago, Washington and Beijing, as well as an on the ground presence in other major financial centres across the world.
COMMODITIES
- Investors have been questioning if the trend in commodity prices could persist in the medium term as global demand keeps weakening and a growing range of ‘fundamental’ indicators keep pricing in ‘cheaper’ commodities. that the sharp.
- We have seen that commodity prices have been constantly reaching new highs despite China imports plunging in recent months.
- As China represents over 50% of the total demand for some commodities (i.e. copper), the two times series have historically strongly co-moved together in the past 20 years.
- The chart below shows that the sharp decrease in the annual change in ‘liquidity’ (G4 CB assets) has been also pricing in ‘cheaper’ commodities in the coming months.
- Significant changes in central banks’ total assets have strongly led commodity prices in the past cycle (by 9 months).
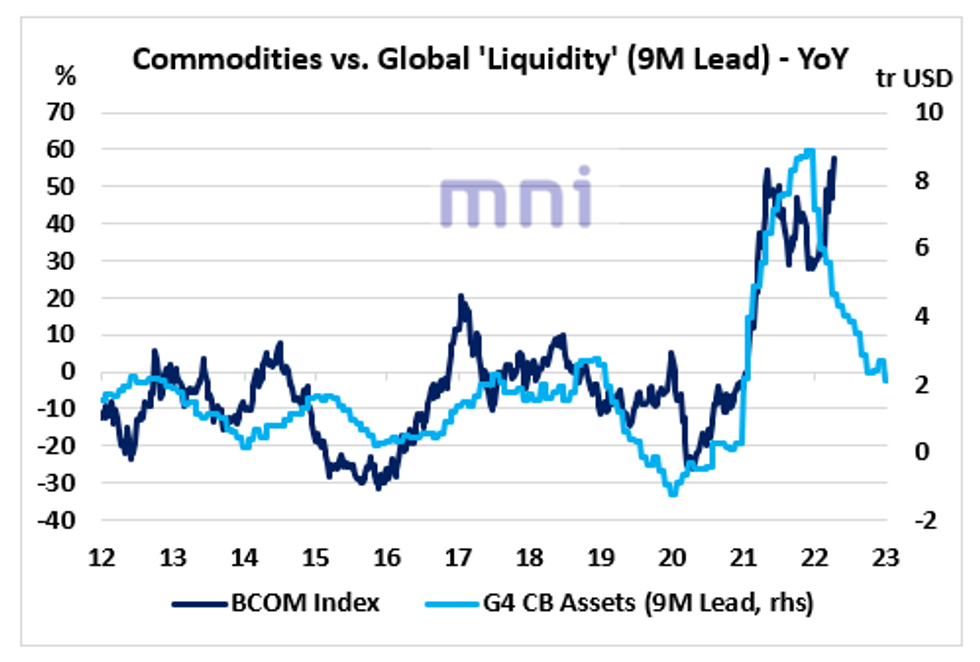
Source: Bloomberg/MNI..
Why MNI
MNI is the leading provider
of intelligence and analysis on the Global Fixed Income, Foreign Exchange and Energy markets. We use an innovative combination of real-time analysis, deep fundamental research and journalism to provide unique and actionable insights for traders and investors. Our "All signal, no noise" approach drives an intelligence service that is succinct and timely, which is highly regarded by our time constrained client base.Our Head Office is in London with offices in Chicago, Washington and Beijing, as well as an on the ground presence in other major financial centres across the world.
We are facing technical issues, please contact our team.
ok
Your request was sent sucessfully! Our team will contact you soon.
ok