-
Policy
Policy
Exclusive interviews with leading policymakers that convey the true policy message that impacts markets.
LATEST FROM POLICY: -
EM Policy
EM Policy
Exclusive interviews with leading policymakers that convey the true policy message that impacts markets.
LATEST FROM EM POLICY: -
G10 Markets
G10 Markets
Real-time insight on key fixed income and fx markets.
Launch MNI PodcastsFixed IncomeFI Markets AnalysisCentral Bank PreviewsFI PiFixed Income Technical AnalysisUS$ Credit Supply PipelineGilt Week AheadGlobal IssuanceEurozoneUKUSDeep DiveGlobal Issuance CalendarsEZ/UK Bond Auction CalendarEZ/UK T-bill Auction CalendarUS Treasury Auction CalendarPolitical RiskMNI Political Risk AnalysisMNI Political Risk - US Daily BriefMNI Political Risk - The week AheadElection Previews -
Emerging Markets
Emerging Markets
Real-time insight of emerging markets in CEMEA, Asia and LatAm region
-
Commodities
-
Credit
Credit
Real time insight of credit markets
-
Data
-
Global Macro
Global Macro
Actionable insight on monetary policy, balance sheet and inflation with focus on global issuance. Analysis on key political risk impacting the global markets.
Global MacroDM Central Bank PreviewsDM Central Bank ReviewsEM Central Bank PreviewsEM Central Bank ReviewsBalance Sheet AnalysisData AnalysisEurozone DataUK DataUS DataAPAC DataInflation InsightEmployment InsightGlobal IssuanceEurozoneUKUSDeep DiveGlobal Issuance Calendars EZ/UK Bond Auction Calendar EZ/UK T-bill Auction Calendar US Treasury Auction Calendar Global Macro Weekly -
About Us
To read the full story
Sign up now for free trial access to this content.
Please enter your details below.
Why MNI
MNI is the leading provider
of intelligence and analysis on the Global Fixed Income, Foreign Exchange and Energy markets. We use an innovative combination of real-time analysis, deep fundamental research and journalism to provide unique and actionable insights for traders and investors. Our "All signal, no noise" approach drives an intelligence service that is succinct and timely, which is highly regarded by our time constrained client base.Our Head Office is in London with offices in Chicago, Washington and Beijing, as well as an on the ground presence in other major financial centres across the world.
Real-time Actionable Insight
Get the latest on Central Bank Policy and FX & FI Markets to help inform both your strategic and tactical decision-making.
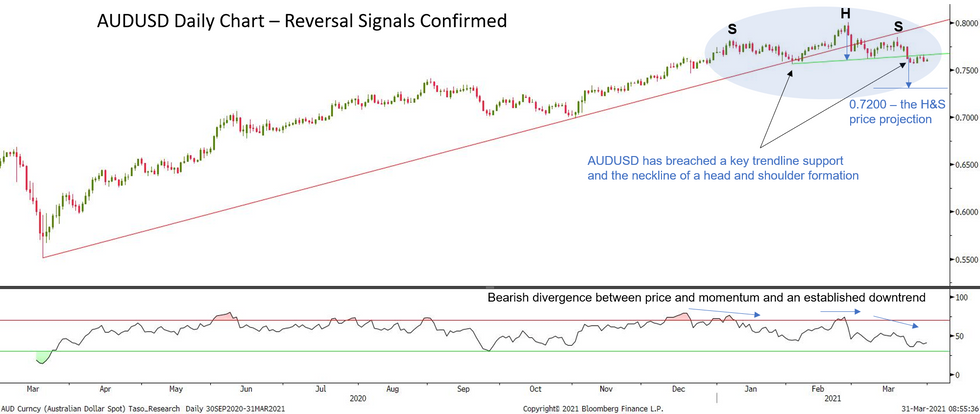
Free AccessAUDUSD Reversal Patterns Confirmed
The USD is in a clear uptrend. The AUDUSD technical picture reflects this theme and recent price developments suggest the Aussie is likely to depreciate near-term. The key technical features are:
- On Feb 26, the pair confirmed a break of a trendline support that had been in place since Mar 19, 2020. This highlighted the first reversal threat of the 11 1/2 - month uptrend.
- Selling pressure on Mar 23 highlighted a second reversal signal. This time price breached what appears to be a neckline of a head and shoulders (H&S) reversal pattern. The neckline is the trendline that connects the two price points (lows) that represent the left and right shoulders of the pattern. Furthermore, price action since the break has remained below the neckline and the neckline is providing resistance.
- Momentum studies have also recently highlighted a reversal threat - a condition known as bearish divergence between price and momentum started mid-December. The recent trendline break and the H&S reversal confirms this threat and it appears that momentum as highlighted by the 14 day RSI, is trending down. This reinforces bearish conditions.
- The H&S pattern also provides a price projection based on the height of the pattern. In this instance it is 0.7200. Ahead of this level there are a number of possible support levels / objectives:
- 0.7418 23.6% retracement of the Mar 2020 - Feb rally.
- 0.7272 1.50 projection of the Jan 25 - Mar 5 - Mar 18 downleg.
- Key resistance has been defined at 0.7849, Mar 18 high. This also represents the top of the right shoulder, where a break is required to negate the reversal pattern. Initial resistance levels are:
- 0.7664 High Mar 30 and resistance highlighted by the neckline.
- 0.7750 Mar 23 high.

To read the full story
Sign up now for free trial access to this content.
Please enter your details below.
Why MNI
MNI is the leading provider
of intelligence and analysis on the Global Fixed Income, Foreign Exchange and Energy markets. We use an innovative combination of real-time analysis, deep fundamental research and journalism to provide unique and actionable insights for traders and investors. Our "All signal, no noise" approach drives an intelligence service that is succinct and timely, which is highly regarded by our time constrained client base.Our Head Office is in London with offices in Chicago, Washington and Beijing, as well as an on the ground presence in other major financial centres across the world.
