-
Policy
Policy
Exclusive interviews with leading policymakers that convey the true policy message that impacts markets.
LATEST FROM POLICY: -
EM Policy
EM Policy
Exclusive interviews with leading policymakers that convey the true policy message that impacts markets.
LATEST FROM EM POLICY: -
G10 Markets
G10 Markets
Real-time insight on key fixed income and fx markets.
Launch MNI PodcastsFixed IncomeFI Markets AnalysisCentral Bank PreviewsFI PiFixed Income Technical AnalysisUS$ Credit Supply PipelineGilt Week AheadGlobal IssuanceEurozoneUKUSDeep DiveGlobal Issuance CalendarsEZ/UK Bond Auction CalendarEZ/UK T-bill Auction CalendarUS Treasury Auction CalendarPolitical RiskMNI Political Risk AnalysisMNI Political Risk - US Daily BriefMNI Political Risk - The week AheadElection Previews -
Emerging Markets
Emerging Markets
Real-time insight of emerging markets in CEMEA, Asia and LatAm region
-
Commodities
-
Credit
Credit
Real time insight of credit markets
-
Data
-
Global Macro
Global Macro
Actionable insight on monetary policy, balance sheet and inflation with focus on global issuance. Analysis on key political risk impacting the global markets.
Global MacroDM Central Bank PreviewsDM Central Bank ReviewsEM Central Bank PreviewsEM Central Bank ReviewsBalance Sheet AnalysisData AnalysisEurozone DataUK DataUS DataAPAC DataInflation InsightEmployment InsightGlobal IssuanceEurozoneUKUSDeep DiveGlobal Issuance Calendars EZ/UK Bond Auction Calendar EZ/UK T-bill Auction Calendar US Treasury Auction Calendar Global Macro Weekly -
About Us
To read the full story
Sign up now for free trial access to this content.
Please enter your details below.
Why MNI
MNI is the leading provider
of intelligence and analysis on the Global Fixed Income, Foreign Exchange and Energy markets. We use an innovative combination of real-time analysis, deep fundamental research and journalism to provide unique and actionable insights for traders and investors. Our "All signal, no noise" approach drives an intelligence service that is succinct and timely, which is highly regarded by our time constrained client base.Our Head Office is in London with offices in Chicago, Washington and Beijing, as well as an on the ground presence in other major financial centres across the world.
Real-time Actionable Insight
Get the latest on Central Bank Policy and FX & FI Markets to help inform both your strategic and tactical decision-making.
Free AccessCan The US Inflation/Growth Mix Turn More Constructive For Risk Assets?
US data this week leaned better than expected, particularly the upward revision to the final PMI reading for August, and the resilient ISM. As noted earlier this week, weakness in key North Asia economies painted downside risks to these outcomes. This backdrop continues to favour the USD from a relative growth standpoint. Still, there were some encouraging signs from a broader risk appetite standpoint.
- Most notably was the sharp decline in the prices paid in the ISM survey (52.5 versus 55.3 expected and 60.0 in July). This is the lowest level for this sub-index since the middle of 2020.
- It also fits with some downside momentum in the Cleveland Fed Nowcaster for headline CPI. The MoM Nowcaster for this index is now close to flat, while at 8.24% for the YoY estimate. This is down from recent highs.
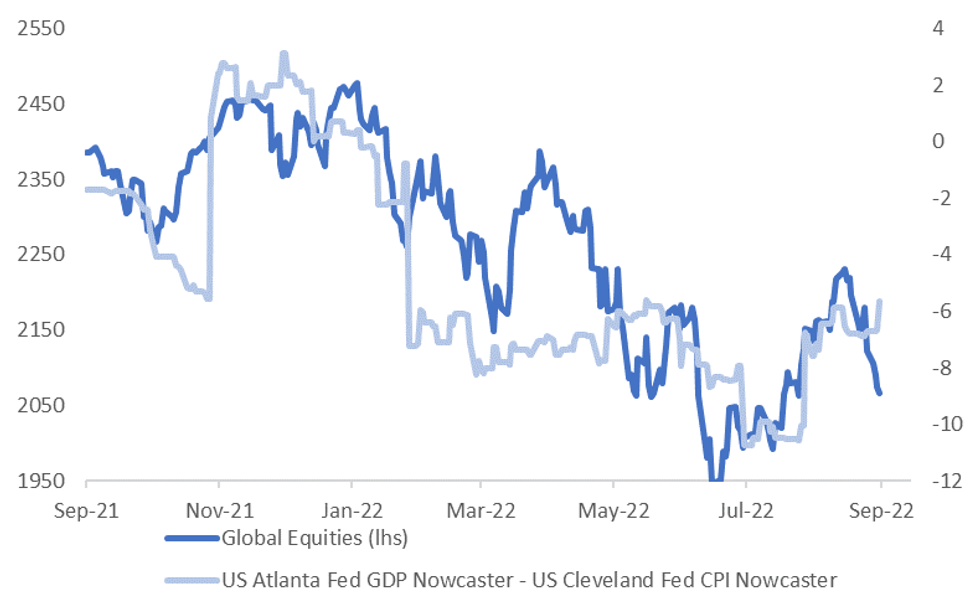
- The first chart below plots the differential between the Atlanta Fed GDP Nowcaster less the Cleveland Fed CPI (YoY) Nowcaster. This metric is a very rough stagflation proxy for the US economy on a relatively high frequency basis. The other line on the chart is global equities.
- Essentially, as US inflation outcomes/expectations have outpaced GDP growth, global equities have typically fallen this year. Hiking Fed policy is obviously a key driver of this trend. While the relationship in the chart below is by no means perfect, the correlation is reasonable for 2022 at +64%.
Fig 1: Global Equities & US Stagflation Proxy
 Source: Atlanta Fed/Cleveland Fed/MNI - Market News/Bloomberg
- If the current relationship continues to hold, it points to risks of an improvement in the global equity backdrop. That is, if we see the inflation nowcaster continuing to come down relative to the GDP nowcaster or vice versa. Although presumably, the biggest shift can come from the inflation backdrop.
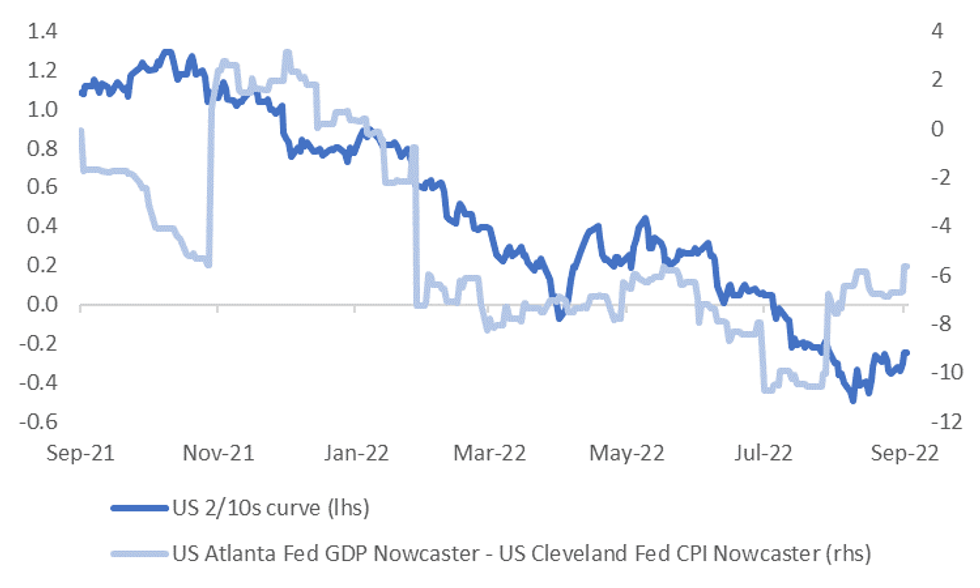
- A better inflation/growth backdrop also argues for a steeper curve US curve, see the second chart below, which arguably fits with the inflation side of equation having the greater potential to move more over coming months.
- For the USD, the relationship with the stagflation proxy is generally inverse, that is worst readings for the proxy have generally correlated with higher USD levels this year, although the correlation isn't as strong as the equivalent with global equities.
- Of course, the Fed will likely have final say on how things unfold. A clear caveat is that even if inflation moderates it may still feel the need to be quite aggressive given the high starting point for price pressures.
- The other potential headwind is growth prospects outside of the US, with China’s Covid related policies a likely constraint on China’s rebound prospects, while the EU growth backdrop is far from assured.
Fig 2: US 2/10s & US Stagflation Proxy
 Source: Atlanta Fed/Cleveland Fed/MNI - Market News/Bloomberg
To read the full story
Sign up now for free trial access to this content.
Please enter your details below.
Why MNI
MNI is the leading provider
of intelligence and analysis on the Global Fixed Income, Foreign Exchange and Energy markets. We use an innovative combination of real-time analysis, deep fundamental research and journalism to provide unique and actionable insights for traders and investors. Our "All signal, no noise" approach drives an intelligence service that is succinct and timely, which is highly regarded by our time constrained client base.Our Head Office is in London with offices in Chicago, Washington and Beijing, as well as an on the ground presence in other major financial centres across the world.
