
Free Trial
Why MNI
MNI is the leading provider
of intelligence and analysis on the Global Fixed Income, Foreign Exchange and Energy markets. We use an innovative combination of real-time analysis, deep fundamental research and journalism to provide unique and actionable insights for traders and investors. Our "All signal, no noise" approach drives an intelligence service that is succinct and timely, which is highly regarded by our time constrained client base.Our Head Office is in London with offices in Chicago, Washington and Beijing, as well as an on the ground presence in other major financial centres across the world.
CHINA DATA
China headline inflation came in as expected, 2.1% y/y. There was a decent 0.8% rise in m/m terms. The core measures improved, albeit from depressed levels. Non-food rose 1.2% y/y, only a slight uptick from Dec (1.1%). Core (ex food & energy) saw a bigger lift to 1.0% y/y (from 0.7%). This core measure is now back to highs from mid last year, but still down from pre Covid levels (1.50-2.00%).
- The first chart below plots the core inflation metric against the 2yr China government bond yield. There was also other evidence that the worst of the disinflation pulse was behind us. 7 out of 8 sub-categories saw firmer prints in Jan relative to Dec in y/y terms.
- One month doesn't make a trend, but at the margin this may complicate calls for more monetary policy easing.
Fig 1: China Core Inflation Versus 2yr Government Bond Yield
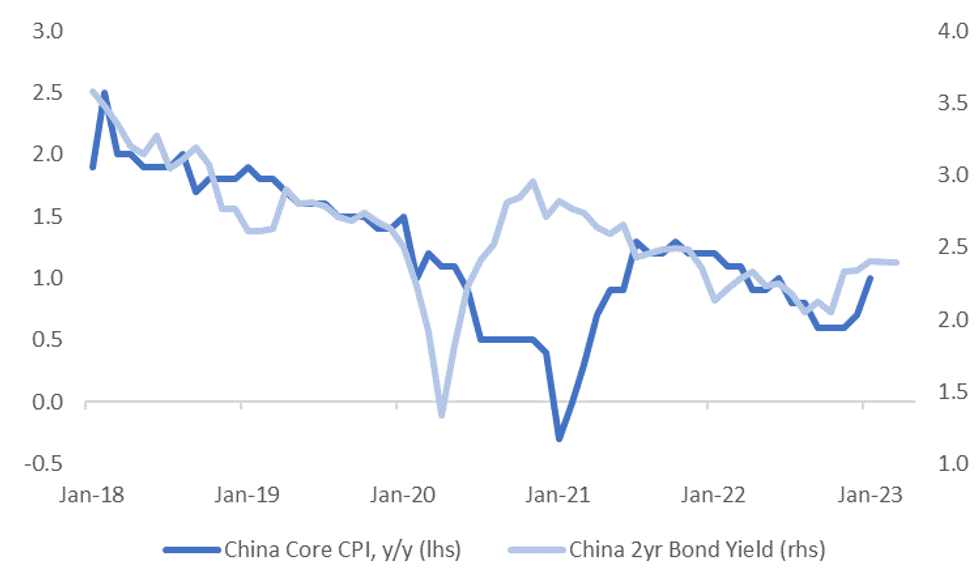
Source: MNI - Market News/Bloomberg
- On the PPI side, we saw a slight downside miss (-0.8% y/y, versus -0.7% expected). Raw materials slipped back into disinflation -0.1% y/y (from 1.2%), while consumer goods inflation eased slightly to 1.5% y/y, from 1.8% prior.
- The second chart below overlays the PPI y/y, 6 months forward, versus y/y changes in the CNY NEER.
Fig 2: CNY NEER Y/Y Versus China PPI Y/Y
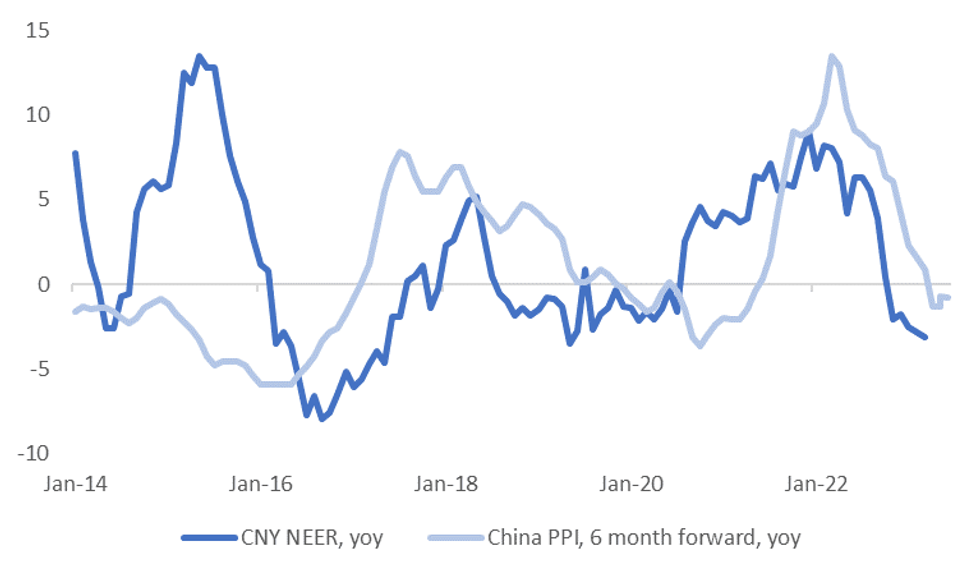
Source: MNI - Market News/Bloomberg
Why MNI
MNI is the leading provider
of intelligence and analysis on the Global Fixed Income, Foreign Exchange and Energy markets. We use an innovative combination of real-time analysis, deep fundamental research and journalism to provide unique and actionable insights for traders and investors. Our "All signal, no noise" approach drives an intelligence service that is succinct and timely, which is highly regarded by our time constrained client base.Our Head Office is in London with offices in Chicago, Washington and Beijing, as well as an on the ground presence in other major financial centres across the world.
We are facing technical issues, please contact our team.
ok
Your request was sent sucessfully! Our team will contact you soon.
ok