
Free Trial
Why MNI
MNI is the leading provider
of intelligence and analysis on the Global Fixed Income, Foreign Exchange and Energy markets. We use an innovative combination of real-time analysis, deep fundamental research and journalism to provide unique and actionable insights for traders and investors. Our "All signal, no noise" approach drives an intelligence service that is succinct and timely, which is highly regarded by our time constrained client base.Our Head Office is in London with offices in Chicago, Washington and Beijing, as well as an on the ground presence in other major financial centres across the world.
SWEDEN
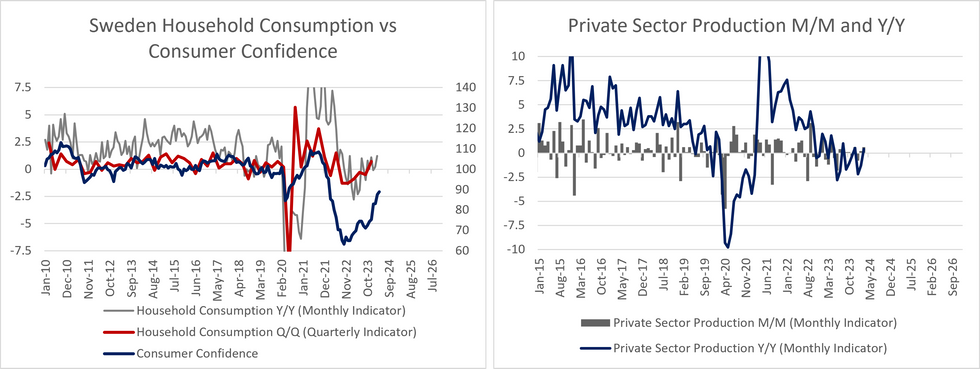
Overall, the March activity data sheds little light on what drove the weak Q1 flash GDP release. Household consumption and private sector production both rose on a M/M and Y/Y basis in March. This comes after the March monthly GDP indicator printed at -0.3% M/M and -1.1% Y/Y, which helped pull the flash Q1 GDP estimate down to -0.1% Q/Q and -1.1% Y/Y – below consensus expectations and the Riksbank’s forecasts.
- The monthly GDP indicators and flash quarterly estimates are often revised – the latter sometimes heavily – so it is hard to read too much into the data at this stage. However, the activity data could suggest scope for an upward revision to the quarterly estimate.
- A reminder that the flash quarterly estimate contains no details on the sub-components of GDP.
- The domestic activity data may also suggest that the GDP indicator’s weakness in March may have been driven by non-domestic components (i.e net trade). However, real import/export data up to February indicates a net trade surplus for the first two months Q1. Information on March’s real trade figures will be released on May 28, two days before the final Q1 GDP estimate.
- For the quarterly reading, we note that the Government’s primary balance was in surplus through January-March, which will have contributed to the downside re: the Q1 GDP estimate.
- Household consumption rose 0.5% M/M (vs -0.2% prior) and 1.2% Y/Y (vs 0.2% prior). Both of February’s monthly and annual values saw upward revisions.
- Meanwhile, private sector production rose 0.6% M/M (vs 0.2% prior) and 0.4% Y/Y (vs -1.3% prior), with February’s monthly and annual values seeing downward revisions.
Why MNI
MNI is the leading provider
of intelligence and analysis on the Global Fixed Income, Foreign Exchange and Energy markets. We use an innovative combination of real-time analysis, deep fundamental research and journalism to provide unique and actionable insights for traders and investors. Our "All signal, no noise" approach drives an intelligence service that is succinct and timely, which is highly regarded by our time constrained client base.Our Head Office is in London with offices in Chicago, Washington and Beijing, as well as an on the ground presence in other major financial centres across the world.
We are facing technical issues, please contact our team.
ok
Your request was sent sucessfully! Our team will contact you soon.
ok