
Free Trial
Why MNI
MNI is the leading provider
of intelligence and analysis on the Global Fixed Income, Foreign Exchange and Energy markets. We use an innovative combination of real-time analysis, deep fundamental research and journalism to provide unique and actionable insights for traders and investors. Our "All signal, no noise" approach drives an intelligence service that is succinct and timely, which is highly regarded by our time constrained client base.Our Head Office is in London with offices in Chicago, Washington and Beijing, as well as an on the ground presence in other major financial centres across the world.
ITALY DATA
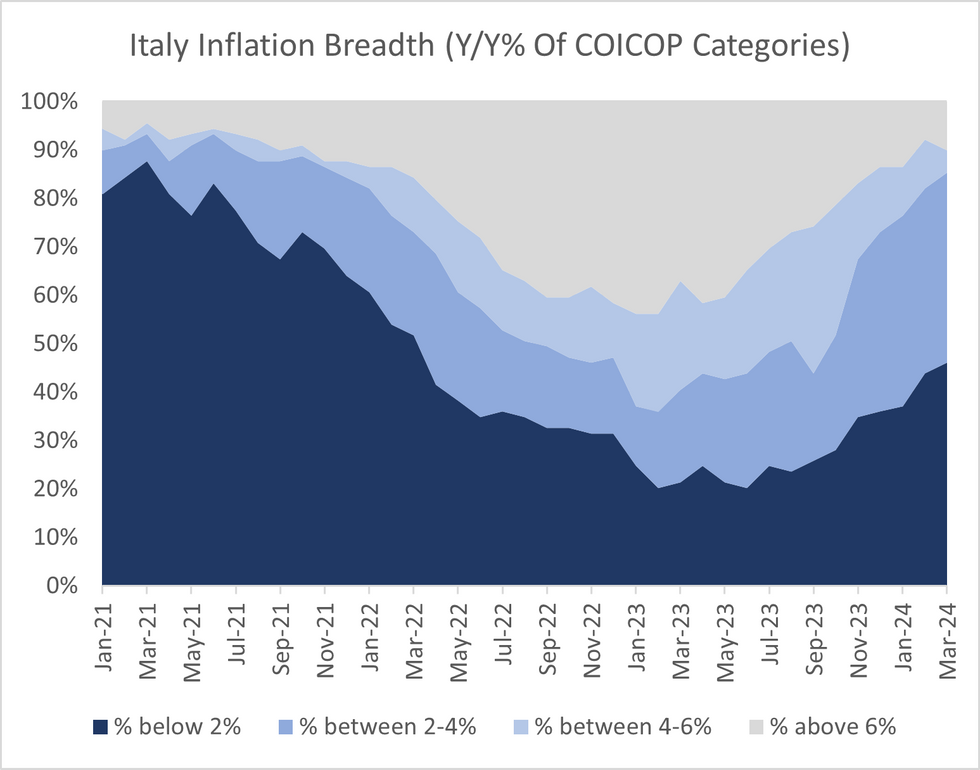
Italian inflation breadth saw a minor improvement in March, even as fading energy base effects and sticky services inflation pushed headline HICP to 1.2% (vs 0.8% prior).
- The share of subcomponents with annual inflation rates above 2% fell to 54% (vs 56% prior).
- ISTAT does not produce index values for the most granular HICP categories, meaning the breadth calculation is based on just 89 components.
- In March, 9 subcomponents had annual rates above 6% Y/Y (vs 7 in Feb), 4 subcomponents had rates between 4-6% Y/Y (vs 9 in Feb) while 35 were between 2-4% Y/Y (vs 34 in Feb).
- The final March data saw annual HICP revised down from an initial 1.3% Y/Y. This was primarily due to processed foods inflation being revised down 2.8% Y/Y (vs 3.3% flash) and unprocessed food to 2.8% Y/Y (vs 3.0% flash).
Why MNI
MNI is the leading provider
of intelligence and analysis on the Global Fixed Income, Foreign Exchange and Energy markets. We use an innovative combination of real-time analysis, deep fundamental research and journalism to provide unique and actionable insights for traders and investors. Our "All signal, no noise" approach drives an intelligence service that is succinct and timely, which is highly regarded by our time constrained client base.Our Head Office is in London with offices in Chicago, Washington and Beijing, as well as an on the ground presence in other major financial centres across the world.
We are facing technical issues, please contact our team.
ok
Your request was sent sucessfully! Our team will contact you soon.
ok