
Why MNI
MNI is the leading provider
of intelligence and analysis on the Global Fixed Income, Foreign Exchange and Energy markets. We use an innovative combination of real-time analysis, deep fundamental research and journalism to provide unique and actionable insights for traders and investors. Our "All signal, no noise" approach drives an intelligence service that is succinct and timely, which is highly regarded by our time constrained client base.Our Head Office is in London with offices in Chicago, Washington and Beijing, as well as an on the ground presence in other major financial centres across the world.
Equities Take a Turn For the Worse as Risks to Rally Mount
Equities in Europe started the session poorly and the US followed suit, with the three major indices all falling as much as 3% as a burst of equity negative newsflow mounted, leaving the recent rally at risk. German software firm SAP sharply revised their outlook lower, leading their shares to trade lower by over 20%. This led tech firms lower, with China's sanction of US aerospace & defense firms over arms sales to Taiwan adding to the downside.
Polling continues to suggest Trump's paths to a second term are dwindling, with Monday's broad-based move lower in stocks a possible sign that equities are pricing in a straightforward Blue Wave at next week's election. Despite the range in stocks, currencies were rangebound, but the over-arching risk-off tone fed into USD strength.
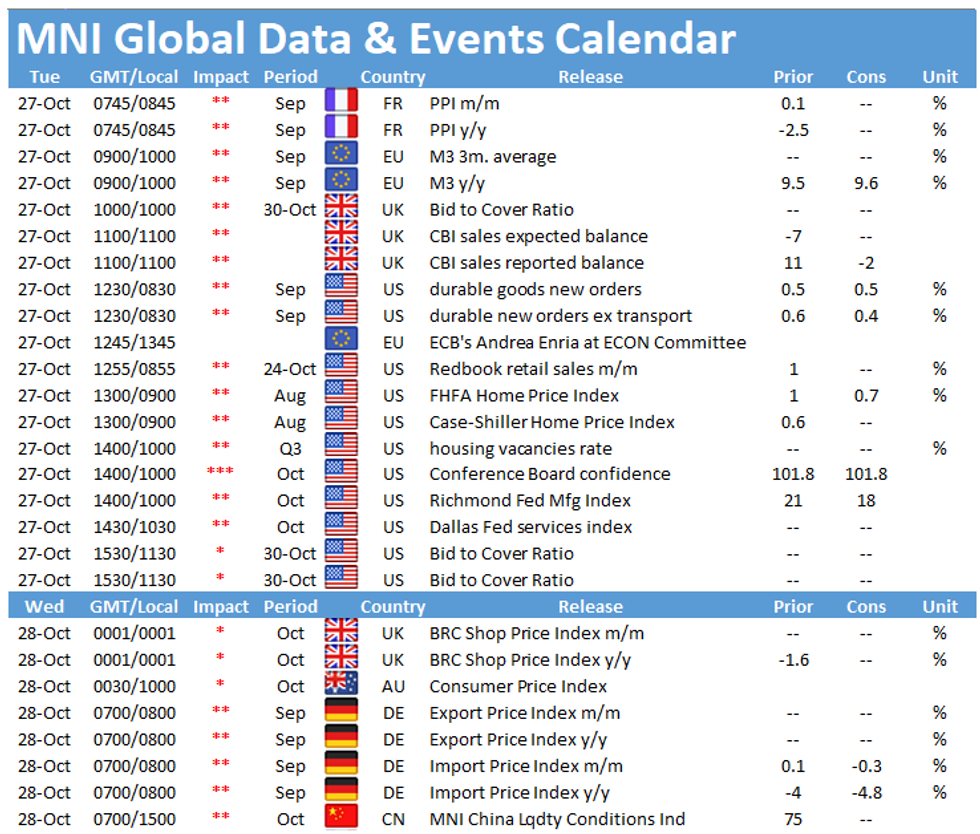
Focus Tuesday turns to September durable goods orders and consumer confidence data from the US. RBA's Debelle & Bullock and ECB's de Cos are due to speak.
US Equities Go From Weak to Weaker
Equity sell-off picking up further with new lows printed in US equity futures - e-mini S&P now down 2.7% to hit a new low at 3,357.00, the lowest level since Oct07.
While there's been no single headline catalyst behind the move, there has been a series of equity negative newsflow that raised risks to the current equity rally. Namely:
- German software firm SAP revising their outlook sharply, weighing on US rivals including Oracle (-4%)
- China placing sanctions on US aerospace & defense firms including Boeing, Raytheon & Lockheed Martin (all down between 2-5%)
- Kudlow reaffirming the gaps between the White House & Democratic Reps on COVID stimulus
- Libyan supply weighing on oil prices (WTI down 3.4%) and pressuring energy names including ConocoPhillips & Marathon Oil (down 7% apiece)
EUR/USD TECHS: Still Trading Below Last Week's High
- RES 4: 1.2011 High Sep and key resistance
- RES 3: 1.1917 Sep 10 high / 76.4% of the Sep 1 - 25 sell-off
- RES 2: 1.1904 1.0% 10-dma envelope
- RES 1: 1.1881 High Oct 21 and the intraday bull trigger
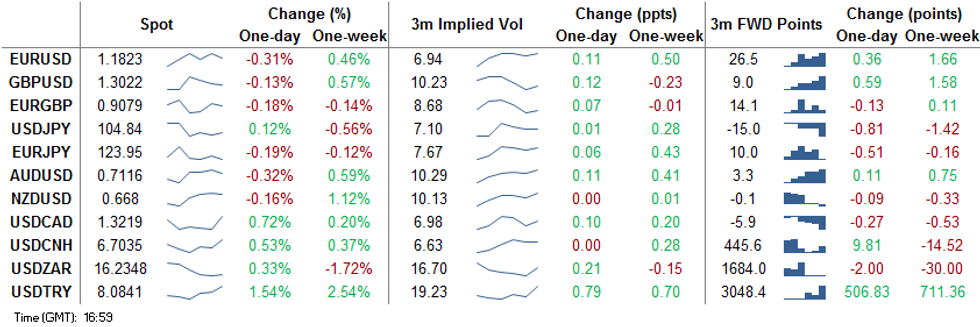
- PRICE: 1.1817 @ 16:41 GMT Oct 26
- SUP 1: 1.1787/60 Low Oct 23 / Oct 20
- SUP 2: 1.1747 50-day EMA
- SUP 3: 1.1729 Trendline support drawn off the Sep 28 low
- SUP 4: 1.1689 Low Oct 15 and a key support
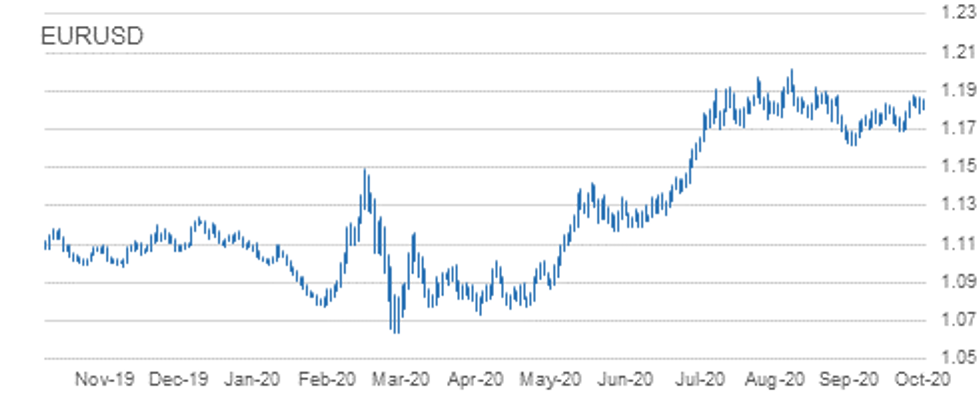
EURUSD traded softer Monday and is still trading below last week's high of 1.1881. Despite the pullback, the outlook is positive and pullbacks are considered corrective. The recent breach of the former bull trigger at 1.1831, Oct 9 high reinforced the current bullish price structure and signals scope for 1.1917 next, a retracement level with the major resistance and hurdle for bulls at 1.2011, Sep 1 high. Key short-term trendline support is at 1.1729.
GBP/USD TECHS: Corrective Pullback
- RES 4: 1.3292 76.4% retracement of the Sep 1 - 23 sell-off
- RES 3: 1.3260 2.0% 10-dma envelope
- RES 2: 1.3245 Former trendline support drawn off the Mar 20 low
- RES 1: 1.3177 High Oct 21
- PRICE: 1.3015 @ 16:42 GMT Oct 26
- SUP 1: 1.2979 20-day EMA
- SUP 2: 1.2940 Low Oct 21
- SUP 3: 1.2863 Low Oct 14 and key near-term support
- SUP 4: 1.2806 Low Sep 30
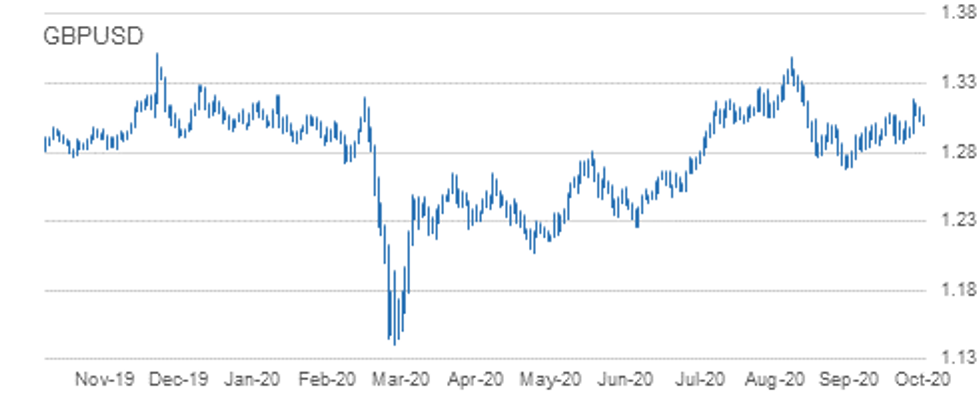
GBPUSD continues to retrace the Oct 21 rally. The move lower is likely a correction though with the S/T bullish structure still intact. The Oct 21 climb reinforced the near-term bullish theme, confirming a resumption of the upleg that started on Sep 23. Attention is on 1.3245, the former trendline support drawn off the Mar 20 low. The trendline was breached on Sep 9. Firm support is at 1.2940, Oct 21 low. The reversal trigger lies at 1.2863, Oct 14 low.
EUR/GBP TECHS: Focus Is On Support
- RES 4: 0.9162 High Oct 7
- RES 3: 0.9158 1.0% 10-dma envelope
- RES 2: 0.9149 Oct 20 high
- RES 1: 0.9107 High Oct 23
- PRICE: 0.9078 @ 16:46 GMT Oct 26
- SUP 1: 0.9012 Low Oct 21
- SUP 2: 0.9007 Low Oct 14 and the bear trigger
- SUP 3: 0.8967 76.4% retracement of the Sep 3 - 11 rally
- SUP 4: 0.8925 Low Sep 7
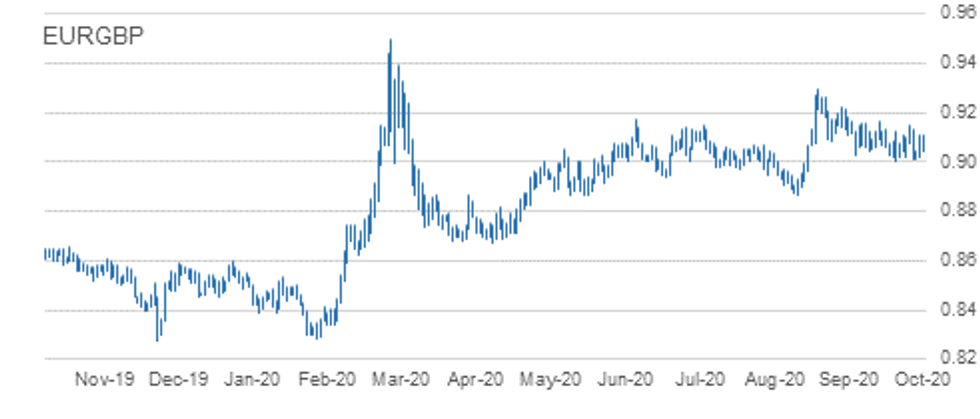
EURGBP is retracing Friday's gains. The outlook remains bearish following the sharp sell-off on Oct 21. Attention is on support at 0.9007, Oct 14 low and the near-term bear trigger. A break of 0.9007 would confirm a resumption of the downtrend that started Sep 11 and expose 0.8967, a retracement point. Key resistance has been defined at 0.9149, Oct 20 high. Clearance of this level would undermine bearish conditions.
USD/JPY TECHS: Bearish Focus
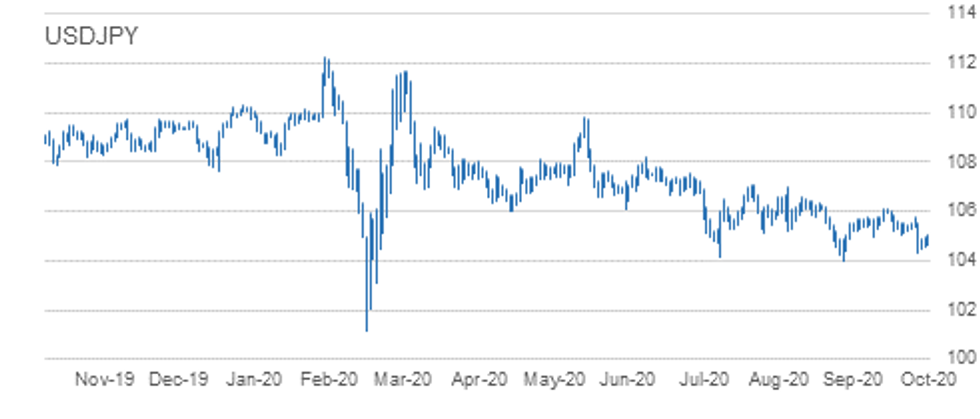
- RES 4: 106.11 High Oct 7 and key resistance
- RES 3: 105.75 High Oct 20
- RES 2: 105.53/63 High Oct 21 / 50-dma
- RES 1: 105.04 Low Oct 4 and a recent breakout level
- PRICE: 104.85 @ 16:49 GMT Oct 26
- SUP 1: 104.34 Low Oct 21
- SUP 2: 104.00 Low Sep 21 and the bear trigger
- SUP 3: 103.67 76.4% retracement of the Mar 9 - 24 rally
- SUP 4: 103.09 Low Mar 12
USDJPY is consolidating. The pair maintains a weaker outlook following the Oct 21 sell-off and the resumption of the downleg from 106.11, Oct 7 high. A number of important supports have been cleared signalling scope for a deeper pullback towards the key 104.00 handle, Sep 21 low. A break of 104.00 would suggest scope for further USD depreciation within the bear channel drawn off the Mar 24 high. Initial resistance is at 105.04.
EUR/JPY TECHS: Holding Above Support For Now
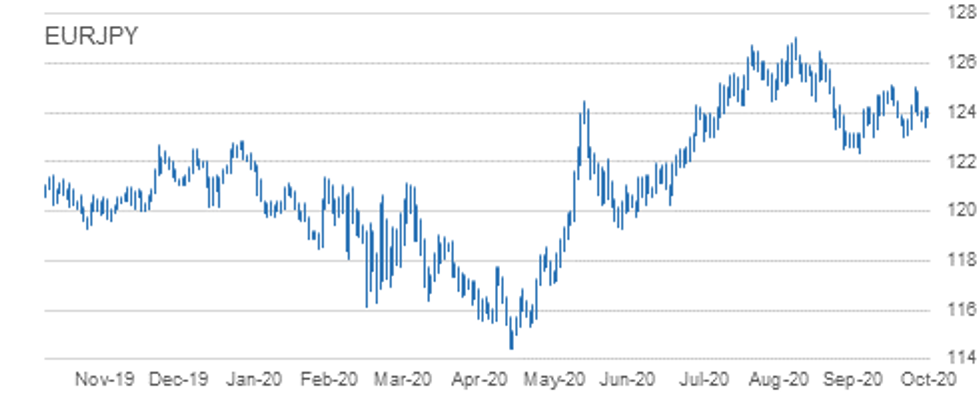
- RES 4: 125.97 76.4% retracement of the Sep 1 - 28 sell-off
- RES 3: 125.28 61.8% of the Sep 1 - 28 sell-off
- RES 2: 125.00/09 High Oct 20 and Oct 9
- RES 1: 124.23 High Oct 23 and intraday high
- PRICE: 123.92 @ 16:50 GMT Oct 26
- SUP 1: 123.41 Low Oct 23
- SUP 2: 123.03/02 Low Sep 29 and Oct 2 / Low Oct 15
- SUP 3: 122.38/28 Low Sep 28 / 61.8% of the Jun 22 - Sep 1 rally
- SUP 4: 122.25 38.2% retracement of the May - Sep rally
EURJPY is largely unchanged and still trading below recent highs. Attention is on support at 123.03/02, low prints between Sep 29 and Oct 15. A break of this level would undermine the recent bullish outlook and instead highlight risk for a deeper sell-off towards 122.38, Sep 28 low and the bear trigger. Moving average studies are in a neutral position. To strengthen a bullish argument, price needs to clear key resistance at 125.09, Oct 9 high.
AUD/USD TECHS: Trendline Resistance Still Intact
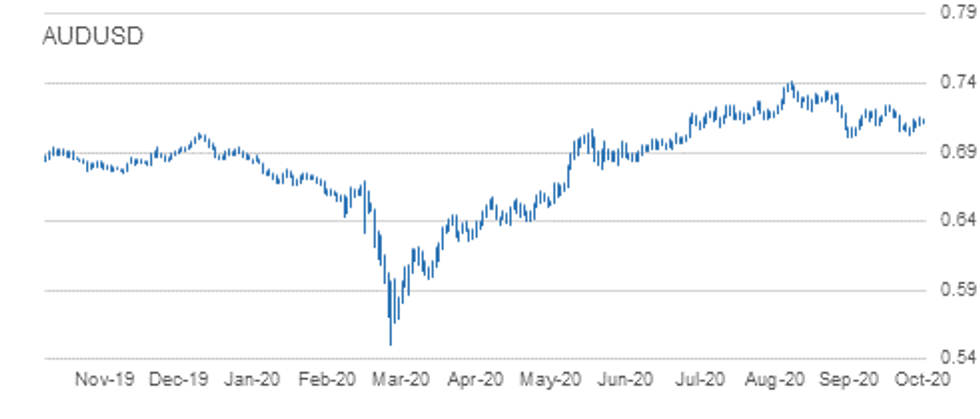
- RES 4: 0.7324 High Sep 21
- RES 3: 0.7243 High Oct 10 and the intraday bull trigger
- RES 2: 0.7169/70 Trendline drawn off the Sep 1 high / High Oct 15
- RES 1: 0.7158 High Oct 23
- PRICE: 0.7117 @ 16:53 GMT Oct 26
- SUP 1: 0.7021 Low Oct 20
- SUP 2: 0.7006 Low Sep 25 and the bear trigger
- SUP 3: 0.6965 23.6% retracement of the Mar - Sep rally
- SUP 4: 0.6931 0.764 projection of Sep 1 - 25 sell-off from Oct 9 high
AUDUSD outlook remains bearish despite last week's recovery. The pair continues to trade below trendline resistance drawn off the Sep 1 high. The line intersects at 0.7169 and the recent failure at the trendline highlights a bearish risk. Attention is on the primary support and bear trigger at 0.7006, Sep 25 low. A trendline resistance break is needed to alter the picture that would signal a stronger reversal. This would open 0.7243, Oct 10 high.
USD/CAD TECHS: Rising Nicely Off Last Week's Low
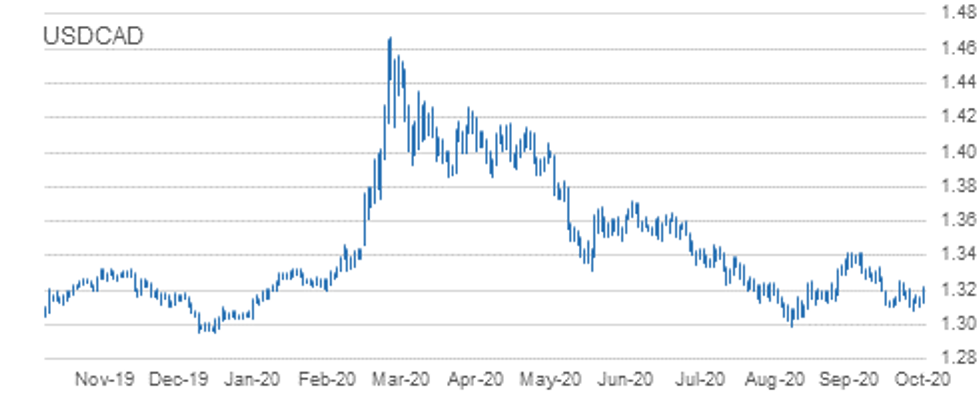
- RES 4: 1.3421 High Sep 30 and primary resistance
- RES 3: 1.3341 High Oct 7
- RES 2: 1.3241/59 50-day EMA / High Oct 15 and the bull trigger
- RES 1: 1.3219 High Oct 26
- PRICE: 1.3217 @ 16:57 GMT Oct 26
- SUP 1: 1.3081 Low Oct 21 and the intraday bear trigger
- SUP 2: 1.3047 Low Sep 7
- SUP 3: 1.3038 Low Sep 2
- SUP 4: 1.2994 Low Sep 1 and the major support
USDCAD is rallying nicely off last week's lows, but bearish conditions remain intact. The pair last week traded below key support at 1.3099, Oct 13 low. The move lower confirms a resumption of the current downtrend that started Sep 30. Moving average studies are bearish too, reinforcing the current climate. Scope exists for a move towards the major support at 1.2994, Sep 1 low. Key resistance has been defined at 1.3259, Oct 15 high.
EUR/USD: MNI KEY LEVELS
- *$1.2009/11 May03-2018 high/YTD Sep01 high
- *$1.1996 May14-2018 high
- *$1.1938 May15-2018 high
- *$1.1918 Upper Bollinger Band (3%)
- *$1.1904 Upper 1.0% 10-dma envelope
- *$1.1870 Upper Bollinger Band (2%)
- *$1.1857/61 100-mma/Intraday high
- *$1.1851 Cloud top, Jun14-2018 high
- *$1.1837 100-hma
- *$1.1815 Sep24-2018 high
- *$1.1815 ***CURRENT MARKET PRICE 17:46GMT MONDAY***
- *$1.1803/98 Intraday low/55-dma
- *$1.1797 50-dma
- *$1.1790 200-hma
- *$1.1768 21-dma
- *$1.1757 Sep27-2018 high
- *$1.1736 Fibo 38.2% 1.3993-1.0341
- *$1.1677 Lower Bollinger Band (2%)
- *$1.1668 Lower 1.0% 10-dma envelope
- *$1.1651 Sep28-2018 high
- *$1.1638/33 100-dma/Cloud base
GBP/USD: MNI KEY LEVELS
- *$1.3191 Apr04-2019 high
- *$1.3185 May06-2019 high
- *$1.3144 Fibo 38.2% 1.4377-1.2382
- *$1.3133 Apr12-2019 high
- *$1.3126/31 Upper 1.0% 10-dma env/May07-2019 high
- *$1.3120 Upper Bollinger Band (2%)
- *$1.3109 Fibo 50% 1.1841-1.4377
- *$1.3075/80 Intraday high/May08-2019 high
- *$1.3061 100-hma
- *$1.3041/45 May13-2019 high/Cloud top
- *$1.3018 ***CURRENT MARKET PRICE 17:46GMT MONDAY***
- *$1.3017 55-dma
- *$1.3012 50-dma
- *$1.3005 200-hma
- *$1.2999 Fibo 61.8% 1.3381-1.2382
- *$1.2993/91 Intraday low/May10-2019 low
- *$1.2981 Cloud base
- *$1.2970 May14-2019 high
- *$1.2963 21-dma
- *$1.2952/47 50-mma/200-wma
- *$1.2904 May14-2019 low
EUR/GBP: MNI KEY LEVELS
- *Gbp0.9307 Aug29-2017 high
- *Gbp0.9252 Upper 2.0% 10-dma envelope
- *Gbp0.9226 Sep04-2017 high
- *Gbp0.9203 Sep08-2017 high
- *Gbp0.9174 Upper Bollinger Band (3%)
- *Gbp0.9161 Upper 1.0% 10-dma envelope
- *Gbp0.9142 Upper Bollinger Band (2%)
- *Gbp0.9134 Sep11-2017 high
- *Gbp0.9104/06/08 Cloud top/Intraday high/Jan03-2019 high
- *Gbp0.9079 21-dma, Cloud base
- *Gbp0.9075 ***CURRENT MARKET PRICE 17:46GMT MONDAY***
- *Gbp0.9067/65/64 50-dma/200-hma, 55-dma/100-hma
- *Gbp0.9062 Jan11-2019 high
- *Gbp0.9051/48 Jul17-2019 high/100-dma, Jul16-2019 high
- *Gbp0.9041/39 Intraday low/Jul18-2019 high
- *Gbp0.9015/10 Lower Boll Band (2%)/Jul10-2019 high
- *Gbp0.9005/00 Jul23-2019 high/Jul22-2019 high
- *Gbp0.8983/80 Lower Boll Band (3%)/Lower 1.0% 10-dma env
- *Gbp0.8953 Jul23-2019 low
- *Gbp0.8921 Jul02-2019 low
- *Gbp0.8893/89 200-dma/Lower 2.0% 10-dma env
USD/JPY: MNI KEY LEVELS
- *Y106.20 Upper 1.0% 10-dma envelope
- *Y106.17 100-dma
- *Y106.16 Upper Bollinger Band (2%)
- *Y105.86 Cloud top
- *Y105.68 55-dma
- *Y105.59 50-dma
- *Y105.49 Cloud base
- *Y105.39 21-dma
- *Y105.11 200-hma
- *Y105.05/06 Cloud Tenkan Sen/Intraday high, Cloud Kijun Sen
- *Y104.90 ***CURRENT MARKET PRICE 17:46GMT MONDAY***
- *Y104.87/84 Jan03-2019 low/100-hma
- *Y104.66 Intraday low
- *Y104.62 Lower Bollinger Band (2%)
- *Y104.56 Mar26-2018 low
- *Y104.24 Lower Bollinger Band (3%)
- *Y104.10 Lower 1.0% 10-dma envelope
- *Y104.00 YTD low
- *Y103.94 200-mma
- *Y103.05 Lower 2.0% 10-dma envelope
- *Y101.99 Lower 3.0% 10-dma envelope
EUR/JPY: MNI KEY LEVELS
- *Y124.68 55-dma
- *Y124.56 50-dma
- *Y124.51 Fibo 61.8% 126.81-120.78
- *Y124.34 Apr01-2019 low
- *Y124.25 May07-2019 high
- *Y124.23 Intraday high
- *Y124.22 Fibo 38.2% 133.13-118.71
- *Y124.14 Fibo 38.2% 118.71-127.50
- *Y124.09 100-hma
- *Y124.01/03 Cloud Tenkan Sen/21-dma
- *Y123.93 ***CURRENT MARKET PRICE 17:46GMT MONDAY***
- *Y123.91 200-hma
- *Y123.80 Fibo 50% 126.81-120.78
- *Y123.78 Intraday low
- *Y123.74 May21-2019 high, Cloud Kijun Sen
- *Y123.72 Fibo 61.8% 115.21-137.50
- *Y123.68 Cloud base
- *Y123.55 100-dma
- *Y123.54 Fibo 50% 109.57-137.50
- *Y123.51 May22-2019 high
- *Y123.18 Jun11-2019 high
AUD/USD: MNI KEY LEVELS
- *$0.7244 200-wma
- *$0.7234 Upper Bollinger Band (2%)
- *$0.7206/07 Apr17-2019 high/Feb21-2019 high
- *$0.7194/97 55-dma/50-dma
- *$0.7182 Upper 1.0% 10-dma envelope
- *$0.7168 Cloud base
- *$0.7153 Apr17-2019 low
- *$0.7146 Intraday high
- *$0.7136/40 21-dma/Apr16-2019 low
- *$0.7116 Apr12-2019 low
- *$0.7113 ***CURRENT MARKET PRICE 17:46GMT MONDAY***
- *$0.7110/08 Apr10-2019 low, 100-hma/100-dma
- *$0.7103 Intraday low
- *$0.7098 200-hma
- *$0.7088 Apr08-2019 low
- *$0.7073/69 Mar29-2019 low/Apr30-2019 high
- *$0.7057/53 Jul22-2019 high/Apr02-2019 low
- *$0.7048/44 Jul04-2019 high, May07-2019 high/Jul16-2019 high, Lower Boll Band (2%)
- *$0.7039 Lower 1.0% 10-dma envelope
- *$0.6997 Lower Bollinger Band (3%)
- *$0.6985 Jan03-2019 low
USD/CAD: MNI KEY LEVELS
- *C$1.3373/76 Upper Boll Band (2%)/100-wma, 50% 1.4690-1.2062
- *C$1.3358 Fibo 50% 1.3565-1.3151
- *C$1.3340/45 100-dma/Jun12-2019 high
- *C$1.3328 Fibo 38.2% 1.2783-1.3665
- *C$1.3320 Cloud top
- *C$1.3309 Fibo 38.2% 1.3565-1.3151
- *C$1.3296/00 Upper 1.0% 10-dma env/Jun13-2019 low
- *C$1.3286 Jun20-2019 high
- *C$1.3226 Jun10-2019 low
- *C$1.3224/25 50% 1.2783-1.3665/Intraday high
- *C$1.3221 ***CURRENT MARKET PRICE 17:46GMT MONDAY***
- *C$1.3218 21-dma
- *C$1.3204/99 55-dma/50-dma
- *C$1.3176 50-mma
- *C$1.3165/64/63 200-hma/Jul23-2019 high/Feb21-2019 low
- *C$1.3160 200-wma
- *C$1.3153/51/50 Cloud base/Jun20-2019 low/Feb20-2019 low
- *C$1.3143 100-hma
- *C$1.3126 Intraday low
- *C$1.3120/16 61.8% 1.2783-1.3665/Jul23-2019 low
- *C$1.3113 Feb25-2019 low
Expiries for Oct27 NY cut 1000ET (Source DTCC)
EUR/USD: $1.1775-85(E765mln), $1.1800-05(E1.2bln)
USD/JPY: Y105.00($1.8bln), Y105.25-35($1.3bln), Y106.00-05($1.2bln)
AUD/USD: $0.6680(A$1.1bln)
AUD/NZD: N$1.0809-20(A$2.5bln)
Larger Option Pipeline
EUR/USD: Oct28 $1.1745-60(E1.1bln), $1.1800-05(E1.6bln), $1.2000(E2.7bln); Oct30 $1.1800(E1.1bln), $1.1850(E1.2bln), $1.1950(E1.7bln-EUR calls), $1.2000(E1.1bln); Nov03 $1.1900-05(E1.1bln)
USD/JPY: Oct28 Y104.85-00($2.9bln), Y105.30-40($1.8bln); Oct29 Y103.20-25($1.6bln), Y104.00($1.6bln), Y105.25($1.3bln), Y105.55-65($2.2bln), Y106.00($1.2bln); Oct30 Y104.00($1.2bln), Y104.50($2.2bln), Y104.80-85($1.4bln), Y106.00-05($2.2bln); Nov03 Y105.45-49($1.3bln); Nov04 Y105.00($1.1bln); Nov05 Y106.06-09($1.6bln)
EUR/JPY: Nov05 Y124.50(E1.0bln)
EUR/GBP: Nov02 Gbp0.8900(E1.6bln-EUR puts)
AUD/USD: Oct30 $0.7180-00(A$1.4bln); Nov02 $0.7140-45(A$1.5bln)
AUD/JPY: Oct29 Y73.20(A$1.0bln-AUD puts), Y76.35-40(A$2.4bln-AUD calls)
AUD/NZD: Oct30 N$1.0750(A$1.2bln)
USD/CAD: Oct30 C$1.3025($1.1bln), C$1.3150($1.2bln)
USD/CNY: Nov03 Cny6.5334($1.1bln); Nov05 Cny6.75($1.0bln), Cny6.80($1.9bln), Cny6.85($1.3bln)
Why MNI
MNI is the leading provider
of intelligence and analysis on the Global Fixed Income, Foreign Exchange and Energy markets. We use an innovative combination of real-time analysis, deep fundamental research and journalism to provide unique and actionable insights for traders and investors. Our "All signal, no noise" approach drives an intelligence service that is succinct and timely, which is highly regarded by our time constrained client base.Our Head Office is in London with offices in Chicago, Washington and Beijing, as well as an on the ground presence in other major financial centres across the world.