
Why MNI
MNI is the leading provider
of intelligence and analysis on the Global Fixed Income, Foreign Exchange and Energy markets. We use an innovative combination of real-time analysis, deep fundamental research and journalism to provide unique and actionable insights for traders and investors. Our "All signal, no noise" approach drives an intelligence service that is succinct and timely, which is highly regarded by our time constrained client base.Our Head Office is in London with offices in Chicago, Washington and Beijing, as well as an on the ground presence in other major financial centres across the world.
Sterling Surge is Best in Months
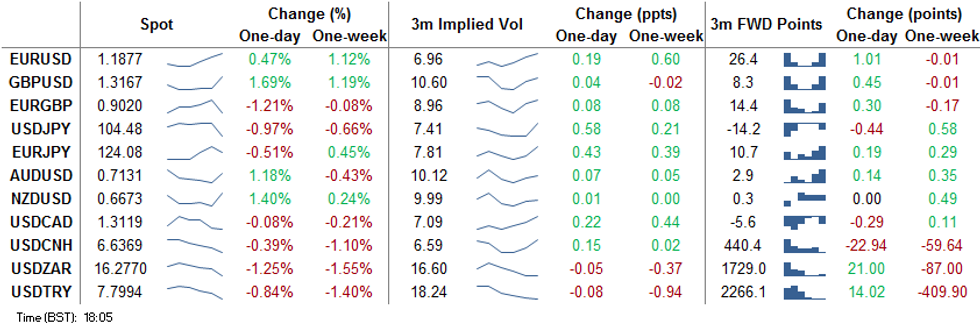
By a comfortable distance, GBP was the outperformer Wednesday, with markets rushing to price in a more favourable Brexit outcome with talks due to formally resume Thursday, with the EU formally recognising UK sovereignty - a key tenet for future talks. GBP/USD rallied sharply, adding over 2 points to hit 1.3177 in the strongest session for the pair since late March. This opens the Sep highs as the longer-term target at 1.3482.
Dealmaking in the US also took focus, with market sentiment still clearly hinged on the will-they-won't-they nature of a COVID aid package. Reports in US outlets seem to be suggesting the most likely timeframe for a package will come after the election, with the lame duck period between election and inauguration being most commonly cited. The USD responded negatively, pressing the USD index to the lowest levels since early September.
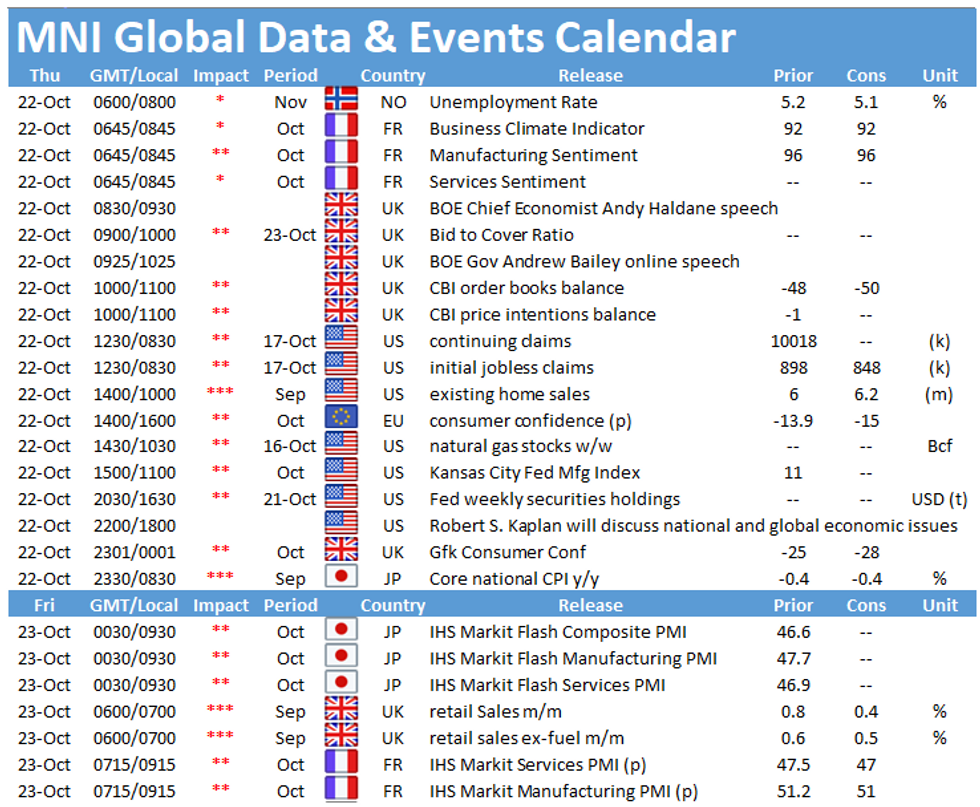
Focus Thursday turns to weekly US jobless data and existing home sales as well as Eurozone consumer confidence. BoE's Bailey & Haldane, Fed's Barkin & Kaplan and ECB's Panetta are due to speak.
EUR/USD TECHS: Heading North
- RES 4: 1.2011 High Sep and key resistance
- RES 3: 1.1917 76.4% retracement of the Sep 1 - 25 sell-off
- RES 2: 1.1885 1.0% 10-dma envelope
- RES 1: 1.1881 High Oct 21
- PRICE: 1.1871 @ 16:49 BST Oct 21
- SUP 1: 1.1822 Intraday low
- SUP 2: 1.1760 Low Oct 20
- SUP 3: 1.1734 50-day EMA
- SUP 4: 1.1712 Trendline support drawn off the Sep 28 low
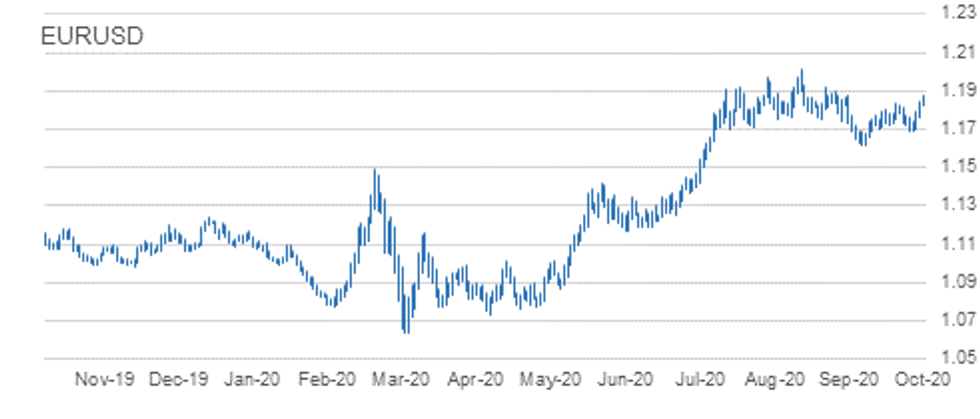
EURUSD gained further Wednesday, hitting the best levels since mid-September in the process. This week's positive trend remains intact after breaching the bull trigger at 1.1831, Oct 9 high. The break higher suggests scope for an extension towards 1.1917, a Fibonacci retracement level. The major resistance and hurdle for bulls is at 1.2011, Sep 1 high. On the downside, initial firm support lies at 1.1760, Tuesday's low.
GBP/USD TECHS: Ripping Higher
- RES 4: 1.3245 1.0% 10-dma envelope
- RES 3: 1.3210 Former trendline support drawn off the Mar 20 low
- RES 2: 1.3174 61.8% retracement of the Sep 1 - 23 sell-off
- RES 1: 1.3171 High Oct 21
- PRICE: 1.3143 @ 16:58 BST Oct 21
- SUP 1: 1.2863 Low Oct 14 and key near-term support
- SUP 2: 1.2846 Low Oct 7
- SUP 3: 1.2806 Low Sep 30
- SUP 4: 1.2745 Low Sep 28
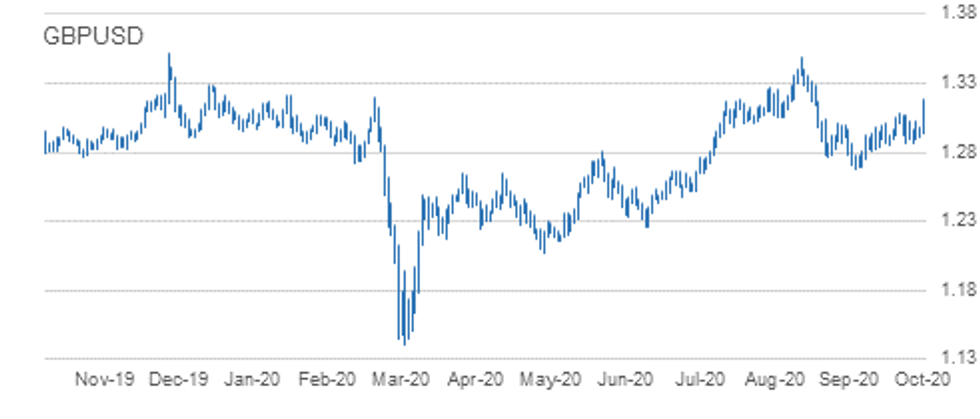
GBPUSD tore through near-term resistance at 1.3083 Wednesday on positive Brexit newsflow. This cements a resumption of the recent uptrend that opens 1.3210 as a longer-term target. This marks the former trendline support drawn off the Mar 20 low. The trendline was breached on Sep 9 and a return above it is required to strengthen a bullish theme. Firm near-term support lies at 1.2863, Oct 14 low. A breach would signal a resumption of bearish pressure.
EUR/GBP TECHS: Weaker Below 50-day EMA
- RES 4: 0.9183 61.8% retracement of the Sep 11 - Oct 14 sell-off
- RES 3: 0.9169 1.0% 10-dma envelope
- RES 2: 0.9162 High Oct 7
- RES 1: 0.9149 Oct 20 high
- PRICE: 0.9020 @ 17:13 BST Oct 21
- SUP 1: 0.9017 2% Lower Bollinger Band
- SUP 2: 0.9007 Low Oct 14
- SUP 3: 0.9000 Round number support
- SUP 4: 0.8967 76.4% retracement of the Sep 3 - 11 rally
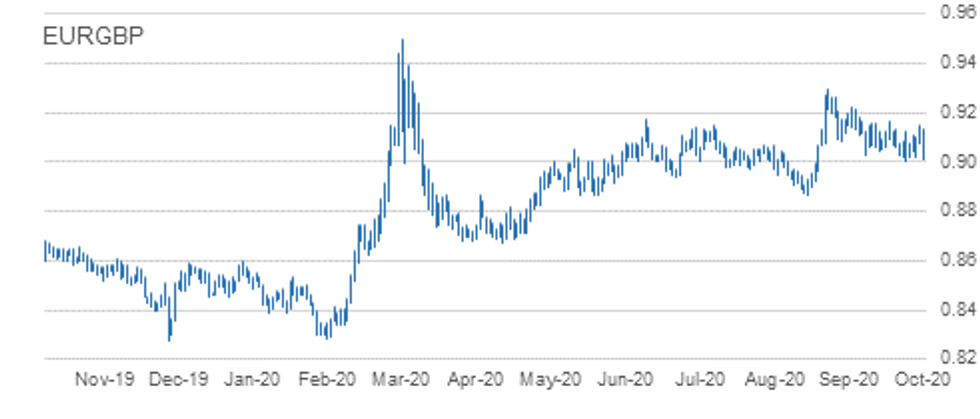
Despite early technical conditions looking bullish, EURGBP reverted lower into the London close, with markets falling convincingly through the 50-day EMA at 0.9071. Bulls will be looking for price to remain above 0.9007 and a break though would signal the resumption of bearish pressure. Resistance has been defined at 0.9149.
USD/JPY TECHS: Off Sharply
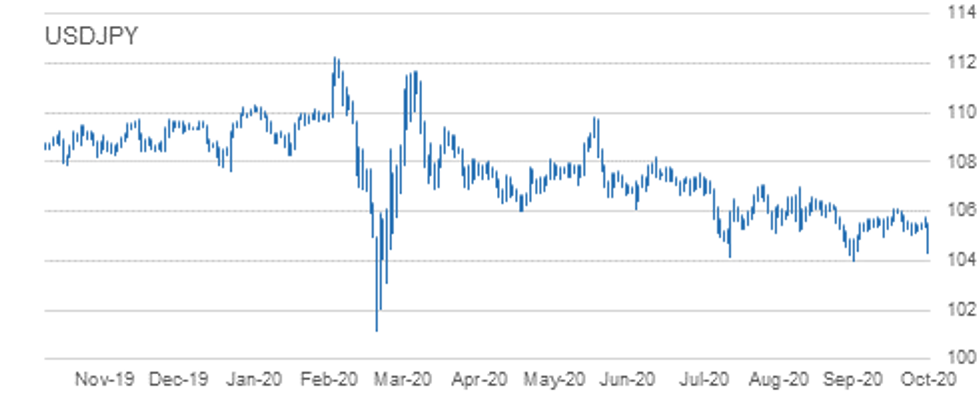
- RES 4: 106.41 Channel resistance drawn off Mar 24 high
- RES 3: 106.11/38 High Oct 7 and the bull trigger / High Sep 8
- RES 2: 105.73/75 50-dma / High Oct 20
- RES 1: 105.04 Low Oct 4 and a recent breakout level
- PRICE: 104.94 @ 17:21 BST Oct 21
- SUP 1: 104.34 Low Oct 21/1.0% 10-dma envelope
- SUP 2: 104.28 4.0% Lower Bollinger Band
- SUP 3: 104.00 Low Sep 21 and the bear trigger
- SUP 4: 10309 Low Mar 12
USDJPY sold off sharply Wednesday. The pair took out support at last week's low to break convincingly below the Y105 handle as well as the 104.94, Oct 2 low. This signals a deeper sell-off and opens the key 104.00 handle further out, Sep 21 low. On the upside, firm short-term resistance has been defined at 105.75.
EUR/JPY TECHS: Further Off Recent Highs
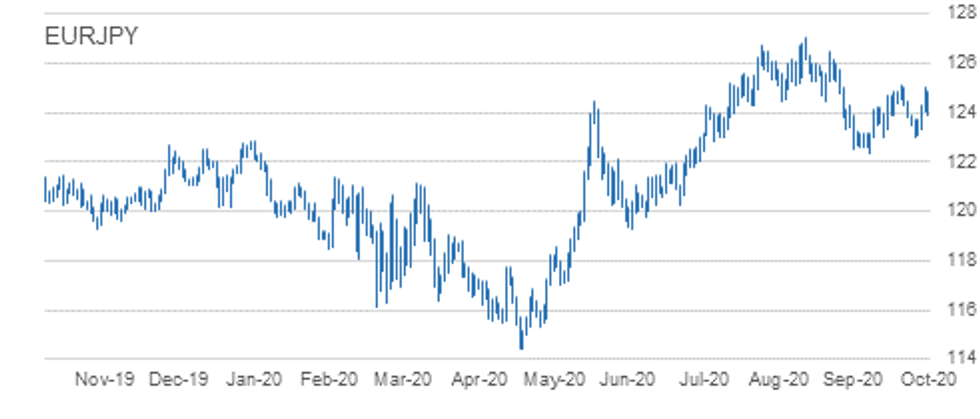
- RES 4: 126.46 High Sep 10
- RES 3: 125.97 76.4% retracement of the Sep 1 - 28 sell-off
- RES 2: 125.77 High Sep 15
- RES 1: 125.09/28 High Oct 9 / 61.8% of the Sep 1 - 28 sell-off
- PRICE: 124.10 @ 17:25 BST Oct 21
- SUP 1: 123.91 Low Oct 21
- SUP 2: 123.03/02 Low Sep 29 and Oct 2 / Low Oct 15
- SUP 3: 122.38/28 Low Sep 28 / 61.8% of the Jun 22 - Sep 1 rally
- SUP 4: 122.25 38.2% retracement of the May - Sep rally
EURJPY pulled further off recent highs Wednesday. The outlook remains positive though following recent gains that saw the cross pull away from support at 123.03/02, low prints between Sep 29 and Oct 15. The extension through 124.00 opens 125.09, Oct 9 high and the bull trigger. A break of 125.09 would expose 125.28 and 125.97, both retracement levels. On the downside, a 123.03/02 breach is needed to trigger bearish pressure and open 122.38, Sep 28 low.
AUD/USD TECHS: Bearish Theme Intact Despite Bounce
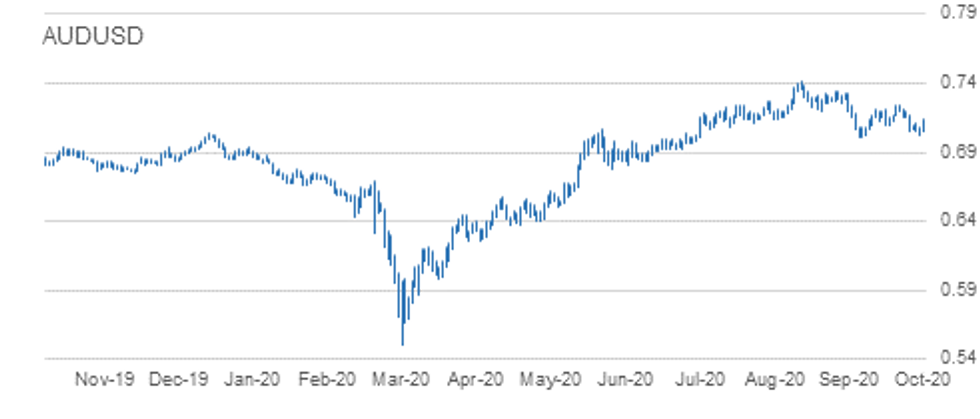
- RES 4: 0.7243 High Oct 10 and the intraday bull trigger
- RES 3: 0.7188 Trendline resistance drawn off the Sep 1 high
- RES 2: 0.7170 High Oct 15
- RES 1: 0.7137 High Oct 21
- PRICE: 0.7134 @ 17:27 BST Oct 21
- SUP 1: 0.7021 Low Oct 20
- SUP 2: 0.7006 Low Sep 25 and the bear trigger
- SUP 3: 0.6965 23.6% retracement of the Mar - Sep rally
- SUP 4: 0.6931 0.764 projection of Sep 1 - 25 sell-off from Oct 9 high
AUDUSD remains vulnerable despite the decent recovery from the Tuesday lows. On Oct 9, the pair cleared resistance at 0.7209, Oct 1 and 6 high resulting in a test of trendline resistance drawn off the Sep 1 high. The line intersects at 0.7188. The failure at the trendline is weighing on the Aussie and the scene is set for a deeper pullback. Attention is on the primary support and bear trigger at 0.7006, Sep 25 low. A trendline resistance break is needed to alter the picture.
USD/CAD TECHS: Trades Through Support
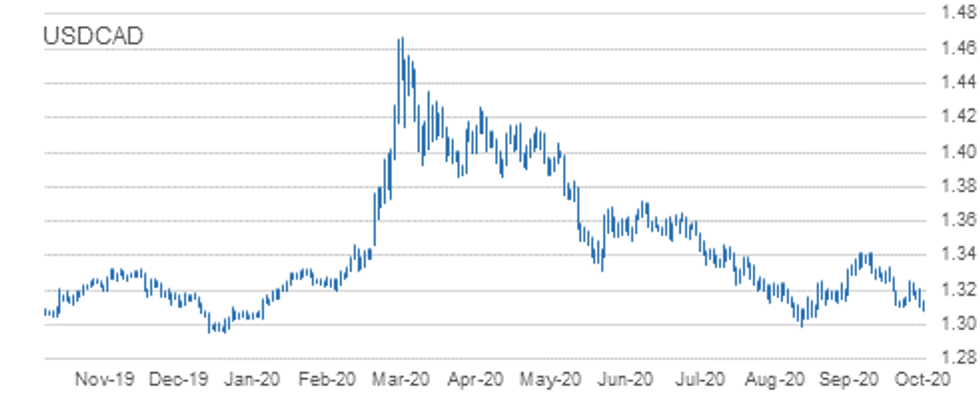
- RES 4: 1.3421 High Sep 30 and primary resistance
- RES 3: 1.3341 High Oct 7 and a reversal trigger
- RES 2: 1.3255/59 50-day EMA / High Oct 15 and the bull trigger
- RES 1: 1. 3210 20-day EMA
- PRICE: 1.3117 @ 17:34 BST Oct 21
- SUP 1: 1.3081 Intraday low
- SUP 2: 1.3047 Low Sep 7
- SUP 3: 1.3038 Low Sep 2
- SUP 4: 1.2994 Low Sep 1 and the major support
USDCAD bearish conditions dominate once again. The pair weakened through key support at 1.3099, Oct 13 low. The move lower confirms a resumption of current downtrend that started off the 1.3421 high on Sep 30. Moving average studies are bearish too, reinforcing the current climate. Scope is for a move towards the major support at 1.2994, Sep 1 low. Key resistance has been defined at 1.3259, Oct 15 high.
EUR/USD: MNI KEY LEVELS
- *$1.2139 Apr30-2018 high
- *$1.2131 Upper3.0% 10-dma env, Broken Up Trendline from Jan03-2017
- *$1.2084 May01-2018 high
- *$1.2032 May02-2018 high
- *$1.2009/11/14 May03-2018 high/YTD Sep01 high/Upper 2.0% 10-dma env
- *$1.1996 May14-2018 high
- *$1.1938 May15-2018 high
- *$1.1922 Upper Bollinger Band (3%)
- *$1.1896 Upper 1.0% 10-dma envelope
- *$1.1881 Intraday high
- *$1.1873 ***CURRENT MARKET PRICE 18:10BST WEDNESDAY***
- *$1.1864 Upper Bollinger Band (2%)
- *$1.1857 100-mma
- *$1.1851/48 Jun14-2018 high/Cloud top
- *$1.1822 Intraday low
- *$1.1815 Sep24-2018 high
- *$1.1798/97 50-dma/55-dma
- *$1.1772/71 100-hma/200-hma
- *$1.1757 Sep27-2018 high
- *$1.1744 21-dma
- *$1.1736 Fibo 38.2% 1.3993-1.0341
GBP/USD: MNI KEY LEVELS
- *$1.3311 Mar19-2019 high
- *$1.3276 Mar20-2019 high
- *$1.3269 Mar27-2019 high
- *$1.3247 Upper 2.0% 10-dma envelope
- *$1.3220 Upper Bollinger Band (3%)
- *$1.3213 Mar28-2019 high
- *$1.3196 Apr03-2019 high
- *$1.3191 Apr04-2019 high
- *$1.3185 May06-2019 high
- *$1.3177 Intraday high
- *$1.3161 ***CURRENT MARKET PRICE 18:10BST WEDNESDAY***
- *$1.3144 Fibo 38.2% 1.4377-1.2382
- *$1.3133/31 Apr12-2019 high/May07-2019 high
- *$1.3123 Upper Bollinger Band (2%)
- *$1.3117 Upper 1.0% 10-dma envelope
- *$1.3109 Fibo 50% 1.1841-1.4377
- *$1.3091 Cloud top
- *$1.3080 May08-2019 high
- *$1.3041 May13-2019 high
- *$1.3020/15 55-dma/50-dma
- *$1.2999 Fibo 61.8% 1.3381-1.2382
EUR/GBP: MNI KEY LEVELS
- *Gbp0.9194 Upper Bollinger Band (3%)
- *Gbp0.9158/60 Upper Boll Band (2%)/Upper 1.0% 10-dma env
- *Gbp0.9134/36 Sep11-2017 high/Intraday high
- *Gbp0.9108 Jan03-2019 high
- *Gbp0.9090 21-dma
- *Gbp0.9079/83 Cloud base, Cloud top/100-hma
- *Gbp0.9068 200-hma
- *Gbp0.9062/66 55-dma, Jan11-2019 high/50-dma
- *Gbp0.9048/51 Jul16-2019 high/Jul17-2019 high
- *Gbp0.9039/44 Jul18-2019 high/100-dma
- *Gbp0.9021 ***CURRENT MARKET PRICE 18:10BST WEDNESDAY***
- *Gbp0.9016/15 Lower Boll Band (2%)/Intraday low
- *Gbp0.9010 Jul10-2019 high
- *Gbp0.9005/00 Jul23-2019 high/Jul22-2019 high
- *Gbp0.8980/79 Lower Boll Band (3%)/Lower 1.0% 10-dma env
- *Gbp0.8953 Jul23-2019 low
- *Gbp0.8921 Jul02-2019 low
- *Gbp0.8888/85 Lower 2.0% 10-dma env/200-dma
- *Gbp0.8874/73/72 Jun19-2019 low/Jun20-2019 low/Jun12-2019 low
- *Gbp0.8865 Fibo 61.8% 0.9108-0.8473
- *Gbp0.8830 Jun06-2019 low
USD/JPY: MNI KEY LEVELS
- *Y105.69 50-dma
- *Y105.53 Intraday high
- *Y105.48 21-dma
- *Y105.37 200-hma
- *Y105.33 100-hma
- *Y105.19 Cloud Tenkan Sen
- *Y105.06 Cloud Kijun Sen
- *Y104.87 Jan03-2019 low
- *Y104.86 Lower Bollinger Band (2%)
- *Y104.55/56 Lower Boll Band (3%)/Mar26-2018 low
- *Y104.49 ***CURRENT MARKET PRICE 18:10BST WEDNESDAY***
- *Y104.34 Lower 1.0% 10-dma env, Intraday low
- *Y103.94 200-mma
- *Y103.28 Lower 2.0% 10-dma envelope
- *Y102.23 Lower 3.0% 10-dma envelope
- *Y102.02 YTD low
- *Y101.20 Nov09-2016 low
- *Y100.75 Sep30-2016 low
- *Y100.61 Fibo 50% 75.35-125.86
- *Y100.09 Sep27-2016 low
- *Y99.65 Aug18-2016 low
EUR/JPY: MNI KEY LEVELS
- *Y124.84 Intraday high
- *Y124.79 50-mma
- *Y124.73 55-dma
- *Y124.69 50-dma
- *Y124.51 Fibo 61.8% 126.81-120.78
- *Y124.34 Apr01-2019 low
- *Y124.25 May07-2019 high
- *Y124.22 Fibo 38.2% 133.13-118.71
- *Y124.14 Fibo 38.2% 118.71-127.50
- *Y124.06 Cloud Tenkan Sen
- *Y124.06 ***CURRENT MARKET PRICE 18:10BST WEDNESDAY***
- *Y124.03/99 200-hma/100-hma
- *Y123.91 Intraday low
- *Y123.88 21-dma
- *Y123.80 Fibo 50% 126.81-120.78
- *Y123.74 May21-2019 high, Cloud Kijun Sen
- *Y123.72 Fibo 61.8% 115.21-137.50
- *Y123.68 Cloud base
- *Y123.54 Fibo 50% 109.57-137.50
- *Y123.52 100-dma
- *Y123.51 May22-2019 high
AUD/USD: MNI KEY LEVELS
- *$0.7302 Upper Bollinger Band (3%)
- *$0.7295 Jan31-2019 high
- *$0.7274/79 Dec06-2018 high/Upper 2.0% 10-dma env
- *$0.7263/65 50-mma/Cloud top
- *$0.7244 200-wma, Upper Boll Band (2%)
- *$0.7206/07/08 Apr17-2019 high/Feb21-2019 high/Upper 1.0% 10-dma env
- *$0.7198/00 55-dma/50-dma
- *$0.7168 Cloud base
- *$0.7153 Apr17-2019 low
- *$0.7137/40 Intraday high/Apr16-2019 low
- *$0.7129 ***CURRENT MARKET PRICE 18:10BST WEDNESDAY***
- *$0.7126 200-hma, 21-dma
- *$0.7116 Apr12-2019 low
- *$0.7110 Apr10-2019 low
- *$0.7104 100-dma
- *$0.7088 Apr08-2019 low
- *$0.7078/73 100-hma/Mar29-2019 low
- *$0.7069/65 Apr30-2019 high/Lower 1.0% 10-dma env
- *$0.7057/53 Jul22-2019 high/Apr02-2019 low
- *$0.7048/47 Jul04-2019 high, May07-2019 high/Intraday low
- *$0.7044 Jul16-2019 high
USD/CAD: MNI KEY LEVELS
- *C$1.3248 21-dma
- *C$1.3224/26 50% 1.2783-1.3665/Jun10-2019 low
- *C$1.3213 55-dma
- *C$1.3203 50-dma
- *C$1.3171/74 100-hma/50-mma
- *C$1.3163/64 Cloud base, Feb21-2019 low/Jul23-2019 high
- *C$1.3156/61 200-hma/200-wma
- *C$1.3150/51 Feb20-2019 low/Jun20-2019 low
- *C$1.3140 Intraday high
- *C$1.3120 Fibo 61.8% 1.2783-1.3665
- *C$1.3119 ***CURRENT MARKET PRICE 18:10BST WEDNESDAY***
- *C$1.3116/13 Jul23-2019 low/Feb25-2019 low
- *C$1.3107 Jun26-2019 low
- *C$1.3081 Intraday low
- *C$1.3066 Fibo 38.2% 1.4690-1.2062
- *C$1.3053/48 38.2% 1.2062-1.3665/Lower Boll Band (2%)
- *C$1.3025 Lower 1.0% 10-dma envelope
- *C$1.3015 Oct25-2018 low
- *C$1.2994 YTD low
- *C$1.2970 Oct24-2018 low
- *C$1.2951 Lower Bollinger Band (3%)
Expiries for Oct22 NY cut 1000ET (Source DTCC)
EUR/USD: $1.1600-10(E1.7bln), $1.1644-50(E2.0bln), $1.1665-85(E1.3bln), $1.1795-00(E1.5bln), $1.1845-50($661mln), $1.1900(E570mln)
USD/JPY: Y104.00-10($1.7bln), Y104.50-55($2.6bln), Y104.95-105.00($1.2bln), Y105.40-50($1.2bln), Y105.80-106.00($2.7bln)
AUD/USD: $0.7075-80(A$504mln)
AUD/JPY: Y76.44(A$2.1bln)
USD/CNY: Cny6.80($810mln)
Larger Option Pipeline
EUR/USD: Oct23 $1.1800(E1.1bln), $1.1840-50(E1.3bln), $1.2000(E1.4bln); Oct26 $1.1500(E1.8bln), $1.1650-60(E1.6bln); Oct28 $1.1800-05(E1.4bln), $1.2000-05(E2.1bln); Oct30 $1.1800(E1.1bln), $1.1850-60(E1.2bln), $1.1950(E1.1bln-EUR calls)
USD/JPY: Oct23 Y103.00($1.3bln), Y105.40-60($1.2bln); Oct26 Y103.95-104.00($1.7bln-USD puts), Y105.30-40($1.7bln), Y105.60-75($1.2bln), Y106.95-107.00($1.6bln); Oct27 Y105.00($1.2bln), Y106.00-05($1.2bln); Oct28 Y105.00($1.1bln); Oct29 Y105.55-65($2.1bln), Y106.00($1.2bln); Oct30 Y104.50($1.9bln), Y104.80-85($1.1bln), Y106.00-05($2.2bln)
EUR/JPY: Oct26 Y122.80(E1.2bln)
GBP/USD: Oct23 $1.3090-1.3100(Gbp936mln-GBP calls)
EUR/GBP: Oct26 Gbp0.8900(E880mln), Gbp0.9000(E1.8bln-EUR puts)
AUD/USD: Oct27 $0.6680(A$1.1bln); Nov02 $0.7140-45(A$1.3bln)
AUD/JPY: Oct29 Y73.20(A$1.0bln-AUD puts), Y76.35-40(A$2.4bln-AUD calls)
AUD/NZD: Oct27 N$1.0809-20(A$2.5bln); Oct30 N$1.0750(A$1.2bln)
Why MNI
MNI is the leading provider
of intelligence and analysis on the Global Fixed Income, Foreign Exchange and Energy markets. We use an innovative combination of real-time analysis, deep fundamental research and journalism to provide unique and actionable insights for traders and investors. Our "All signal, no noise" approach drives an intelligence service that is succinct and timely, which is highly regarded by our time constrained client base.Our Head Office is in London with offices in Chicago, Washington and Beijing, as well as an on the ground presence in other major financial centres across the world.