
Why MNI
MNI is the leading provider
of intelligence and analysis on the Global Fixed Income, Foreign Exchange and Energy markets. We use an innovative combination of real-time analysis, deep fundamental research and journalism to provide unique and actionable insights for traders and investors. Our "All signal, no noise" approach drives an intelligence service that is succinct and timely, which is highly regarded by our time constrained client base.Our Head Office is in London with offices in Chicago, Washington and Beijing, as well as an on the ground presence in other major financial centres across the world.
- MNI US: Republican Asa Hutchinson Launches 2024 Presidential Campaign
- MNI UKRAINE: Zelenskyy After Xi Call-'No Peace At Expense Of Territorial Compromises':
- SOUTH KOREA YOON: SEEK TO DEEPEN, BROADEN BILATERAL PARTNERSHIP WITH US, bbg
- YOON: EXTENDED DETERRENCE TO HELP ENSURE KOREAN PENINSULA PEACE, Bbg
- CHINA'S XI: CHINA WILL SEND SPECIAL REPRESENTATIVE TO VISIT UKRAINE, CONDUCT TALKS WITH ALL PARTIES ON RESOLVING UKRAINE CRISIS, Rtrs
Key links:MNI INTERVIEW: U.S. Urged to Require Banks To Recapitali / MNI: BOC Discussed Rate Hike, Lacked Enough Evidence: Minutes / MNI INTERVIEW: Canada Job Data Keep Defying Gloom-Govt Analyst / MNI INTERVIEW: Riksbank Policy Must Stay Restrictive - Thedeen
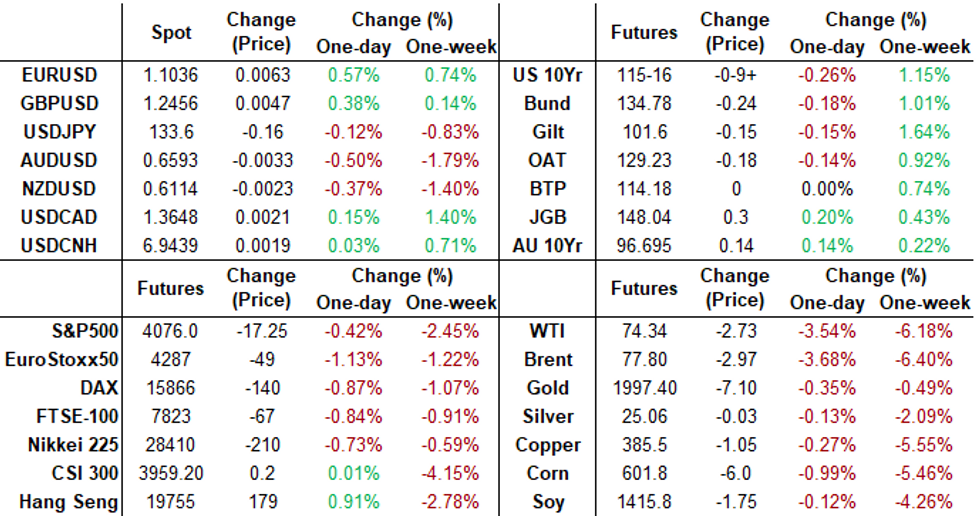
Tsys Weaker/Off Lows, Focus On House Debt Ceiling Vote, Equity Earnings
- Front month Treasury futures are currently weaker, but off second half lows, possibly in reaction to late procedural headline regarding the debt ceiling bill: "Republican Debt Ceiling Bill Advances In US House Toward Debate, Possible Vote On Passage" Twitter.
- Rates had sold off on stale FRC bank headlines regarding potential buyers ahead the NY open. As noted in this morning's What to Watch bullet: markets will be keeping a wary eye on First Republic Bank (FRC) headlines.
- Trading desks cited "US GOVERNMENT CURRENTLY UNWILLING TO INTERVENE ON FIRST REPUBLIC - CNBC CITING SOURCES" for a midday downturn in rates, Jun'23 10Y futures falling to 115-110 low, 10Y yield at 3.4259%.
- Curves holding onto steeper profiles (2s10s +5.711 at -49.988%) amid pre-auction and corporate supply related unwinds.
- Stocks on the other hand have reversed midday gains and through 50-day EMA technical support to 4071.25 low.
SHORT TERM RATES
SOFR Benchmark Settlements:
- 1M -0.01427 to 4.98221 (+.08223 total last wk)
- 3M -0.03335 to 5.04542 (+.06226 total last wk)
- 6M -0.06335 to 5.02735 (+.08430 total last wk)
- 12M -0.11819 to 4.74481 (+.06573 total last wk)
US DOLLAR LIBOR: Latest settlements:
- O/N -0.00500 to 4.79571%
- 1M +0.00686 to 5.02457%
- 3M -0.01886 to 5.27271% */**
- 6M -0.03400 to 5.37186%
- 12M -0.08443 to 5.28857%
- * Record Low 0.11413% on 9/12/21; ** New 16Y high: 5.26500% on 4/17/23
- Daily Effective Fed Funds Rate: 4.83% volume: $112B
- Daily Overnight Bank Funding Rate: 4.82% volume: $280B
- Secured Overnight Financing Rate (SOFR): 4.80%, $1.329T
- Broad General Collateral Rate (BGCR): 4.77%, $547B
- Tri-Party General Collateral Rate (TGCR): 4.77%, $540B
- (rate, volume levels reflect prior session)
FED Reverse Repo Operation
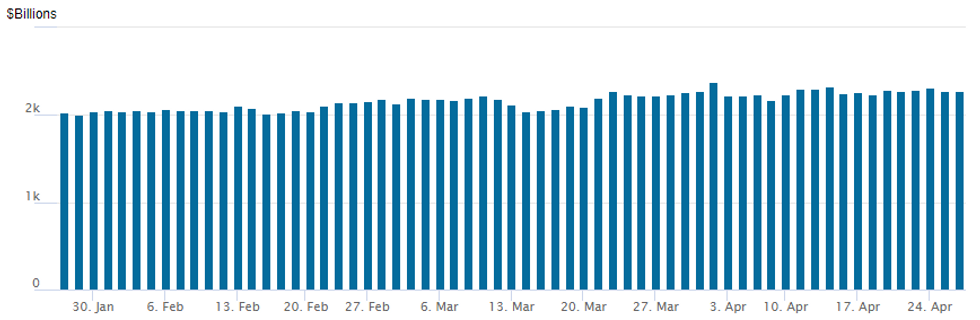
NY Federal Reserve/MNI
NY Fed reverse repo usage inches up to $2,279.561B w/ 97 counterparties, compares to prior $2,275.402B. Compares to high usage for 2023: $2,375.171B on Friday March 31, 2023; all-time record high of $2,553.716B reached December 30, 2022.
SOFR/TREASURY OPTIONS SUMMARY
Salient trade sums up underlying theme for Wednesday's SOFR options: Unambiguous Year-End Rate Cut Hedge with buyer of +10,000 SFRZ3 95.50/96.00/96.50 call flys with the SFRZ 95.75/96.25/96.75/97.25 call condor, paying 12.5 total to buy both structures, ref 95.72.
- Note, projected rate cut for year end are nearly back to yesterday's highs as short end rates rebounding.
- November cumulative at -28.4bp (-31.1bp Tue) at 4.545, Dec'23 cumulative -50.7bp (-52.1bp Tue) at 4.322. Meanwhile, Jan'24 cumulative back to three 25bp cuts to 4.078%3.
- SOFR Options:
- +10,000 SFRZ3 97.00 calls, 22.5 vs. 95.66/0.23%
- Block, 5,000 OQK3 96.00 puts, 2.0 vs. 96.605/0.05%
- +4,000 SFRU3 95.00/95.12/95.25 call flys, 0.5 ref 95.005
- +2,000 SFRU3 97.00/97.50 call spds vs. 2QU3 98.50/99.00 call spds .25 net db curve steepener
- +10,000 SFRZ3 95.50/96.00/96.50 call flys w/ SFRZ 95.75/96.25/96.75/97.25 call condor, 12.5 total db to buy both structures, ref 95.72
- Block, 2,500 SFRM4 94.50/95.00/95.50 put flys, 4.0 ref 96.665
- Block, 3,000 SFRN3 95.00/95.25/95.50/95.75 call condors, 5.5 ref 95.285
- 2,000 SFRZ3 95.75/96.50 call spds vs. OQZ3 97.75/98.50 call spds
- 2,000 SFRN3 94.68/94.93/95.18/95.43 put condors ref 95.305
- 3,000 SFRM3 95.00/95.12/95.25 call flys, ref 94.965
- Treasury Options:
- Block, 7,500 TYN3 113/120 call over risk reversals, 5 net ref 116-07
- Block, 8,000 TYM3 114.5 puts, 33 ref 115-22.5
- over 3,000 TYN3 121.5 calls, 18 ref 116-17
- Block/screen, over 34,000 FVM3 111 calls 30-31.5 ref 110-03.5 to -05
- over 14,400 FVM 111.25 calls, 25.5-27 ref 110-03.5 to -06
- 2,200 FVM3 110.75 calls, 34.5 ref 110-03
FOREX: EURUSD Pierces Key 1.1076 Resistance, EURAUD Highest Since Oct'20
- Despite multiple headlines regarding potential government intervention on First Republic Bank prompting volatile two-way trade in G10 currency markets, the USD index looks set to close with 0.4% losses as we approach the APAC crossover.
- The weaker greenback has most noticeably been seen in EURUSD which has advanced 0.55% on Wednesday. Despite fading off the day's highs, the pair has still reversed the entirety of Tuesday’s pullback to breach resistance at 1.1076, the Apr 1 2022 high and recent Apr 14 high. This confirms a resumption of the primary uptrend and opens 1.1127, a Fibonacci retracement.
- Note that moving average studies are in a bull-mode condition highlighting a rising trend. On the downside, key short-term support is unchanged at the 20-day EMA which intersects at 1.0930 today.
- Interestingly, EUR crosses have seen an extension of recent strength amid the weaker equity backdrop and softer CPI prints from the likes of Australia and New Zealand. EUR/AUD has rallied through 1.67 to the upside for the first time since October 2020, opening the path to the 50% retracement for the 2020 - 2022 downleg at 1.7045.
- Rising US yields and the recovery for major equity indices off mid-session lows has prompted a not insignificant 80 pip bounce for USDJPY with the pair now unchanged on the session, just below earlier highs of 133.94.
- We noted that the prior move lower had seen the pair clear initial support at the 20-day EMA which intersected at 133.51. While the breach does suggest scope for a potential continuation lower, bulls will look favourably on the supportive price action late Wednesday. More significant support remains lower down at 132.02, the Apr 13 low, of which a break would strengthen overall bearish conditions. On the upside, key short-term resistance is at 135.13, the Apr 19 high, where a break is required to reinstate the recent bullish theme.
- Focus turns to the Advanced reading of Q1 GDP from the US on Thursday, as well as Core PCE and March Pending Home Sales.
FX: Expiries for Apr27 NY cut 1000ET (Source DTCC)
- EUR/USD: $1.0750(E1.1bln), $1.0830(E635mln), $1.0900(E723mln), $1.0975(E585mln), $1.1000(E779mln), $1.1040(E1.1bln), $1.1125-26(E650mln)
- USD/JPY: Y135.00($1.2bln)
- GBP/USD: $1.2390-10(Gbp743mln), $1.2425-39(Gbp633mln)
- USD/CAD: C$1.3565-80($1.0bln)
- USD/CNY: Cny6.9500-20($770mln)
US EQUITIES: Extending Late Session Lows
No obvious headline driver for stocks leaking lower, new April lows, SPX EMINIs are making new lows for the month at 4077.25 and through technical support of 4086.99, the 50-Day EMA. A clear break of this average would highlight a top and expose 4061.11, a Fibonacci retracement.- The next two significant support levels are 4052.50 (Low Mar 30) and 4018.75 (50.0% retracement of the Mar 13 - Apr 18 bull leg).
- Bank headlines have had an untoward effect on indexes today, but nothing obvious on the latest move as Utilities, Industrials, Health Care and Energy sectors underperform.
- No positive reaction to a procedural headline regarding the debt ceiling bill: Republican Debt Ceiling Bill Advances In US House Toward Debate, Possible Vote On Passage.
US EQUITIES: (M3) Support At The 50-Day EMA Remains Exposed
- RES 4: 4244.00 High Feb 2 and a bull trigger
- RES 3: 4223.00 High Feb 14
- RES 2: 4198.25/205.50 High Apr 18 and key resistance / High Feb 16
- RES 1: 4164.25 High Apr 24
- PRICE: 4083.75 @ 1430ET Apr 26
- SUP 1: 4077.25 Low Apr 26
- SUP 2: 4061.11 38.2% retracement of the Mar 13 - Apr 18 bull leg
- SUP 3: 4052.50 Low Mar 30
- SUP 4: 4018.75 50.0% retracement of the Mar 13 - Apr 18 bull leg
A strong sell-off in S&P E-minis Tuesday resulted in a break below the 20-day EMA, at 4125.55. This exposes a more important support - the 50-day EMA - that intersects at 4086.99. A clear break of this average would highlight a top and expose 4061.11, a Fibonacci retracement. On the upside, initial firm resistance is seen at 4164.25, the Apr 24 high. A breach of this level would ease the developing bearish threat.
COMMODITIES: Headline Crude Inventories a Larger Draw Than Forecast
- Headline crude oil inventories a big draw at 5.0mln bbls vs. Exp. Draw of 1.1mln bbls
- Gasoline inventories at a draw of 2.4mln bbls vs. Exp. Draw of 1.1mln bbls, while distillates a draw of 577k bbls vs. Exp. Draw of 982k bbls
- Meanwhile refinery utilization at 0.30% vs. Exp. 0.39%
Thursday Data Calendar
| Date | GMT/Local | Impact | Flag | Country | Event |
| 27/04/2023 | 0130/1130 | ** |  | AU | Trade price indexes |
| 27/04/2023 | 0700/0900 | ** |  | SE | Economic Tendency Indicator |
| 27/04/2023 | 0800/1000 | ** |  | IT | ISTAT Business Confidence |
| 27/04/2023 | 0800/1000 | ** | | IT | ISTAT Consumer Confidence |
| 27/04/2023 | 0900/1100 | ** |  | EU | EZ Economic Sentiment Indicator |
| 27/04/2023 | 1100/0700 | * |  | TR | Turkey Benchmark Rate |
| 27/04/2023 | 1230/0830 | ** |  | US | Jobless Claims |
| 27/04/2023 | 1230/0830 | ** | | US | WASDE Weekly Import/Export |
| 27/04/2023 | 1230/0830 | * |  | CA | Payroll employment |
| 27/04/2023 | 1230/0830 | *** | | US | GDP |
| 27/04/2023 | 1400/1000 | ** | | US | NAR Pending Home Sales |
| 27/04/2023 | 1430/1030 | ** | | US | Natural Gas Stocks |
| 27/04/2023 | 1500/1100 | ** | | US | Kansas City Fed Manufacturing Index |
| 27/04/2023 | 1530/1130 | * | | US | US Bill 08 Week Treasury Auction Result |
| 27/04/2023 | 1530/1130 | ** | | US | US Bill 04 Week Treasury Auction Result |
| 27/04/2023 | 1615/1815 | | EU | ECB Panetta at EACB Board Meeting | |
| 27/04/2023 | 1700/1300 | ** | | US | US Treasury Auction Result for 7 Year Note |
| 27/04/2023 | 1700/1300 | * | | US | US Treasury Auction Result for Cash Management Bill |
Why MNI
MNI is the leading provider
of intelligence and analysis on the Global Fixed Income, Foreign Exchange and Energy markets. We use an innovative combination of real-time analysis, deep fundamental research and journalism to provide unique and actionable insights for traders and investors. Our "All signal, no noise" approach drives an intelligence service that is succinct and timely, which is highly regarded by our time constrained client base.Our Head Office is in London with offices in Chicago, Washington and Beijing, as well as an on the ground presence in other major financial centres across the world.