-
Policy
Policy
Exclusive interviews with leading policymakers that convey the true policy message that impacts markets.
LATEST FROM POLICY: -
EM Policy
EM Policy
Exclusive interviews with leading policymakers that convey the true policy message that impacts markets.
LATEST FROM EM POLICY: -
G10 Markets
G10 Markets
Real-time insight on key fixed income and fx markets.
Launch MNI PodcastsFixed IncomeFI Markets AnalysisCentral Bank PreviewsFI PiFixed Income Technical AnalysisUS$ Credit Supply PipelineGilt Week AheadGlobal IssuanceEurozoneUKUSDeep DiveGlobal Issuance CalendarsEZ/UK Bond Auction CalendarEZ/UK T-bill Auction CalendarUS Treasury Auction CalendarPolitical RiskMNI Political Risk AnalysisMNI Political Risk - US Daily BriefMNI Political Risk - The week AheadElection Previews -
Emerging Markets
Emerging Markets
Real-time insight of emerging markets in CEMEA, Asia and LatAm region
-
Commodities
-
Credit
Credit
Real time insight of credit markets
-
Data
-
Global Macro
Global Macro
Actionable insight on monetary policy, balance sheet and inflation with focus on global issuance. Analysis on key political risk impacting the global markets.
Global MacroDM Central Bank PreviewsDM Central Bank ReviewsEM Central Bank PreviewsEM Central Bank ReviewsBalance Sheet AnalysisData AnalysisEurozone DataUK DataUS DataAPAC DataInflation InsightEmployment InsightGlobal IssuanceEurozoneUKUSDeep DiveGlobal Issuance Calendars EZ/UK Bond Auction Calendar EZ/UK T-bill Auction Calendar US Treasury Auction Calendar Global Macro Weekly -
About Us
To read the full story
Sign up now for free trial access to this content.
Please enter your details below.
Why MNI
MNI is the leading provider
of intelligence and analysis on the Global Fixed Income, Foreign Exchange and Energy markets. We use an innovative combination of real-time analysis, deep fundamental research and journalism to provide unique and actionable insights for traders and investors. Our "All signal, no noise" approach drives an intelligence service that is succinct and timely, which is highly regarded by our time constrained client base.Our Head Office is in London with offices in Chicago, Washington and Beijing, as well as an on the ground presence in other major financial centres across the world.
Real-time Actionable Insight
Get the latest on Central Bank Policy and FX & FI Markets to help inform both your strategic and tactical decision-making.
Free AccessMNI UST Issuance Deep Dive: Dec 2024
MNI US Employment Insight: Soft Enough To Keep Fed Cutting
MNI ASIA MARKETS ANALYSIS: Jobs Data Green Lights Rate Cuts
MNI Asia Morning FX Analysis - Powell Divulges Few New Details
Fed's Powell Divulges Few New Details
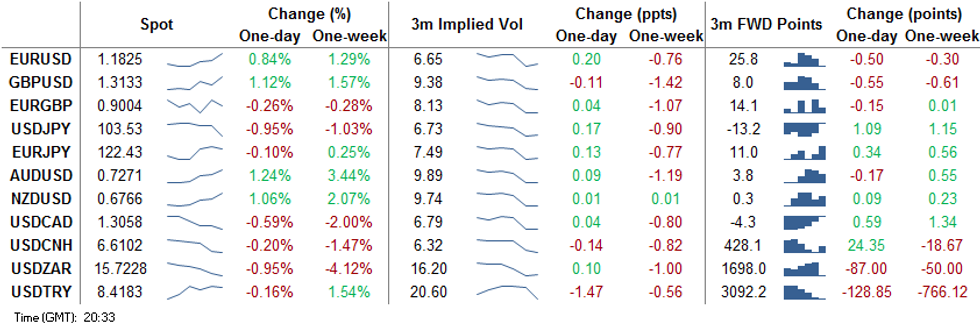
Powell revealed relatively little at his post-FOMC decision press conference, with markets relatively unmoved following the release. This month's meeting was always regarded as a placeholder for December, with the only newsworthy item being the change in release timings for the Summary of Economic Projections, which now come alongside the FOMC statement instead of being part of the minutes release.
In currencies, the USD fell further, narrowing the gap with the late October low for the USD index. USD implied vols remain in freefall, with with AUD/USD, USD/JPY, USD/CHF 3m vols all hitting the lowest since July. The drop in EUR/USD 3m Butterfly also reflects somewhat calmer outlook for USD -despite the contract capturing December's ECB meeting where they'll likely 'recalibrate' policy (ECB on Dec12th, FOMC on Dec16th).
USD was the weakest, NOK, AUD and NZD the strongest in G10.
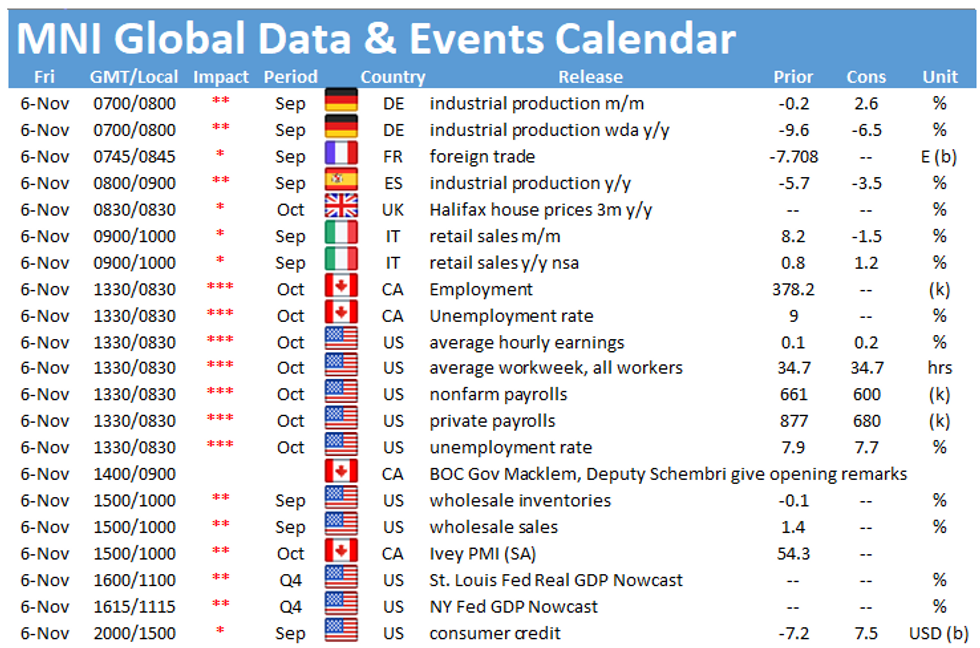
Focus Friday turns to the October Nonfarm Payrolls release. The US are expected to have added 585k jobs across the month, dragging the unemployment rate lower by a further 0.3 ppts. The RBA monetary policy statement, the Canadian jobs and further US election updates are also on the docket.
EUR/USD TECHS: Extends Recovery Off 1.1603
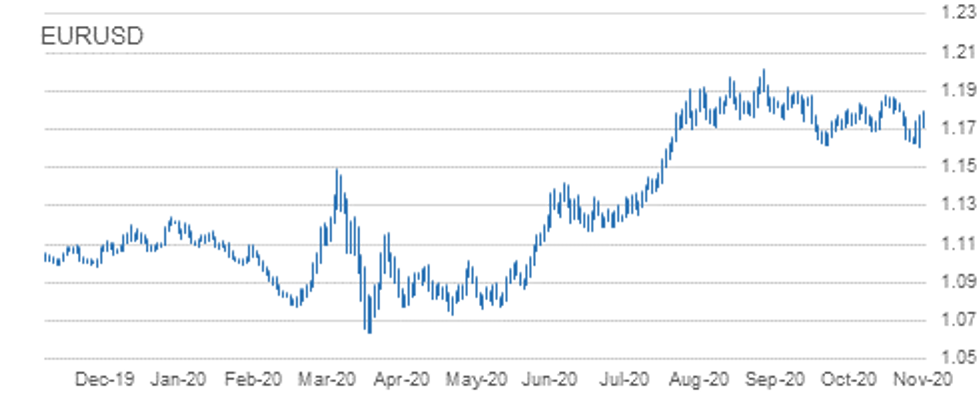
- RES 4: 1.2000 High Sep 1 and major resistance
- RES 3: 1.1917 High Sep 10
- RES 2: 1.1881 High Oct 21 and the bull trigger
- RES 1: 1.1860 High Oct 27
- PRICE: 1.1828 @ 19:37 GMT Nov 5
- SUP 1: 1.1711 Intraday low
- SUP 2: 1.1603 Low Nov 4 and the bear trigger
- SUP 3: 1.1576 0.764 proj of Sep 1 - 25 sell-off from Oct 21 high
- SUP 4: 1.1541 Low Jul 23
EURUSD has traded higher Thursday clearing initial resistance at 1.1770, Nov 4 high and extending the recovery off Wednesday's 1.1603 low. The break higher signals scope for a climb towards the next key resistance, and hurdle for bulls at 1.1881, Oct 21 high. A break of this level would open 1.2011, The Sep 1 high. On the downside, key support has been defined at 1.1603. A break is required to reinstate a bearish threat.
GBP/USD TECHS: Bearish Focus
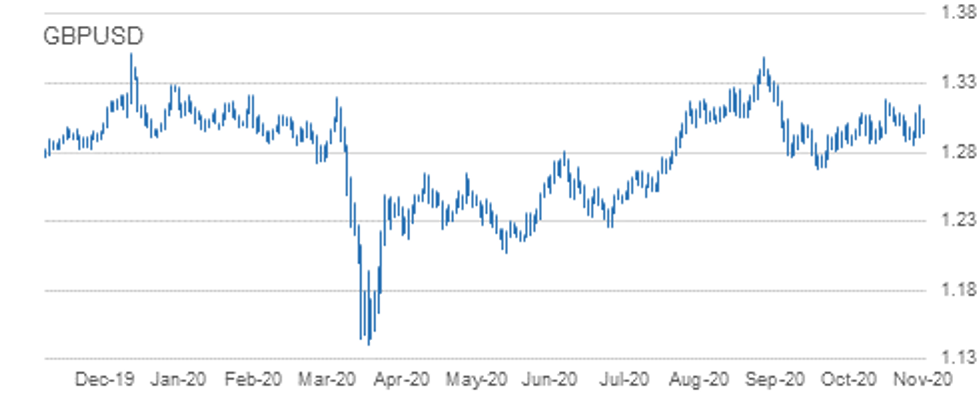
- RES 4: 1.3357 High Sep 3
- RES 3: 1.3261 2.0% 10-dma envelope
- RES 2: 1.3177 High Oct 21 and the bull trigger
- RES 1: 1.3145 High Nov 5
- PRICE: 1.3139 @ 19:55 GMT Nov 5
- SUP 1: 1.2911/2855 Low Nov 3 / Low Nov 2
- SUP 2: 1.2863 Low Oct 14 and key near-term support
- SUP 3: 1.2806 Low Sep 30
- SUP 4: 1.2794 76.4% retracement of the Sep 23 - Oct 21 rally
GBPUSD traded firmer Thursday. The outlook though remains bearish following last week's extension lower. We do note though that a move below key near-term support at 1.2855, Nov 2 low is required to reinforce bearish conditions. This would pave the way for a move towards 1.2676, Sep 23 low. On the upside, clearance of key resistance at 1.3177, Oct 21 high would alter the picture and reinstate a bullish theme.
EUR/GBP TECHS: Bullish Engulfing Reversal
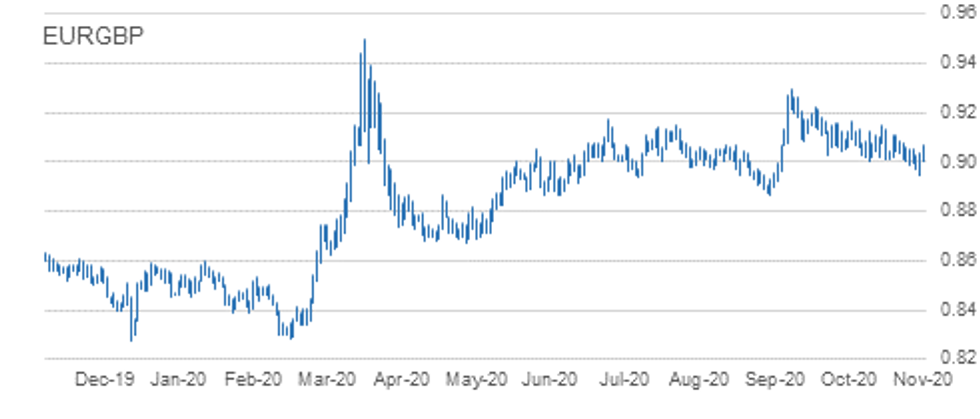
- RES 4: 0.9149 Oct 20 high
- RES 3: 0.9107 High Oct 23
- RES 2: 0.9085 Trendline resistance drawn off the Sep 11 high
- RES 1: 0.9069 Intraday high
- PRICE: 0.9007 @ 19:56 GMT Nov 5
- SUP 1: 0.8996 Low Nov 5
- SUP 2: 0.8946 Low Nov 4 and the key near-term support
- SUP 3: 0.8924 Low Sep 7
- SUP 4: 0.8900 Low Sep 4
EURGBP is firmer Thursday following the rebound off the 0.8946 Wednesday low. Wednesday's price action is potentially significant. In pattern terms the Wednesday candle line is a bullish engulfing reversal. If correct, it signals a floor has been established at 0.8946. Further gains would open 0.9107, Oct 23 high. Note there is a trendline resistance that intersects at 0.9085, drawn off the Sep 11 high. A break of 0.8946 would negate the pattern and resume the downtrend.
USD/JPY TECHS: Accelerates Losses on Break of 104
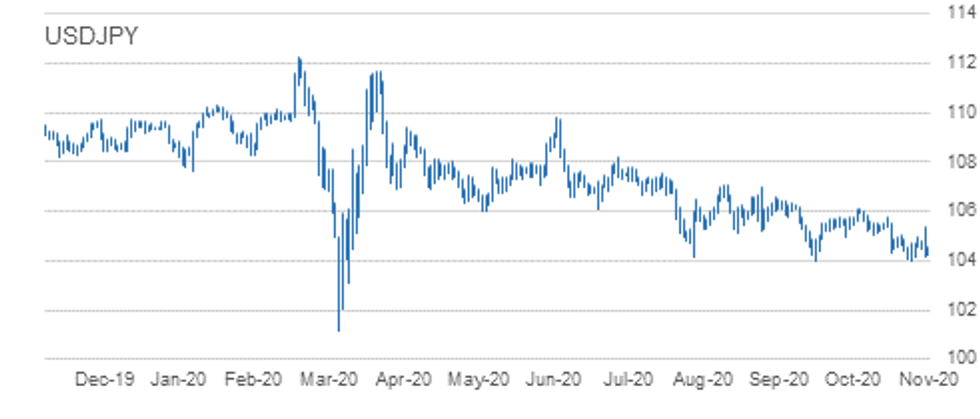
- RES 4: 106.11 High Oct 7 and the reversal trigger
- RES 3: 105.85 High Oct 12
- RES 2: 105.75 High Oct 20
- RES 1: 105.34 High Nov 4, 50-day EMA and key S/T resistance
- PRICE: 103.49 @ 19:57 GMT Nov 5
- SUP 1: 103.49 1.0% 10-dma envelope
- SUP 2: 103.48 Low Nov 5
- SUP 3: 103.30 3.0% Lower Bollinger Band
- SUP 4: 103.09 Low Mar 12
USDJPY fell further Thursday on the break below 104.00 - the first move through that mark since March's Coronavirus fallout. The first notable level provided little support at the 76.4% retracement of the Mar 9-24 rally at 103.67. This keeps the outlook resolutely negative headed into the Friday session. For the outlook to stabilise, a break above 105.34 is required to undermine the bearish theme and would expose 105.75 instead, Oct 20 high.
EUR/JPY TECHS: Corrective Recovery
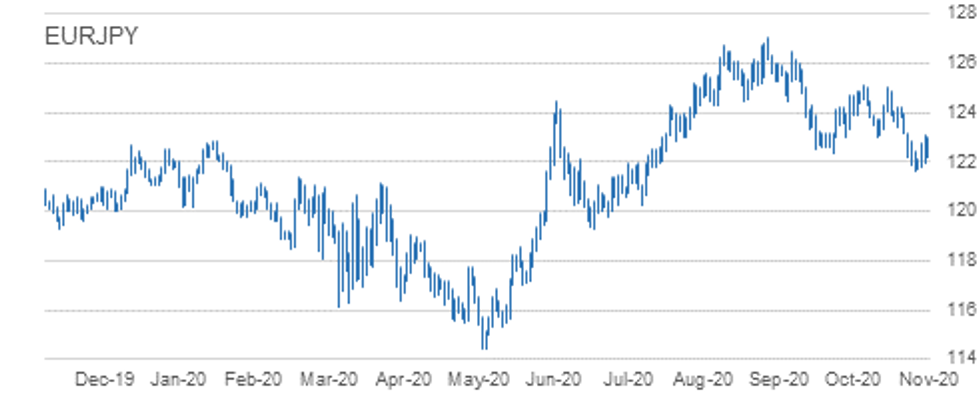
- RES 4: 124.00 High Oct 27
- RES 3: 123.65 50-day EMA
- RES 2: 123.20 20-day EMA
- RES 1: 123.07 High Nov 4 and intraday high
- PRICE: 122.46 @ 20:08 GMT Nov 5
- SUP 1: 121.62 Low Oct 30
- SUP 2: 121.50 0.764 proj of Sep 1 - 28 decline from Oct 9 high
- SUP 3: 120.56 Bear channel base drawn off the Sep 1 high
- SUP 4: 120.39 1.000 proj of Sep 1 - 28 decline from Oct 9 high
EURJPY is trading above recent lows but despite the recent recovery, maintains a bearish tone following last week's sell-off. The cross has recently cleared support at 123.03/02 and 122.38, Sep 28 low. This move lower confirmed a resumption of the downleg that started Sep 1. Scope is seen for weakness towards 121.50 next, a Fibonacci projection. Further out, 120.39 is on the radar, also a Fibonacci projection. Initial resistance is at 123.07.
AUD/USD TECHS: Steady Bullish Progress
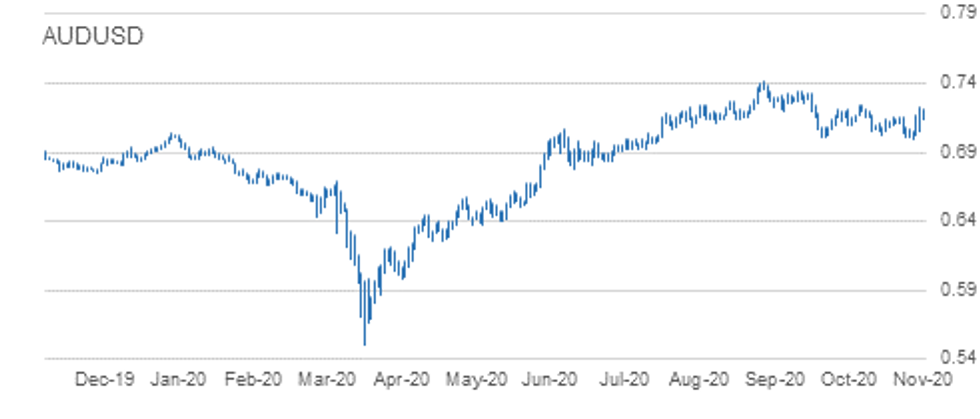
- RES 4: 0.7414 High Sep 1
- RES 3: 0.7339 3.0% 10-dma envelope
- RES 2: 0.7314 76.4% retracement of the Sep 1 - Nov 2 downleg
- RES 1: 0.7289 High Nov 5
- PRICE: 0.7278 @ 20:08 GMT Nov 5
- SUP 1: 0.7049 Low Nov 4
- SUP 2: 0.6991 Low Nov 2 and the bear trigger
- SUP 3: 0.6965 23.6% retracement of the Mar - Sep rally
- SUP 4: 0.6931 0.764 proj of Sep 1 - 25 sell-off from Oct 9 high
One way traffic in AUDUSD put the pair at new highs of 0.7289 Thursday, taking out resistance layered between 0.7243 and the day's high. This follows the break of key short-term trendline resistance drawn off the Sep 1 high and confirms the potential reversal. This further strengthens bullish conditions. On the downside, key support lies at 0.6991, Nov 2 low. This is also the bear trigger, a break would resume recent bearish pressure.
USD/CAD TECHS: Bearish Risk
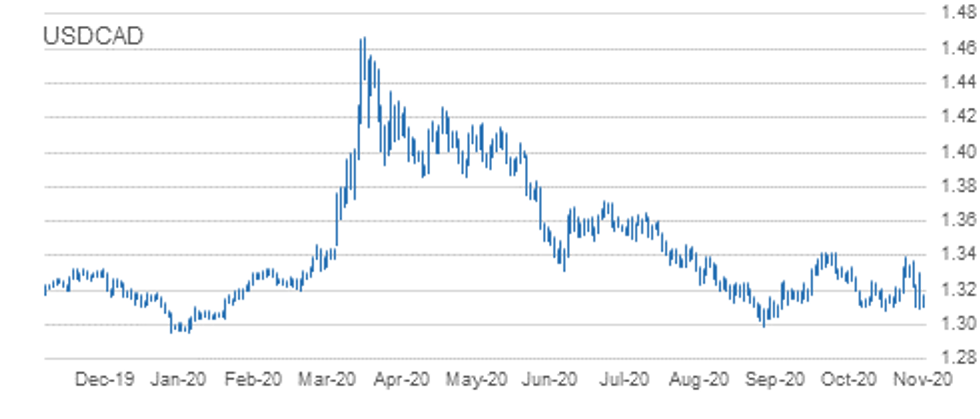
- RES 4: 1.3421 High Sep 30 and primary resistance
- RES 3: 1.3390 High Oct 29
- RES 2: 1.3300 High Nov 4
- RES 1: 1.3177 High Nov 5
- PRICE: 1.3074 @ 20:16 GMT Nov 5
- SUP 1: 1.3029 Low Nov 5
- SUP 2: 1.2994 Low Sep 1 and a key support
- SUP 3: 1.2952 Low Dec 31, 2019 and primary support
- SUP 4: 1.2940 2.0% 10-dma envelope
USDCAD continued to weaken throughout the Thursday session in line with general USD weakness. The pair has cleared a key short-term support at 1.3081, Oct 21 low, negating a recent bullish theme and instead highlights a stronger bearish near-term risk. The break lower refocuses attention on the key supports at 1.2994, Sep 1 low and the Dec 31, 2019 low of 1.2952. Initial firm resistance is at 1.3300, Wednesday's high.
EUR/USD: MNI KEY LEVELS
- *$1.2009/11 May03-2018 high/YTD Sep01 high
- *$1.1996 May14-2018 high
- *$1.1976 Upper 2.0% 10-dma envelope
- *$1.1959 Upper Bollinger Band (3%)
- *$1.1938 May15-2018 high
- *$1.1893 Upper Bollinger Band (2%)
- *$1.1859 Upper 1.0% 10-dma envelope
- *$1.1850/51 100-mma/Jun14-2018 high
- *$1.1815 Sep24-2018 high
- *$1.1797 Intraday high
- *$1.1796 ***CURRENT MARKET PRICE 09:53GMT THURSDAY***
- *$1.1781/78/77 55-dma/50-dma/Cloud top
- *$1.1762/57 21-dma/Sep27-2018 high
- *$1.1736 Fibo 38.2% 1.3993-1.0341
- *$1.1721/17 200-hma/Cloud base
- *$1.1711 Intraday low
- *$1.1680 100-hma
- *$1.1673 100-dma
- *$1.1651 Sep28-2018 high
- *$1.1630 Lower Bollinger Band (2%)
- *$1.1624/21 Lower 1.0% 10-dma env/Oct16-2018 high
GBP/USD: MNI KEY LEVELS
- *$1.3196/97 Apr03-2019 high/Upper Boll Band (3%)
- *$1.3191 Apr04-2019 high
- *$1.3185 May06-2019 high
- *$1.3144 Fibo 38.2% 1.4377-1.2382
- *$1.3133 Apr12-2019 high
- *$1.3127/31 Upper 1.0% 10-dma env/Upper Boll Band (2%), May07-2019 high
- *$1.3109 Fibo 50% 1.1841-1.4377
- *$1.3080 May08-2019 high
- *$1.3063 Cloud top
- *$1.3041/42 May13-2019 high/Intraday high
- *$1.3038 ***CURRENT MARKET PRICE 09:53GMT THURSDAY***
- *$1.3000/99/96 55-dma/61.8% 1.3381-1.2382/21-dma
- *$1.2991 May10-2019 low
- *$1.2985/80 50-dma/200-hma
- *$1.2970 May14-2019 high
- *$1.2964/59 100-hma/Cloud base
- *$1.2952/50 50-mma/200-wma
- *$1.2933 Intraday low
- *$1.2904 May14-2019 low
- *$1.2894 100-dma
- *$1.2882 Fibo 50% 1.3381-1.2382
EUR/GBP: MNI KEY LEVELS
- *Gbp0.9160 Upper Bollinger Band (3%)
- *Gbp0.9134 Sep11-2017 high
- *Gbp0.9123/24 Upper Boll Band (2%)/Upper 1.0% 10-dma env
- *Gbp0.9108 Jan03-2019 high
- *Gbp0.9101 Cloud top
- *Gbp0.9079 Cloud base
- *Gbp0.9068/71 Intraday high/50-dma
- *Gbp0.9062/64 Jan11-2019 high/55-dma
- *Gbp0.9053 100-dma
- *Gbp0.9048/51 Jul16-2019 high/21-dma, Jul17-2019 high
- *Gbp0.9047 ***CURRENT MARKET PRICE 09:53GMT THURSDAY***
- *Gbp0.9039 Jul18-2019 high
- *Gbp0.9030 200-hma
- *Gbp0.9010/09/06 Jul10-2019 high/100-hma/Intraday low
- *Gbp0.9005/00 Jul23-2019 high/Jul22-2019 high
- *Gbp0.8975 Lower Bollinger Band (2%)
- *Gbp0.8953 Jul23-2019 low
- *Gbp0.8943/38 Lower 1.0% 10-dma env/Lower Boll Band (3%)
- *Gbp0.8921 Jul02-2019 low
- *Gbp0.8916 200-dma
- *Gbp0.8874/73/72 Jun19-2019 low/Jun20-2019 low/Jun12-2019 low
USD/JPY: MNI KEY LEVELS
- *Y105.60 Upper 1.0% 10-dma envelope
- *Y105.42 55-dma
- *Y105.34 50-dma
- *Y105.19 Cloud base
- *Y105.07 Cloud Kijun Sen
- *Y104.97 21-dma
- *Y104.87 Jan03-2019 low
- *Y104.69 Cloud Tenkan Sen
- *Y104.62 100-hma
- *Y104.54/56/58 Intraday high/Mar26-2018 low/200-hma
- *Y104.24 ***CURRENT MARKET PRICE 09:53GMT THURSDAY***
- *Y104.20 Intraday low
- *Y104.01 Lower Bollinger Band (2%)
- *Y103.94 200-mma
- *Y103.55 Lower Bollinger Band (3%)
- *Y103.51 Lower 1.0% 10-dma envelope
- *Y102.46 Lower 2.0% 10-dma envelope
- *Y101.42 Lower 3.0% 10-dma envelope
- *Y101.20 Nov09-2016 low
- *Y101.19 YTD low
- *Y100.75 Sep30-2016 low
EUR/JPY: MNI KEY LEVELS
- *Y123.72 Fibo 61.8% 115.21-137.50
- *Y123.66 100-dma
- *Y123.54 Fibo 50% 109.57-137.50
- *Y123.51 May22-2019 high
- *Y123.47 21-dma
- *Y123.36 Cloud Kijun Sen
- *Y123.18 Jun11-2019 high
- *Y123.11 Fibo 50% 118.71-127.50
- *Y123.08 Fibo 38.2% 126.81-120.78
- *Y122.97/01 Intraday high/Jun12-2019 high
- *Y122.96 ***CURRENT MARKET PRICE 09:53GMT THURSDAY***
- *Y122.93 Cloud Tenkan Sen
- *Y122.57 200-hma
- *Y122.56 Jun13-2019 high
- *Y122.23 Jul12-2019 high
- *Y122.21 Intraday low
- *Y122.20 100-hma
- *Y122.13 Jun17-2019 high
- *Y122.07 Fibo 61.8% 118.71-127.50
- *Y121.95 Fibo 50% 94.12-149.78
- *Y121.92 Jun20-2019 high
AUD/USD: MNI KEY LEVELS
- *$0.7414 YTD Sep01 high
- *$0.7394 Dec04-2018 high
- *$0.7356 Dec05-2018 high
- *$0.7324 Upper 3.0% 10-dma envelope
- *$0.7311 Upper Bollinger Band (3%)
- *$0.7295 Jan31-2019 high
- *$0.7274 Dec06-2018 high
- *$0.7252/53 50-mma/Upper 2.0% 10-dma env
- *$0.7243/48 200-wma/Upper Boll Band (2%)
- *$0.7216 Intraday high
- *$0.7214 ***CURRENT MARKET PRICE 09:53GMT THURSDAY***
- *$0.7210/07 Cloud top/Feb21-2019 high
- *$0.7206 Apr17-2019 high
- *$0.7190 Cloud base
- *$0.7183/82/81 55-dma/Upper 1.0% 10-dma env/50-dma
- *$0.7153 Apr17-2019 low
- *$0.7145 Intraday low
- *$0.7140 Apr16-2019 low
- *$0.7124/23 100-dma/21-dma
- *$0.7116 Apr12-2019 low
- *$0.7110 Apr10-2019 low
USD/CAD: MNI KEY LEVELS
- *C$1.3300 Jun13-2019 low
- *C$1.3286 Jun20-2019 high
- *C$1.3266 Cloud top
- *C$1.3243 Cloud base
- *C$1.3236 200-hma
- *C$1.3224/26 100-hma, 50% 1.2783-1.3665/Jun10-2019 low
- *C$1.3203/06 55-dma/50-dma
- *C$1.3178/83 Intraday high, 50-mma/21-dma
- *C$1.3160/63/64 200-wma/Feb21-2019 low/Jul23-2019 high
- *C$1.3150/51 Feb20-2019 low/Jun20-2019 low
- *C$1.3127 ***CURRENT MARKET PRICE 09:53GMT THURSDAY***
- *C$1.3120/16 61.8% 1.2783-1.3665/Jul23-2019 low
- *C$1.3113 Feb25-2019 low
- *C$1.3107/04 Jun26-2019 low/Intraday low
- *C$1.3079 Lower 1.0% 10-dma envelope
- *C$1.3066 Fibo 38.2% 1.4690-1.2062
- *C$1.3053 Fibo 38.2% 1.2062-1.3665
- *C$1.3044 Lower Bollinger Band (2%)
- *C$1.3015 Oct25-2018 low
- *C$1.2975 Lower Bollinger Band (3%)
- *C$1.2970 Oct24-2018 low
Expiries for Nov6 NY cut 1000ET (Source DTCC)
EUR/USD: $1.1600(E1.8bln), $1.1690-00(E809mln), $1.1725-35(E1.1bln), $1.1795-05(E1.9bln), $1.1845-50(E1.1bln)
USD/JPY: Y104.89-00($1.4bln)
EUR/GBP: Gbp0.8980-00(E720mln)
USD/CNY: Cny6.62($810mln), Cny6.70($1.2bln)
Larger Option Pipeline
EUR/USD: Nov09 $1.1790-00(E1.1bln), $1.1900(E2.3bln-EUR calls); Nov10 $1.1800(E1.2bln); Nov11 $1.1650-55(E1.1bln)
USD/JPY: Nov10 Y103.00($1.1bln), Y103.75-80($1.1bln), Y104.50($2.3bln), Y105.00-05($1.1bln); Nov12 Y103.00($1.4bln), Y105.40-50($1.1bln)
EUR/AUD: Nov12 A$1.6520(E973mln)
To read the full story
Sign up now for free trial access to this content.
Please enter your details below.
Why MNI
MNI is the leading provider
of intelligence and analysis on the Global Fixed Income, Foreign Exchange and Energy markets. We use an innovative combination of real-time analysis, deep fundamental research and journalism to provide unique and actionable insights for traders and investors. Our "All signal, no noise" approach drives an intelligence service that is succinct and timely, which is highly regarded by our time constrained client base.Our Head Office is in London with offices in Chicago, Washington and Beijing, as well as an on the ground presence in other major financial centres across the world.
