
Why MNI
MNI is the leading provider
of intelligence and analysis on the Global Fixed Income, Foreign Exchange and Energy markets. We use an innovative combination of real-time analysis, deep fundamental research and journalism to provide unique and actionable insights for traders and investors. Our "All signal, no noise" approach drives an intelligence service that is succinct and timely, which is highly regarded by our time constrained client base.Our Head Office is in London with offices in Chicago, Washington and Beijing, as well as an on the ground presence in other major financial centres across the world.
FOREX SUMMARY
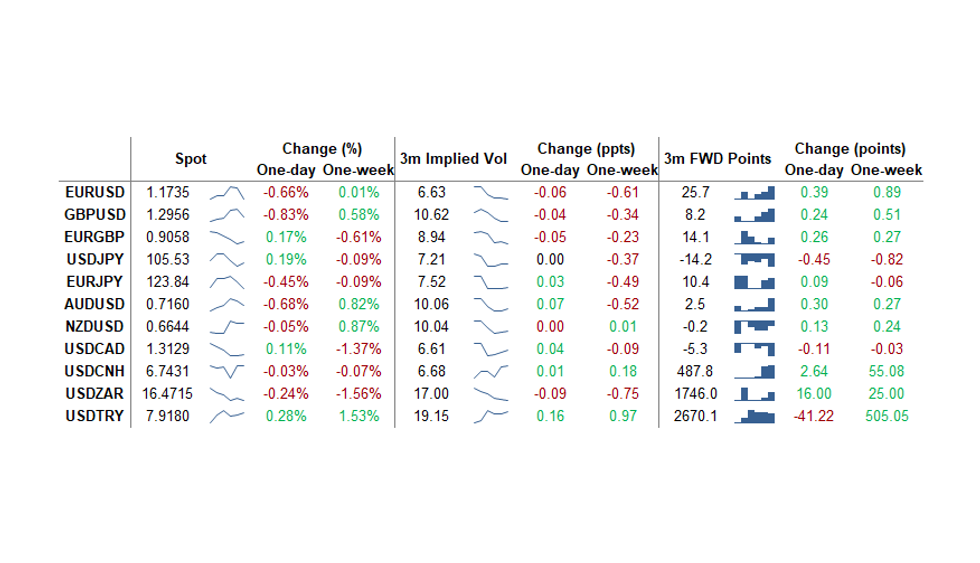
A busy afternoon session for FX, as the USD led direction.
- US CPI came out inline, and wasn't a driving factor.
- Stimulus related headlines remain key driver for assets: House Majority Leader Hoyer on MSNBC says Speaker Pelosi and Tsy Sec Mnuching" want to make a deal" says Pres Trump is "erratic, impulsive on talks"
- USD was bought across the board , testing high of the session versus the EUR, GBP, JPY, CHF, CAD, AUD, NOK and TRY,
- USDJPY printed a 105.63 high, still short of MNI resistance at 105.83 20-day EMA
- Cable dropped 20 pips initially, following EU Barnier noted that not enough progress has been made to enter tunnel negotiations..
- And came under renewed pressure following PM Boris spokesman, saying there's no fear in an Australian outcome.
- Cable fell to 2-day of low at 1.2922, breaking MNI tech support at 1.2939/31 20- day and 50-day EMA
- Looking ahead, Riksbank Inves, ECB de Cos and Fed Barkin are set to speak.
- Equities just now extending session lows -- trader say this may be related to/catching up with recent Apple headline:
- "CHINESE PLATFORMS CANCELED APPLE LIVESTREAM, NO REASON GIVEN" - Bl;oomberg
- - DJIA down 146.01 points (-0.51%) at 28749.96
- - S&P E-Mini Future down 32.25 points (-0.91%) at 3514.5
- - Nasdaq down 42.4 points (-0.4%) at 11907.39
TECHNICALS:
EUR-USD TECHS: Sharp Reversal Lower
- RES 4: 1.2011 High Sep 1 and major resistance
- RES 3: 1.1917 High Sep 10 and 76.4% of the Sep 1 - 25 sell-off
- RES 2: 1.1859 61.8% retracement of the Sep 1 - 25 sell-off
- RES 1: 1.1817/31 High Oct 13 / High Oct 10 and the bull trigger
- PRICE: 1.1738 @ 17:52 BST Oct 13
- SUP 1: 1.1725 Low Oct 7 and key near-term support
- SUP 2: 1.1685 Low Sep 30
- SUP 3: 1.1612/1581 Low Sep 25 and the bear trigger / Low Jul 24
- SUP 4: 1.1576 100-dma
EURUSD reversed course today selling off sharply. Attention turns to the near-term key support that lies at 1.1725, Oct 7 low. A break of this level would negate recent bullish signals and signal scope for deeper pullback, exposing support at 1.1612, Sep 25 low and the key bear trigger. If 1.1725 holds, attention will once again turn to key resistance at 1.1831, Oct 10 high. A break resumes recent bullish pressure.
GBP-USD TECHS: Finds Resistance At 1.3083
- RES 4: 1.2280 High Sep 7
- RES 3: 1.3174 61.8% retracement of the Sep 1 - 23 sell-off
- RES 2: 1.3139 Former trendline support drawn off the Mar 20 low
- RES 1: 1.3083 High Oct 12
- PRICE: 1.2962 @ 17:54 BST Oct 13
- SUP 1: 1.2939/31 20- day and 50-day EMA
- SUP 2: 1.2846 Low Oct 7 and key near-term support
- SUP 3: 1.2806 Low Sep 30
- SUP 4: 1.2745 Low Sep 28
GBPUSD maintains a bullish tone although the pair did find resistance Tuesday at 1.3083, Oct 12 high . Tuesday also saw Cable trade close to a key resistance at 1.3139. This marks the former trendline support that was breached on Sep 10. While 1.3139 remains intact, recent gains are likely a correction. A clear breach of 1.3139 is required to strengthen a bullish argument. The key support to watch lies at 1.2846, Oct 7 low.
EUR-GBP TECHS: Probes The Bear Trigger At 0.9025
- RES 4: 0.9190 61.8% retracement of the Sep 11 - 28 sell-off
- RES 3: 0.9162 High Oct 7 and the bull trigger
- RES 2: 0.9132 High Oct 10
- RES 1: 0.9079 High Oct 12
- PRICE: 0.9055 @ 17:57 BST Oct 13
- SUP 1: 0.9020 Low Oct 13
- SUP 2: 0.9000 Round number support
- SUP 3: 0.8967 76.4% retracement of the Sep 3 - 11 rally
- SUP 4: 0.8808 Low May 13
EURGBP traded lower Tuesday but did find support at the day low. The recent inability to hold above trendline resistance drawn off the Sep 11 high weighs on the cross with further weakness likely near-term. Key support at 0.9025, Sep 28 low has been probed. A clear break would confirm a resumption of bearish trending conditions and open 0.8967, a retracement level. On the upside, firm resistance is at 0.9162, Oct 7 high.
USD-JPY TECHS: Pullback Likely A Correction
- RES 4: 106.62 Bear channel resistance drawn off the Mar 24 high
- RES 3: 106.55 High Sep 3
- RES 2: 106.11/38 High Oct 7 and the bull trigger / High Sep 8
- RES 1: 105.83 20-day EMA
- PRICE: 105.53 @ 17:58 BST Oct 13
- SUP 1: 105.24 Low Oct 12
- SUP 2: 104.94 Low Oct 2 and key near-term support
- SUP 3: 104.41 Low Sep 22
- SUP 4: 104.00 Low Sep 21 and the bear trigger
USDJPY started this week on a softer note having found resistance last week at 106.11, Oct 7 low. Short-term weakness however is considered a correction following recent gains. Intraday momentum studies still point south however, to strengthen a bearish theme price needs to trade below key near-term support at 104.94, Oct 2 low. This would open 104.00, Sep 21 low. The bull trigger is at 106.11. A break resumes the recent uptrend.
EUR-JPY TECHS: Extends This Week's Sell-Off
- RES 4: 126.46 High Sep 10 and a key resistance
- RES 3: 125.77 High Sep 15
- RES 2: 125.09/28 High Oct 9 / 61.8% of the Sep 1 - 28 sell-off
- RES 1: 124.48 High Oct 13
- PRICE: 123.83 @ 18:03 BST Oct 13
- SUP 1: 123.31 Low Oct 5
- SUP 2: 123.03 Low Sep 29 and Oct 2 and key near-term support
- SUP 3: 122.38/28 Low Sep 28 / 61.8% of the Jun 22 - Sep 1 rally
- SUP 4: 122.25 38.2% retracement of the May - Sep rally
EURJPY is off recent highs and traded lower again Tuesday. While near term weakness is considered a correction, attention turns to support at 123.86, Oct 6 low that has been probed. A clear break would strengthen the intraday bearish tone and risk a deeper pullback towards support at 123.03, Sep 29 and Oct 2 low. The cross has defined resistance at 125.09, Oct 9 high where a break is required to resume recent bullish pressure.
AUD-USD TECHS: Pulls Away From Trendline Resistance
- RES 4: 0.7318 High Sep 21
- RES 3: 0.7258 61.8% retracement September Sell-Off
- RES 2: 0.7243 High Oct 10 and the intraday bull trigger
- RES 1: 0.7220 Trendline resistance drawn off the Sep 1 high
- PRICE: 0.7158 @ 18:03 BST Oct 13
- SUP 1: 0.7156 Low Oct 13
- SUP 2: 0.7096 Low Oct 7 and the near-term bear trigger
- SUP 3: 0.7070 Low Sep 29
- SUP 4: 0.7006 Low Sep 25 and the bear trigger
AUDUSD rallied Friday clearing resistance at 0.7209, Oct 1 and 6 high. This brought the pair into contact with trendline resistance drawn off the Sep 1 high. The line intersects at 0.7220 today. A move above Friday's high of 0.7243 is required to confirm a breach of the line and reinforce S/T bullish conditions, opening 0.7258, a Fibonacci retracement. Tuesday's print below support at 0.7161, Sep 9 low however signals a failure at the trendline.
USD-CAD TECHS: Outlook Remains Bearish
- RES 4: 1.3341 High Oct 7 and a reversal trigger
- RES 3: 1.3243 20-day EMA
- RES 2: 1.3273 High Oct 7 and key near-term resistance
- RES 1: 1.3202 Oct 9 high
- PRICE: 1.3134 @ 18:04 BST Oct 13
- SUP 1: 1.3099 Low Oct 13
- SUP 2: 1.3095 76.4% retracement of the Sep 1 - 30 rally
- SUP 3: 1.3038 Low Sep 2
- SUP 4: 1.2994 Low Sep 1
USDCAD edged lower again Tuesday, extending the pullback that started on Sep 30. The pair did however find support at the day low. Despite the bounce, the outlook remains bearish. Recent weakness follows the recent clear break of trendline support drawn off the Sep 1 low. 1.3157, a Fibonacci retracement has been cleared paving the way for a move towards the next retracement at 1.3095. Initial resistance is at Friday's high of 1.3202. Heavy!
LEVELS:
- $1.1996 Upper 2.0% 10-dma env, May14-2018 high
- $1.1934/38 Upper Boll Band (3%)/May15-2018 high
- $1.1878 Upper 1.0% 10-dma envelope
- $1.1870/72 Cloud top/Upper Boll Band (2%)
- $1.1851/56 Jun14-2018 high/100-mma
- $1.1815/17 Sep24-2018 high/Intraday high
- $1.1801 50-dma, 55-dma
- $1.1787 100-hma
- $1.1769 200-hma
- $1.1753/57 21-dma/Sep27-2018 high
- $1.1745 ***CURRENT MARKET PRICE 14:57ET TUESDAY***
- $1.1736/31 38.2% 1.3993-1.0341/Intraday low
- $1.1651 Sep28-2018 high
- $1.1643 Lower 1.0% 10-dma envelope
- $1.1630 Down Trendline from Jul18-2008
- $1.1624/21 Lower Boll Band (2%)/Oct16-2018 high
- $1.1613 161.8% swing $1.1497-1.1309
- $1.1598 Cloud base
- $1.1584 100-dma
- $1.1570 Jan10-2019 high
- $1.1562 Lower Bollinger Band (3%)
- $1.3072 Intraday high
- $1.3026/30 50-dma/55-dma
- $1.3013 Oct21-2019 high
- $1.3000 Oct22-2019 high
- $1.2991 100-hma
- $1.2985 Nov18-2019 high
- $1.2970 Nov19-2019 high, Nov21-2019 high
- $1.2959 200-hma
- $1.2950/51 50-mma/Nov28-2019 high
- $1.2940/44 200-wma/Nov29-2019 high
- $1.2938 ***CURRENT MARKET PRICE 14:57ET TUESDAY***
- $1.2922 Intraday low
- $1.2891 21-dma
- $1.2879 Nov29-2019 low
- $1.2867 Cloud base
- $1.2827/24 Nov27-2019 low/Nov22-2019 low
- $1.2821/17/16 Lower 1.0% 10-dma env/100-dma/Nov12-2019 low
- $1.2810 Fibo 61.8% 1.1841-1.4377
- $1.2769 Nov08-2019 low
- $1.2750 Oct17-2019 low, 100-wma
- $1.2712 200-dma
- Gbp0.9307 Aug29-2017 high
- Gbp0.9263 Upper 2.0% 10-dma envelope
- Gbp0.9244 Upper Bollinger Band (3%)
- Gbp0.9226 Sep04-2017 high
- Gbp0.9200/03 Upper Boll Band (2%)/Sep08-2017 high
- Gbp0.9172 Upper 1.0% 10-dma envelope
- Gbp0.9134 Sep11-2017 high
- Gbp0.9117 21-dma
- Gbp0.9108 Jan03-2019 high
- Gbp0.9081/82 Intraday high/200-hma
- Gbp0.9078 ***CURRENT MARKET PRICE 14:57ET TUESDAY***
- Gbp0.9075 100-hma
- Gbp0.9062/60/58 Jan11-2019 high/50-dma/55-dma
- Gbp0.9051/48 Jul17-2019 high/Jul16-2019 high
- Gbp0.9039/37 Jul18-2019 high/100-dma
- Gbp0.9027 Lower Bollinger Band (2%)
- Gbp0.9021/19 Cloud top/Intraday low
- Gbp0.9010 Jul10-2019 high
- Gbp0.9005/00 Jul23-2019 high/Jul22-2019 high
- Gbp0.8991 Lower 1.0% 10-dma envelope
- Gbp0.8983 Lower Bollinger Band (3%)
- Y106.46 100-dma
- Y106.20 Upper Bollinger Band (2%)
- Y106.18 Cloud top
- Y106.08 Cloud base
- Y105.79 50-dma
- Y105.75 55-dma
- Y105.70 100-hma
- Y105.65 200-hma
- Y105.63 Intraday high
- Y105.53 Cloud Tenkan Sen
- Y105.49 ***CURRENT MARKET PRICE 14:57ET TUESDAY***
- Y105.38 21-dma
- Y105.28 Intraday low
- Y105.19 Cloud Kijun Sen
- Y104.87 Jan03-2019 low
- Y104.56 Mar26-2018 low, Lower 1.0% 10-dma env
- Y104.55 Lower Bollinger Band (2%)
- Y104.14 Lower Bollinger Band (3%)
- Y103.94 200-mma
- Y103.50 Lower 2.0% 10-dma envelope
- Y102.44 Lower 3.0% 10-dma envelope
- Y124.80 55-dma
- Y124.79 50-mma
- Y124.59 100-hma
- Y124.48 Intraday high
- Y124.42 Cloud Kijun Sen
- Y124.34 200-hma, Apr01-2019 low
- Y124.25 May07-2019 high
- Y124.22 Fibo 38.2% 133.13-118.71
- Y124.14 Fibo 38.2% 118.71-127.50
- Y124.06 Cloud Tenkan Sen
- Y123.90 ***CURRENT MARKET PRICE 14:57ET TUESDAY***
- Y123.86/81 21-dma/Intraday low
- Y123.74 May21-2019 high
- Y123.72 Fibo 61.8% 115.21-137.50
- Y123.51 May22-2019 high
- Y123.45 Cloud base
- Y123.30 100-dma
- Y123.18 Jun11-2019 high
- Y123.11 Fibo 50% 118.71-127.50
- Y123.01 Jun12-2019 high
- Y122.97 Lower 1.0% 10-dma envelope
- $0.7295 Jan31-2019 high
- $0.7273/74 Cloud top/Dec06-2018 high
- $0.7263 50-mma
- $0.7241/45 Upper 1.0% 10-dma env/200-wma
- $0.7218 Intraday high
- $0.7209 50-dma
- $0.7205/06/07 55-dma/Apr17-2019 high/Feb21-2019 high
- $0.7188 100-hma
- $0.7173/74 200-hma/21-dma
- $0.7153 Apr17-2019 low
- $0.7153 ***CURRENT MARKET PRICE 14:57ET TUESDAY***
- $0.7150 Intraday low
- $0.7140 Apr16-2019 low
- $0.7124 Cloud base
- $0.7116 Apr12-2019 low
- $0.7110 Apr10-2019 low
- $0.7098 Lower 1.0% 10-dma envelope
- $0.7088/83 Apr08-2019 low/100-dma
- $0.7073/69 Mar29-2019 low/Apr30-2019 high
- $0.7057/53 Jul22-2019 high/Apr02-2019 low
- $0.7048/44 Jul04-2019 high, May07-2019 high/Jul16-2019 high
- C$1.3314 Nov29-2019 high
- C$1.3260/65 Nov27-2019 low/21-dma
- C$1.3255 Nov22-2019 low
- C$1.3234 55-dma
- C$1.3226 200-hma
- C$1.3220 50-dma
- C$1.3191 Nov19-2019 low
- C$1.3175 50-mma
- C$1.3161/63/64 Cloud base/200-wma/100-hma
- C$1.3147 Intraday high
- C$1.3141 ***CURRENT MARKET PRICE 14:57ET TUESDAY***
- C$1.3100/99 Lower 1.0% 10-dma env/Intraday low
- C$1.3085 Lower Bollinger Band (2%)
- C$1.3066 Fibo 38.2% 1.4690-1.2062
- C$1.3053 Fibo 38.2% 1.2062-1.3665
- C$1.3015 Oct25-2018 low
- C$1.2993 Lower Bollinger Band (3%)
- C$1.2970/67 Oct24-2018 low/Lower 2.0% 10-dma env
- C$1.2957 YTD low
- C$1.2933 Oct17-2018 low
- C$1.2917 Oct16-2018 low
Expiries for Oct14 NY cut 1000ET (Source DTCC)
- EUR/USD: $1.1750(E962mln), $1.1885-1.1900(E828mln)
- USD/JPY: Y104.95-105.00($835mln), Y105.15-20($1.1bln), Y105.50-55($750mln), Y105.75-80($641mln), Y106.00($1.4bln), Y106.19-20($1.3bln), Y106.45-50($660mln), Y107.25($750mln)
- AUD/USD: $0.7175-80(A$518mln)
-----------------------------------
Larger Option Pipeline
- EUR/USD: Oct15 $1.1800(E1.1bln), $1.1845-55(E1.1bln); Oct16 $1.1800(E2.2bln-E2.01bln of EUR calls)
- USD/JPY: Oct15 Y104.80-85($1.6bln), Y105.00-10($1.5bln), Y105.20-30($2.4bln), Y106.05-15($1.3bln); Oct16 Y104.50($1.5bln), Y105.00-04($1.3bln); Oct19 Y106.00($1.1bln); Oct20 Y106.35-44($2.3bln-USD calls); Oct21 Y106.00($1.2bln); Oct22 Y104.50-55($1.8bln), Y105.95-106.00($1.1bln)
- AUD/JPY: Oct22 Y76.44(A$2.1bln)
UP TODAY:
Why MNI
MNI is the leading provider
of intelligence and analysis on the Global Fixed Income, Foreign Exchange and Energy markets. We use an innovative combination of real-time analysis, deep fundamental research and journalism to provide unique and actionable insights for traders and investors. Our "All signal, no noise" approach drives an intelligence service that is succinct and timely, which is highly regarded by our time constrained client base.Our Head Office is in London with offices in Chicago, Washington and Beijing, as well as an on the ground presence in other major financial centres across the world.