
Why MNI
MNI is the leading provider
of intelligence and analysis on the Global Fixed Income, Foreign Exchange and Energy markets. We use an innovative combination of real-time analysis, deep fundamental research and journalism to provide unique and actionable insights for traders and investors. Our "All signal, no noise" approach drives an intelligence service that is succinct and timely, which is highly regarded by our time constrained client base.Our Head Office is in London with offices in Chicago, Washington and Beijing, as well as an on the ground presence in other major financial centres across the world.
EXECUTIVE SUMMARY
- MNI BRIEF: US Treasury Expects To Borrow USD844B By Yearend
- MNI INTERVIEW: Price Plunge Improves US Factory Outlook -ISM
US
US: U.S. manufacturers are growing more optimistic about the outlook after energy and metals prices plunged in July, and data suggest the sector should be able to sustain moderate growth levels through year-end, Institute for Supply Management chair Timothy Fiore told MNI Monday.
- The July measure of prices paid for materials used in the production process plunged 18.5pps to the lowest level since August 2020, marking the largest drop since 2010 as crude oil and metals prices fell. Almost 22% of those surveyed reported paying lower prices in July, up from 8% the previous month, while the number of firms reporting higher prices dropped 23pps to 42%. For more see MNI Policy main wire at 1307ET.
- Treasury is assuming a cash balance of approximately USD650 billion at the end of September. For the fourth quarter, Treasury expects to borrow USD400 billion, assuming an end-of-December cash balance of USD700 billion. The Treasury's quarterly refunding, which is expected to show coupon cuts, will be released at 8:30 a.m. August 3.
- The Treasury's third quarter financing estimates were adjusted due to the Federal Reserve's SOMA redemptions. During the second quarter, the U.S. borrowed USD7 billion and ended the quarter with a USD782 billion cash balance.
US TSYS: ISM Prices Paid Falls
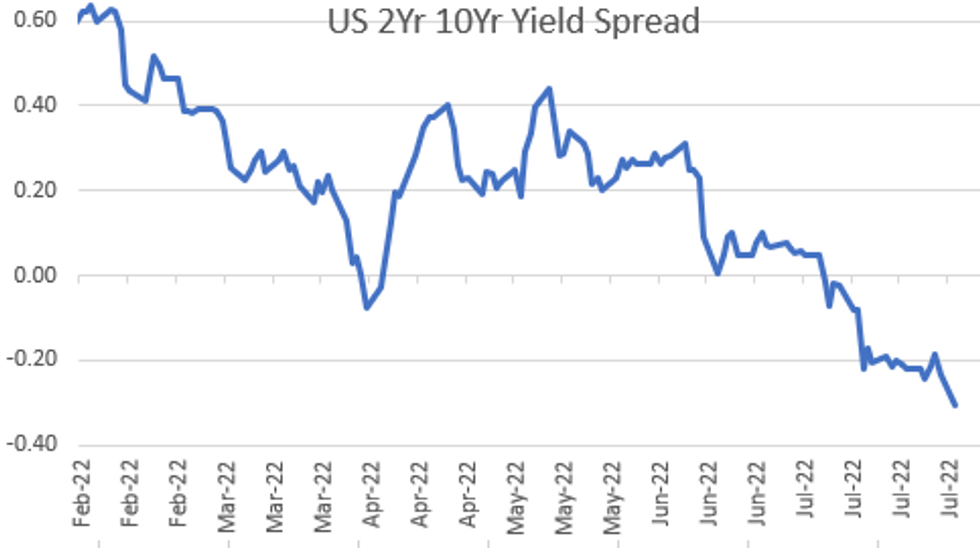
Tsys holding narrow range, near session highs for the last few hours, decent volumes (TYU >1.18M), curves flatter with short end underperforming: 2s10s -31.676 inverted low just off last week's 22Y low of -32.142.
- Data headwinds: The US ISM Manufacturing PMI edged down a modest 0.2pp to 52.8 in July, but stronger than the forecast of 52.0. Read is lowest since June 2020 and the second consecutive month of decline. Metric remains in expansive territory above the 50-point threshold.
- Substantial fall was seen in the prices paid index: -18.5 points to 60.0, the lowest since Aug'20. This is a much slower price growth. Volatility in commodity markets underscores this steep decline, with a significant 21.5% of respondents paying less in July (compared to June).
- Meanwhile, June construction spending declined -1.1% vs. +0.1% estimate, carry-over slowdown in economic data from last week a headwind for more aggressive Fed pricing at the Sep 21 FOMC.
- First-half block buys in 5s helped kick off the early bid, preceded duration neutral 5s30s flattener (-12,000 FVU 113-20 vs. +3,300 USU 144-10.)
- Limited data on tap for Tuesday: JOLTS Job Openings (10.994M est) and vehicle sales throughout the day. Larger focus on Friday's July employment data (+250k est vs. +372k prior).
- Cross assets: spot Gold +4.75 at 1770.69, Crude weaker: WTI -4.49 at 94.13, stocks mildly weaker ESU2 -10.50 at 4122.75.
- Currently, 2-Yr yield is up 1.6bps at 2.9005%, 5-Yr is down 1.7bps at 2.6592%, 10-Yr is down 5.4bps at 2.5947%, and 30-Yr is down 9.2bps at 2.9175%
OVERNIGHT DATA
- US ISM JUL MANUF PURCHASING MANAGERS INDEX 52.8 vs. 53.0 prior
- US ISM JUL MANUF PRICES PAID INDEX 60.0 vs. 78.5 prior
- US ISM JUL MANUF NEW ORDERS INDEX 48.0 vs. 49.2 prior
- US ISM JUL MANUF EMPLOYMENT INDEX 49.9 vs. 47.3 prior
- US ISM JUL MANUF PRODUCTION INDEX 53.5 vs. 54.9 prior
- A substantial fall was seen in the prices paid index, which plunged 18.5 points to 60.0, the lowest since August 2020. This is a much slower price growth. Volatility in commodity markets underscores this steep decline, with a significant 21.5% of respondents paying less in July (compared to June).
- New orders weakened for the second consecutive month in July, declining by 1.2 points (vs 0.2 point decline anticipated).
- Softer demand has concerns about excess inventory growing and lead times remain at record highs.
- The employment index saw a 1.7-point increase to 49.0, remaining contractionary for the third consecutive month. Hiring rates remain robust, yet quitting rates remain high.
- This data is in line with moves seen in the S&P Global PMI and regional PMIs and highlights an evident slowing of demand in the US manufacturing industry. The ISM index saw a brief knee-jerk reaction for markets.
- Persistent supply chain disruptions, a backdrop of global economic instability and looming recessionary fears see outlooks remaining subdued for the time being, however the plunge in the prices paid index hints at easing inflationary pressures going forward.
- US JUN CONSTRUCT SPENDING -1.1% vs. +0.1% est
- US JUN PRIVATE CONSTRUCT SPENDING -1.3%
- US JUN PUBLIC CONSTRUCT SPENDING -0.5%
- US JUL FINAL S&P MANUF. PMI 52.2R (FLSH 52.3); JUN 52.7
MARKETS SNAPSHOT
Key late session market levels:
- DJIA down 4.28 points (-0.01%) at 32830.64
- S&P E-Mini Future down 11 points (-0.27%) at 4121.25
- Nasdaq down 21.6 points (-0.2%) at 12366.29
- US 10-Yr yield is down 5.6 bps at 2.5929%
- US Sep 10Y are up 10/32 at 121-14.5
- EURUSD up 0.0036 (0.35%) at 1.0254
- USDJPY down 1.63 (-1.22%) at 131.66
- WTI Crude Oil (front-month) down $4.73 (-4.8%) at $93.99
- Gold is up $5.07 (0.29%) at $1770.98
- EuroStoxx 50 down 1.48 points (-0.04%) at 3706.62
- FTSE 100 down 10.01 points (-0.13%) at 7413.42
- German DAX down 4.42 points (-0.03%) at 13479.63
- French CAC 40 down 11.64 points (-0.18%) at 6436.86
US TSY FUTURES CLOSE
- 3M10Y -1.207, 22.502 (L: 16.479 / H: 32.157)
- 2Y10Y -6.779, -30.959 (L: -31.676 / H: -22.408)
- 2Y30Y -10.506, 1.416 (L: 0.993 / H: 14.178)
- 5Y30Y -7.291, 25.824 (L: 24.693 / H: 34.911)
- Current futures levels:
- Sep 2Y down 0.25/32 at 105-7.125 (L: 105-05.125 / H: 105-08.5)
- Sep 5Y up 4.25/32 at 113-27.5 (L: 113-19.75 / H: 113-31.75)
- Sep 10Y up 9.5/32 at 121-14 (L: 120-27 / H: 121-19)
- Sep 30Y up 26/32 at 144-26 (L: 142-29 / H: 145-00)
- Sep Ultra 30Y up 58/32 at 160-4 (L: 156-01 / H: 160-06)
US 10Y FUTURES TECH: (U2) Key Resistance Cleared
- RES 4: 123-13+ 1.764 proj of the 14 - 23 - 28 price swing
- RES 3: 122-29+ High Mar 31
- RES 2: 121-28+ 1.382 proj of the 14 - 23 - 28 price swing
- RES 1: 121-18 High Aug 01
- PRICE: 121-16+ @ 15:41 BST Aug 01
- SUP 1: 119-19+/118-23+ Low Jul 27 / 50-day EMA
- SUP 2: 117-14+ Low Jul 21 and key near-term support
- SUP 3: 116-11 Low Jun 28
- SUP 4: 115-20 Low Jun 17
Treasuries traded higher to begin the week and cleared resistance at 120-16+, the Jul 6 high and bull trigger. The outlook is bullish and the break higher has confirmed a resumption of the current bull cycle. The contract has also established a bullish price sequence of higher highs and higher lows. This opens 121-28+ next, a Fibonacci projection. On the downside, the 50-day EMA, at 118-23+, is a firm support. Key support is at 117-14+, the Jul 21 low.
US EURODOLLAR FUTURES CLOSE
- Sep 22 -0.010 at 96.690
- Dec 22 +0.005 at 96.360
- Mar 23 -0.010 at 96.520
- Jun 23 -0.020 at 96.720
- Red Pack (Sep 23-Jun 24) -0.02 to +0.015
- Green Pack (Sep 24-Jun 25) +0.030 to +0.045
- Blue Pack (Sep 25-Jun 26) +0.050 to +0.055
- Gold Pack (Sep 26-Jun 27) +0.065 to +0.075
SHORT TERM RATES
US DOLLAR LIBOR: Latest settlements
- O/N -0.01000 to 2.31157% (+0.75700/wk)
- 1M +0.00457 to 2.36686% (+0.11000/wk)
- 3M +0.01385 to 2.80214% (+0.02200/wk) * / **
- 6M +0.04628 to 3.37614% (+0.00700/wk)
- 12M +0.03485 to 3.74214% (-0.10700/wk)
- * Record Low 0.11413% on 9/12/21; ** New 3.5Y high: 2.80586% on 7/27/22
- Daily Effective Fed Funds Rate: 2.32% volume: $86B
- Daily Overnight Bank Funding Rate: 2.31% volume: $240B
- Secured Overnight Financing Rate (SOFR): 2.27%, $949B
- Broad General Collateral Rate (BGCR): 2.25%, $374B
- Tri-Party General Collateral Rate (TGCR): 2.25%, $365B
- (rate, volume levels reflect prior session)
FED Reverse Repo Operation
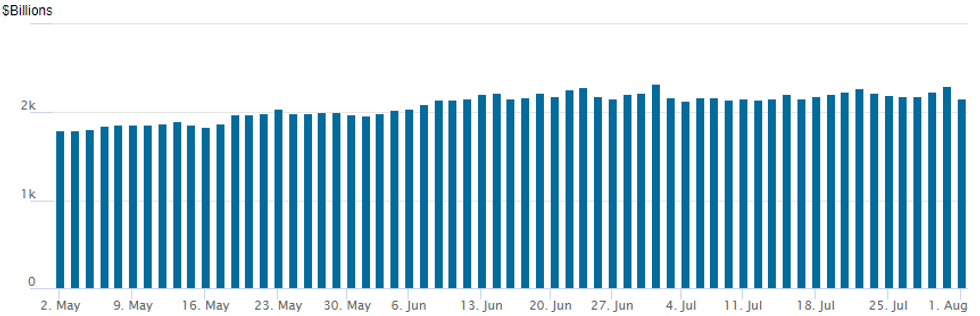
NY Federal Reserve/MNI
New month underway, NY Fed reverse repo usage falls to $2,161.885B w/ 103 counterparties vs. $2,300.200B prior session. Record high still stands at $2,329.743B from Thursday June 30.
PIPELINE: $5.5B Apple 4Pt, %5B UBS 3Pt Launched
Apple issuance well off prior, still in the top 10 list of largest debt issuance in the past 10 year, issuing $17B over several tranches on April 30, 2013 (not to mention $8.5B in May 2004). Meanwhile, UBS $5B 3pt unexpectedly large- Date $MM Issuer (Priced *, Launch #)
- 08/01 $5.5B #Apple $1B 7Y +63, $1.5B 10Y +78, $1.75B 30Y +105, $1.25B 40Y +118
- 08/01 $5B #UBS $1.75B 3NC2 +160, $1.75B 5NC4 +205, $1.5B 11NC10 +240
- 08/01 $800M #Consumers Energy WNG $350M 10Y +100, $450M 30Y +125
- 08/01 $Benchmark Edison International 2Y +165a, 3Y +195a
- 08/01 $750M #Huntington Bancshares 6NC5 +177
- 08/01 $Benchmark State Street Corp 11NC10 +180
- 08/01 $650M #NY Life 3Y +78
- 08/01 $1.5B #Colgate-Palmolive $500M each: 3Y +30, 5Y +45, 10Y +75
FOREX: USD Index Extends Losing Streak, JPY Strength In Focus
- After a volatile open to the week, the greenback overall traded with a greater sense of calm over the US session as markets prepare themselves for Friday’s US Employment data. With this said, the USD index (-0.40%) looks set to post its fourth consecutive losing session, extending the dollar’s downward momentum seen throughout the second half of July.
- The largest moves have once again been in the Japanese Yen. Despite Friday’s bounce in USDJPY, the pair succumbed to further selling pressure on Monday, making fresh lows below the 132 handle. The move appears to be a continuation of dynamics that were in play towards the back end of last week, with participants exiting short JPY positions amid the recent trimming of hawkish Fed bets.
- Further weakness throughout the US session saw USDJPY narrow the gap with key support at 131.50, the Jun 16 low and despite the pair bouncing roughly 35 pips ahead of the APAC crossover, it remains down 1% on the day around 131.95.
- While losses for the greenback were fairly broad based, there were some notable divergences across G10, with the Canadian dollar particularly weak on Monday. CAD is down 0.45% and the weakness can be largely attributed to the pressure on crude prices with WTI futures falling 5%. In similar vein, the Chinese Yuan is weaker on Monday amid a softer than expected manufacturing PMI released out of China since Friday’s close and ongoing political tensions centred around a potential trip from the US speaker to Taiwan.
- On the other hand, NZD (+0.80%) outperforms and the kiwi may have been helped by AUD/NZD sales in response to the weak Chinese data. The Antipodean cross slid below the NZ$1.1100 mark, with activity in Australia limited by a New South Wales holiday.
- The focus on Tuesday will be on the RBA. The continued tightening of the labour market, level of inflation and expected acceleration in price pressures through year-end means that the RBA will likely lift its cash rate target by 50bp at its meeting on Tuesday.
- Later in the week, the Bank of England have a monetary policy decision on Thursday before Friday’s US employment data.
Tuesday Data Calendar
| Date | GMT/Local | Impact | Flag | Country | Event |
| 02/08/2022 | 0130/1130 | * |  | AU | Building Approvals |
| 02/08/2022 | 0130/1130 | ** | | AU | Lending Finance Details |
| 02/08/2022 | 0430/1430 | *** | | AU | RBA Rate Decision |
| 02/08/2022 | 0600/0700 | * |  | UK | Nationwide House Price Index |
| 02/08/2022 | 0900/1000 | ** | | UK | Gilt Outright Auction Result |
| 02/08/2022 | - | *** |  | US | Domestic-Made Vehicle Sales |
| 02/08/2022 | 1255/0855 | ** | | US | Redbook Retail Sales Index |
| 02/08/2022 | 1400/1000 | | US | Chicago Fed's Charles Evans | |
| 02/08/2022 | 1400/1000 | ** | | US | housing vacancies |
| 02/08/2022 | 1400/1000 | ** | | US | JOLTS jobs opening level |
| 02/08/2022 | 1400/1000 | ** | | US | JOLTS quits Rate |
| 02/08/2022 | 1700/1300 | | US | Cleveland Fed's Loretta Mester | |
| 02/08/2022 | 2245/1845 | | US | St. Louis Fed's James Bullard |
Why MNI
MNI is the leading provider
of intelligence and analysis on the Global Fixed Income, Foreign Exchange and Energy markets. We use an innovative combination of real-time analysis, deep fundamental research and journalism to provide unique and actionable insights for traders and investors. Our "All signal, no noise" approach drives an intelligence service that is succinct and timely, which is highly regarded by our time constrained client base.Our Head Office is in London with offices in Chicago, Washington and Beijing, as well as an on the ground presence in other major financial centres across the world.