
Why MNI
MNI is the leading provider
of intelligence and analysis on the Global Fixed Income, Foreign Exchange and Energy markets. We use an innovative combination of real-time analysis, deep fundamental research and journalism to provide unique and actionable insights for traders and investors. Our "All signal, no noise" approach drives an intelligence service that is succinct and timely, which is highly regarded by our time constrained client base.Our Head Office is in London with offices in Chicago, Washington and Beijing, as well as an on the ground presence in other major financial centres across the world.
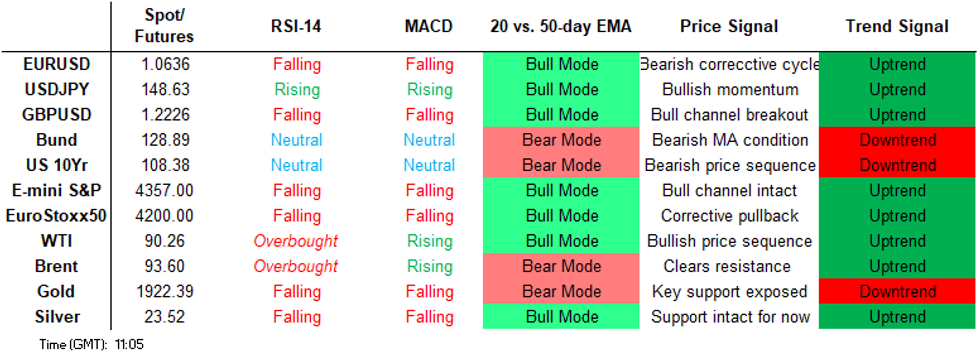
Price Signal Summary - Bund Futures Clear Support
- A bear cycle in the E-mini S&P contract remains in play and price is trading lower today. Last Thursday’s sell-off resulted in a break of support at 4397.75, the Aug 18 low, reinforcing bearish conditions. Sights are on 4318.00 next, the Jun 2 low. Initial firm resistance is 4496.68, the 50-day EMA. {EU} EUROSTOXX 50 futures maintain a softer tone following last week’s move lower and, today’s extension lower reinforces current conditions. The focus is on 4163.00, the 1.00 projection of the Aug 10 - 18 - 30 price swing. Key short-term resistance has been defined at 4359.00, the Sep 15 high. Initial firm resistance is at 4288.70, the 20-day EMA.
- In FX, the EURUSD trend condition is bearish and the pair traded to a fresh cycle low last week. The recent breach of 1.0632, the Sep 14 low, confirms a resumption of the downtrend and maintains the bearish price sequence of lower lows and lower highs. Sights are on 1.0611, 38.2% of the Sep’22 - Jul’23 upleg. Initial firm resistance is 1.0732, the 20-day EMA. GBPUSD remains in a clear downtrend and the pair is trading lower today. Support at 1.2308, the May 25 low, was breached last week. This confirms a resumption of the bear trend and maintains the bearish price sequence of lower lows and lower highs. The focus is on 1.2177, 2.382 projection of the Jul 14 - 24 - 27 price swing. Initial firm resistance is seen at 1.2425, the Sep 19 high. Short-term gains would be considered corrective. The USDJPY trend needle continues to point north and the pair has traded to a fresh cycle high today. The focus is on 148.85, the Oct 31 2022 high. Moving average studies remain in a bull mode position, highlighting the market's positive sentiment. Further out, scope is seen for a climb towards the 150.00 handle. On the downside, firm support lies at 145.91, the Sep 11 low.
- Initial support is at 147.12, the 20-day EMA.
- On the commodity front, Gold traded higher last Wednesday but quickly pulled back from the session high. The recent breach of the 50-day EMA does highlight a possible developing bullish threat. Key resistance is at $1953.0, the Sep 1 high where a break is required to confirm a bullish theme. $1901.1, the Sep 14 low, marks a key near-term support. A breach of this level would strengthen a bearish theme and expose $1884.9, the Aug 21 low. In the oil space, the uptrend in WTI futures is intact, however, the contract remains in a short-term bearish corrective cycle. The trend condition is overbought and a move lower would allow this to unwind. The first key support is at $86.90, the 20-day EMA and is a potential short-term objective. On the upside, clearance of $92.43, the Sep 19 high, would confirm a resumption of the uptrend and open $93.31, the 1.00 projection of the Jun 28 - Aug 10 - 24 price swing.
- In the FI space, Bund futures have started the week on a bearish note, extending the current bear cycle. The contract breached support last week at 129.72, the Aug 14 low and a key bear trigger. The break reinforced a bearish theme and confirmed a resumption of the primary downtrend. Sights are on 128.45 next, a Fibonacci projection. Key short-term resistance has been defined at 131.49, the Sep 14 high. Initial firm resistance is at 130.52, the 20-day EMA. Gilt futures remain above last week’s low. On Sep 20 , the contract breached resistance at 96.49, the Sep 14 high. The break confirms a resumption of the bull cycle that started Aug 17 and this opens the 97.00 handle. Key short-term support has been defined at 94.64, the Sep 18 low. A reversal lower and a break of this support would threaten the bullish condition and expose 94.05, the Sep 11 low.
FOREIGN EXCHANGE
EURUSD TECHS: Heading South
- RES 4: 1.1005 High Aug 11
- RES 3: 1.0945 High Aug 30 and reversal trigger
- RES 2: 1.0819 50-day EMA
- RES 1: 1.0732/69 20-day EMA / High Sep 12
- PRICE: 1.0649 @ 05:48 BST Sep 25
- SUP 1: 1.0611 38.2% of the Sep’22 - Jul’23 upleg
- SUP 2: 1.0551 Low Mar 16
- SUP 3: 1.0516 Low Mar 15 and a key support
- SUP 4: 1.0484 Low Jan 6
The EURUSD trend condition is bearish and the pair traded to a fresh cycle low last week. The recent breach of 1.0632, the Sep 14 low, confirms a resumption of the downtrend and maintains the bearish price sequence of lower lows and lower highs. Moving average studies are in a bear mode position, highlighting current sentiment. Sights are on 1.0611, a Fibonacci retracement. Initial firm resistance is 1.0732, the 20-day EMA.
GBPUSD TECHS: Trading At Its Recent Lows
- RES 4: 1.2746 High Aug 30 and key resistance
- RES 3: 1.2581 50-day EMA
- RES 2: 1.2548 High Sep 11 and Low Aug 25
- RES 1: 1.2351/2425 High Sep 21 / High Sep 19
- PRICE: 1.2222 @ 10:04 BST Sep 25
- SUP 1: 1.2218 Intraday high
- SUP 2: 1.2177 2.382 projection of the Jul 14 - 24 - 27 price swing
- SUP 3: 1.2120 76.4% retracement of the Mar 8 - Jul 14 bull leg
- SUP 4: 1.2028 Low Mar 16
GBPUSD remains in a clear downtrend and the pair is trading lower today. Support at 1.2308, the May 25 low, was breached last week. The move down confirms a resumption of the bear trend and maintains the bearish price sequence of lower lows and lower highs. The focus is on 1.2177, a Fibonacci projection. On the upside, initial firm resistance is seen at 1.2425, the Sep 19 high. Short-term gains would be considered corrective.
EURGBP TECHS: Trades Through Trendline Resistance
- RES 4: 0.8768 High May 5
- RES 3: 0.8736 50.0% retracement of the Feb 3 - Aug 23 downleg
- RES 2: 0.8719 High May 23
- RES 1: 0.8701 High Jul 19 and a key resistance
- PRICE: 0.8700 @ 06:18 BST Sep 25
- SUP 1: 0.8627 Low Sep 21
- SUP 2: 0.8600/8569 50-day EMA / Low Sep 15 and a key support
- SUP 3: 0.8558 Low Sep 11
- SUP 4: 0.8524 Low Sep 06
A short-term bull cycle in EURGBP remains in play and the cross traded to a fresh high Friday. Price has recently breached resistance at 0.8611, the Aug 30 high, and the continuation higher has resulted in a move above 0.8677, trendline resistance drawn from the Feb 3 high and a key hurdle for bulls. A clear break of the trendline would strengthen bullish conditions. On the downside, firm support lies at 0.8569, the Sep 15 low.
USDJPY TECHS: Northbound
- RES 4: 149.71 High Oct 24 2022
- RES 3: 149.10 High Oct 25 2022
- RES 2: 148.85 High Oct 31 2022
- RES 1: 148.60 2.236 projection of the Jul 14 - 21 - 28 price swing
- PRICE: 148.35 @ 06:33 BST Sep 25
- SUP 1: 147.12/145.91 20-day EMA / Low Sep 11
- SUP 2: 145.26 50-day EMA
- SUP 3: 144.45 Low Sep 1 and key support
- SUP 4: 143.30 Low Aug 10
The USDJPY trend needle continues to point north and the pair has traded to a fresh cycle high today. The focus is on 148.60 next, a Fibonacci projection. Moving average studies remain in a bull mode position, highlighting the market's positive sentiment. Further out, scope is seen for a climb towards the 150.00 handle. On the downside, firm support lies at 145.91, the Sep 11 low.
EURJPY TECHS: Remains Above The 50-Day EMA
- RES 4: 160.66 2.382 proj of the May 11 - 29 - 31 price swing
- RES 3: 160.00 Psychological handle
- RES 2: 159.92 2.236 proj of the May 11 - 29 - 31 price swing
- RES 1: 158.65/159.76 High Sep 13 / High Aug 30 and the bull trigger
- PRICE: 157.91 @ 06:54 BST Sep 25
- SUP 1: 156.59 Low Sep 11 and a key support
- SUP 2: 156.35 Low Aug 8
- SUP 3: 155.54 Low Aug 3
- SUP 4: 154.61 61.8% retracement of the Jul 28 - Aug 30 rally
EURJPY continues to trade inside a range. Key support to watch is the 50-day EMA - at 157.13 which has recently been pierced. A clear breach of it would undermine the uptrend and highlight a possible short-term reversal that would expose 155.54, Aug 3 low. The bull trigger is unchanged at 159.76, Aug 30 high where a break would resume the uptrend and open 160.66, a Fibonacci projection. First resistance is 158.65, the Sep 13 high.
AUDUSD TECHS: Trend Signals Remain Bearish
- RES 4: 0.6630 High Aug 2
- RES 3: 0.6616 High Aug 16
- RES 2: 0.6522 High Aug 30 and Sep 1, and the key resistance
- RES 1: 0.6502 50-day EMA
- PRICE: 0.6419 @ 07:01 BST Sep 25
- SUP 1: 0.6357 Low Sep 6 and the bear trigger
- SUP 2: 0.6287 2.00 proj of the Jun 16 - Jun 29 - Jul 13 price swing
- SUP 3: 0.6272 Low Nov 3 2022 and a key support
- SUP 4: 0.6215 2.236 proj of the Jun 16 - Jun 29 - Jul 13 price swing
AUDUSD remains below resistance The trend condition is unchanged and remains bearish. Key support and the bear trigger at 0.6365, the Aug 17 low, has recently been pierced. A clear break of this level would confirm a resumption of the downtrend and open 0.6272, the Nov 3 2022 low. Key short-term resistance has been defined at 0.6522, the Aug 30 and Sep 1 high. A break would signal a likely short-term trend reversal.
USDCAD TECHS: Short-Term Gains Considered Corrective
- RES 4: 1.3805 High Mar 24
- RES 3: 1.3709 Trendline resistance drawn from the Oct 13 2022 high
- RES 2: 1.3593/95 High Sep 12 / 7 and key resistance
- RES 1: 1.3519 20-day EMA
- PRICE: 1.3483 @ 07:23 BST Sep 25
- SUP 1: 1.3381 Low Sep 19
- SUP 2: 1.3323 61.8% retracement of the Jul 14 - Sep 7 bull leg
- SUP 3: 1.3266 Low Aug 2
- SUP 4: 1.3235 76.4% retracement of the Jul 14 - Sep 7 bull leg
USDCAD maintains a softer tone despite its latest gains. Last week’s move down resulted in a break of 1.3490, the Sep 1 low and this was followed by a clear breach of the 50-day EMA, at 1.3474. The move lower reinforces a bearish theme and signals scope for a deeper retracement. The focus is on 1.3323 next, a Fibonacci retracement. Initial firm resistance has been defined at 1.3519, the 20-day EMA.
FIXED INCOME
BUND TECHS: (Z3) Trend Direction Remains Down
- RES 4: 132.91 High Aug 8
- RES 3: 132.78 High Sep 1
- RES 2: 131.82 High Sep 4
- RES 1: 129.51/131.49 20-day EMA / High Sep 14
- PRICE: 129.10 @ 10:02 BST Sep 25
- SUP 1: 129.00 Round number support
- SUP 2: 128.45 1.236 proj of the Jul 19 - Aug 4 - Aug 8 price swing
- SUP 3: 127.92 1.382 proj of the Jul 19 - Aug 4 - Aug 8 price swing
- SUP 4: 127.50 1.50 proj of the Jul 19 - Aug 4 - Aug 8 price swing
Bund futures have started the week on a bearish note, extending the current bear cycle. The contract breached support last week at 129.72, the Aug 14 low and a key bear trigger. The break reinforced a bearish theme and confirmed a resumption of the primary downtrend. Sights are on 129.00 next. On the upside, key short-term resistance has been defined at 131.49, the Sep 14 high. Initial firm resistance is at 130.52, the 20-day EMA.
BOBL TECHS: (Z3) Trend Needle Points South
- RES 4: 116.890 High Sep 8 and a key near-term resistance
- RES 3: 116.350/740 20-day EMA / High Sep 14
- RES 2: 116.210 High Sep 18
- RES 1: 116.150 High Sep 22
- PRICE: 115.900 @ 05:27 BST Sep 25
- SUP 1: 115.540 Low Sep 21
- SUP 2: 115.450 1.50 proj of the Sep 8 - 13 - 14 price swing
- SUP 3: 115.349 1.618 proj of the Sep 8 - 13 - 14 price swing
- SUP 4: 115.223 1.764 proj of the Sep 8 - 13 - 14 price swing
Bobl futures remain in a clear downtrend and last week’s breach of 116.00, the Aug 15 low and key support, reinforces a bearish theme. The break lower confirmed a resumption of the downtrend and signals scope for weakness towards 115.450 next, a Fibonacci projection. On the upside, firm short-term resistance has been defined at 116.740, the Sep 14 high. Clearance of this hurdle would signal a possible short-term base.
SCHATZ TECHS: (Z3) Trend Needle Points South
- RES 4: 105.170 High Sep 14 and a key short-term resistance
- RES 3: 105.097 20-day EMA
- RES 2: 105.010 Low Sep 13
- RES 1: 104.980 High Sep 22
- PRICE: 104.915 @ 05:41 BST Sep 25
- SUP 1: 104.765 Low Sep 21
- SUP 2: 104.720 2.00 proj of the Aug 24 - 30 - Sep 1 price swing
- SUP 3: 104.645 Low Jul 12 (cont)
- SUP 4: 104.620 Low Jul 11 (cont)
Schatz futures maintain a bearish tone and last week’s move lower reinforces this condition. The recent break of support at 105.130, the Sep 7 low, confirmed a resumption of the downtrend and has maintained the current bearish price sequence of lower lows and lower highs. The focus is on 104.720, a Fibonacci projection. Firm resistance has been defined at 105.170, the Sep 14 high. Short-term gains are considered corrective.
GILT TECHS: (Z3) Trend Structure Is Bullish
- RES 4: 97.68 1.00 proj of the Aug 17 - Sep 1 - Sep 6 price swing
- RES 3: 97.57 High Jul 24(cont)
- RES 2: 97.00 Round number resistance
- RES 1: 96.71 High Sep 20
- PRICE: 96.07 @ Close Sep 22
- SUP 1: 95.15/94.64 Low Sep 21 / 18
- SUP 2: 94.05 Low Sep 11
- SUP 3: 93.36 Low Sep 6 and a key support
- SUP 4: 93.00 Round number support
Gilt futures remain above last week’s low. On Sep 20 , the contract breached resistance at 96.49, the Sep 14 high. The break of this hurdle confirms a resumption of the bull cycle that started Aug 17 and this opens the 97.00 handle. Key short-term support has been defined at 94.64, the Sep 18 low. A reversal lower and a break of this support would threaten the bullish condition and expose 94.05, the Sep 11 low.
BTP TECHS: (Z3) Outlook Remains Bearish
- RES 4: 117.48/60 High Jul 19 / Jun 26 and key resistance (cont)
- RES 3: 116.86 High Jul 24 (cont)
- RES 2: 115.56 High Aug 24 and a bull trigger
- RES 1: 112.89/113.84 20-day EMA / High Sep 14 and key resistance
- PRICE: 111.33 @ Close Sep 22
- SUP 1: 110.77 3.00 proj of the Aug 24 - 28 - 31 price swing
- SUP 2: 110.00 Round number support
- SUP 3: 109.18 4.00 proj of the Aug 24 - 28 - 31 price swing
- SUP 4: 108.36 Low Dec 30 2022 (cont)
The Sep 15 sharp sell-off in BTP futures cancelled a recent bullish threat and the continuation lower confirms a resumption of the downtrend. Today’s bearish start to this week’s session reinforces this theme too. The focus is on 110.77, a Fibonacci projection. Key short-term resistance has been defined at 113.84, the Sep 14 high. A break would highlight a possible base. Initial firm resistance is at 112.89, the 20-day EMA.
US 10YR FUTURE TECHS: (Z3) Bears Remain In The Driver’s Seat
- RES 4: 111-12+ High Sep 1 key resistance
- RES 3: 110-26 50-day EMA
- RES 2: 110-07+ High Sep14
- RES 1: 109-03/109-25+ Low Sep 13 / 20-day EMA
- PRICE: 108-14 @ 11:12 BST Sep 22
- SUP 1: 108-16 Low Sep 21
- SUP 2: 108-00 Round number support
- SUP 3: 107.23 1.236 proj of the Jul 18 - Aug 4 - Aug 10 price swing
- SUP 4: 107-05+ 1.382 proj of the Jul 18 - Aug 4 - Aug 10 price swing
Treasuries maintain a softer tone and gains are considered corrective. This week’s move down has resulted in a breach of 109-03, the Sep 13 / 19 low. The move below 109-03 cancels a recent reversal signal - a hammer candle on Sep 13, and this reinforces a bearish theme. A continuation lower would open 108-00 and 107-23, the 1.236 projection of the Jul 18 - Aug 4 - Aug 10 price swing. Key S/T resistance has been defined at 110-07+, Sep 14 high.
EQUITIES
EUROSTOXX50 TECHS: (Z3) Clears Key Support
- RES 4: 4446.00 High Aug 10
- RES 3: 4409.60 61.8% retracement of the Jul 31 - Sep 8 downleg
- RES 2: 4388.00 High Aug 30 and key resistance
- RES 1: 4288.70/4359.00 20-day EMA / High Sep 15
- PRICE: 4195.00 @ 10:11 BST Sep 25
- SUP 1: 4163.00 1.00 proj of the Aug 10 - 18 - 30 price swing
- SUP 2: 4142.80 61.8% retracement of the Mar 20 - Jul 31 climb (cont)
- SUP 3: 4109.90 1.236 proj of the Aug 10 - 18 - 30 price swing
- SUP 4: 4095.00 Low Mar 28 (cont)
Eurostoxx 50 futures maintain a softer tone following last week’s move lower and, today’s extension lower reinforces current conditions. Key support at 4210.00, the Sep 8 low, has been breached. The clear break confirms a resumption of the downtrend that started late July and paves the way for a move towards 4163.00, a Fibonacci projection. Key short-term resistance has been defined at 4359.00, the Sep 15 high. A break would be bullish.
E-MINI S&P TECHS: (Z3) Bear Threat Still Present
- RES 4: 4673.50 High Aug 1
- RES 3: 4617.40 76.4% retracement of the Jul 27 - Aug 18 sell-off
- RES 2: 4566.00/4597.50 High Sep 15 / 1 and a near-term bull trigger
- RES 1: 4447.00/4502.22 High Sep 21 / 50-day EMA
- PRICE: 4358.00 @ 10:20 BST Sep 25
- SUP 1: 4347.25 Intraday low
- SUP 2: 4318.00 Low Jun 2
- SUP 3: 4300.62 50.0% retracement of the Mar 13 - Jul 27 bull cycle
- SUP 4: 4259.00 Low May 31
A bear cycle in S&P E-minis remains in play and last week’s break lower reinforced current conditions. Price is also trading lower today. Last Thursday’s sell-off resulted in a break of support at 4397.75, the Aug 18 low. This breach reinforces bearish conditions and signals scope for a continuation lower. Sights are on 4318.00 next, the Jun 2 low. Initial firm resistance is 4496.68, the 50-day EMA.
COMMODITIES
BRENT TECHS: (X3) Short-Term Corrective Phase Still In Play
- RES 4: $100.50 - 1.00 proj of Jun 23 - Aug 10 - Aug 24 price swing
- RES 3: $100.00 - Key psychological round number
- RES 2: $96.95 - High Nov 14 2022 (cont)
- RES 1: $95.96 - High Sep 19
- PRICE: $93.72 @ 07:00 BST Sep 25
- SUP 1: $90.89 - 20-day EMA
- SUP 2: $87.37/86.81 - High Aug 10 / 50-day EMA
- SUP 3: $81.61 - Low Aug 24
- SUP 4: $77.84 - Low Jul 17
The uptrend in Brent futures remains intact, however, resistance last week forced price lower and the Sep 19 trend high of $95.96, remains intact. The trend condition is overbought and a corrective cycle lower would allow this condition to unwind. Initial key support lies at $90.89, the 20-day EMA. On the upside, a move above $95.96 would confirm a resumption of the uptrend and open $96.95, the Nov 14 2022 high (cont).
WTI TECHS: (X3) Overbought Condition Unwinding
- RES 4: $97.08 - 1.236 proj of the Jun 28 - Aug 10 - 24 price swing
- RES 3: $95.00 - Round number resistance
- RES 2: $93.31 - 1.00 proj of the Jun 28 - Aug 10 - 24 price swing
- RES 1: $92.43 - High Sep 19
- PRICE: $90.35 @ 07:05 BST Sep 25
- SUP 1: $86.58 - 20-day EMA
- SUP 2: $83.49/82.32 - High Aug 10 / 50-day EMA
- SUP 3: $77.32 - Low Aug 24
- SUP 4: $73.40 - Low Jul 17
The uptrend in WTI futures remains intact, however, the contract remains in a short-term bearish corrective cycle. The trend condition is overbought and a move lower would allow this to unwind. The first key support to watch lies at $86.90, the 20-day EMA and is a potential short-term objective. On the upside, clearance of $92.43, the Sep 19 high, would confirm a resumption of the uptrend and open $93.31, a Fibonacci projection.
GOLD TECHS: Remains Below Last Week’s High
- RES 4: $1987.5 - High Jul 20 and a key resistance
- RES 3: $1963.3 - 76.4% retracement of the Jul 20 - Aug 21 bear leg
- RES 2: $1953.0 - High Sep 1 and key resistance
- RES 1: $1947.5 - High Sep 20
- PRICE: $1921.6 @ 07:05 BST Sep 25
- SUP 1: $1901.1 - Low Sep 14
- SUP 2: $1884.9 - Low Aug 21 and the bear trigger
- SUP 3: $1871.6 - Low Mar 13
- SUP 4: $1865.8 - 76.4% retracement of the Feb 28 - May 4 bull leg
Gold traded higher last Wednesday but quickly pulled back from the session high. The recent breach of the 50-day EMA does highlight a possible developing bullish threat. Key resistance is at $1953.0, the Sep 1 high where a break is required to confirm a bullish theme. On the downside, $1901.1, the Sep 14 low, marks a key near-term support. A breach of this level would strengthen a bearish theme and expose $1884.9, the Aug 21 low.
SILVER TECHS: Corrective Cycle Extends
- RES 4: $26.135 - High May 5 and a bull trigger
- RES 3: $26.267 - High Jul 20 and a key resistance
- RES 2: $25.014/149 - High Aug 30 / High Jul 27
- RES 1: $24.020 - High Sep 5
- PRICE: $23.522 @ 07:54 BST Sep 25
- SUP 1: $22.301 - Low Sep 14
- SUP 2: $22.227 - Low Aug 15 and key support
- SUP 3: $22.111 - Low Jun 23 and a bear trigger
- SUP 4: $21.375 - 76.4% retracement of the Mar 10 - May 5 rally
Silver maintains a softer tone despite the recent recovery which - for now - appears to be a correction. The metal has recently cleared $23.413, the Aug 23 low. The break signalled scope for a deeper pullback and a continuation lower would open $22.227, the Aug 15 low. For bulls, a stronger reversal would refocus attention on resistance at $25.014 and $26.267, the Aug 30 and Jul 20 highs respectively. First resistance is at $24.020, the Sep 5 high.
Why MNI
MNI is the leading provider
of intelligence and analysis on the Global Fixed Income, Foreign Exchange and Energy markets. We use an innovative combination of real-time analysis, deep fundamental research and journalism to provide unique and actionable insights for traders and investors. Our "All signal, no noise" approach drives an intelligence service that is succinct and timely, which is highly regarded by our time constrained client base.Our Head Office is in London with offices in Chicago, Washington and Beijing, as well as an on the ground presence in other major financial centres across the world.