
Why MNI
MNI is the leading provider
of intelligence and analysis on the Global Fixed Income, Foreign Exchange and Energy markets. We use an innovative combination of real-time analysis, deep fundamental research and journalism to provide unique and actionable insights for traders and investors. Our "All signal, no noise" approach drives an intelligence service that is succinct and timely, which is highly regarded by our time constrained client base.Our Head Office is in London with offices in Chicago, Washington and Beijing, as well as an on the ground presence in other major financial centres across the world.
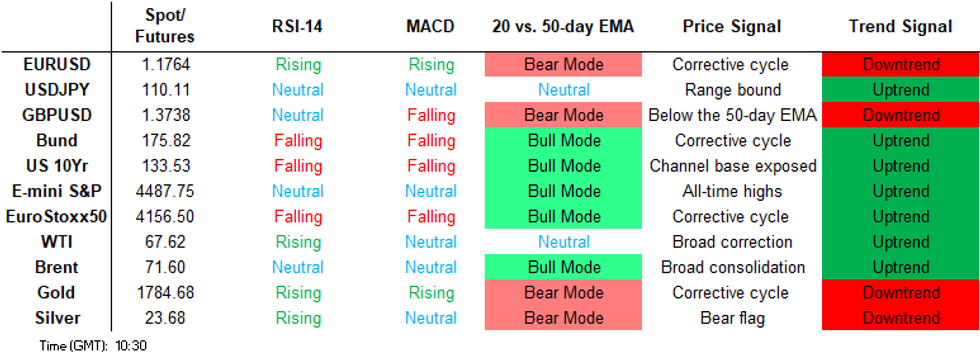
Price Signal Summary - Interest Rates Climb
- On the equity front, S&P E-minis are consolidating at recent highs. This week's climb to a fresh all-time high confirms a resumption of the uptrend and attention turns to the 4500.00 handle. EUROSTOXX 50 key support has been defined at 4078.00, Aug 19 low. The outlook is bullish while this level holds.
- In the FX space, the USD remains in an uptrend and this week's weakness is still considered corrective. EURUSD last week cleared 1.1704, Mar 31 low. This opens 1.1621 next, 1.00 projection of the Jan 6 - Mar 31 - May 25 price swing. Firm resistance to watch is 1.1805, Aug 13 high. GBPUSD remains vulnerable despite Monday's strong bounce. The focus is on the bear trigger at 1.3572, Jul 20 low. Resistance is at 1.3786, Aug 18 high. The Aug 20 price pattern in USDCAD is a bearish shooting star candle and Monday's weak close reinforces the bearish pattern. An extension would expose 1.2515, the 50-day EMA.
- On the commodity front, Gold maintains a bullish tone following this week's breach of its 50-day EMA. The break signals scope for a climb towards $1834.1, Jul 15 high and a bull trigger. WTI futures support has been defined at $61.74, Aug 23 low. Note, Monday's price action was a bullish engulfing reversal candle, highlighting a positive short-term theme. Further gains would open $69.39. Aug 12 high.
- In FI, Bunds support at 176.21, Aug 11 low was cleared yesterday highlighting a short-term bearish theme. The focus is on 175.37, the 50-day EMA. Gilt futures appear vulnerable following yesterday's sell-off. An extension lower would open 128.03, Jul 6 low (cont).
FOREIGN EXCHANGE
EURUSD TECHS: Corrective Bounce Extends
- RES 4: 1.1909 High Jul 30
- RES 3: 1.1833 50-day EMA
- RES 2: 1.1805 High Aug 13 and key short-term resistance
- RES 1: 1.1784 High Aug 17
- PRICE: 1.1764 @ 06:02 BST Aug 26
- SUP 1: 1.1664 Low Aug 20 and the bear trigger
- SUP 2: 1.1621 1.00 proj of the Jan 6 - Mar 31 - May 25 price swing
- SUP 3: 1.1603 Low Nov 4, 2020
- SUP 4: 1.1495 High Mar 9, 2020
EURUSD is holding onto the bulk of recent gains and traded higher Wednesday. The recent bounce is considered corrective and trend conditions remain bearish. Last week's move below 1.1704, Mar 31 low confirms a resumption of the downtrend and opens 1.1603 next, the Nov 4, 2020 low. Below here, the immediate post pandemic highs at 1.1495 would attract and also represents pivot support. Key short-term resistance is at 1.1805.
GBPUSD TECHS: Retracement Mode
- RES 4: 1.3983/90 High Jul 30 / 61.8% of the Jun 1 - Jul 20 sell-off
- RES 3: 1.3916 High Aug 9
- RES 2: 1.3839 50-day EMA
- RES 1: 1.3786 High Aug 18
- PRICE: 1.3755 @ 06:05 BST Aug 26
- SUP 1: 1.3694/02 Low Aug 24 / Low Aug 20
- SUP 2: 1.3572 Low Jul 20 and the bear trigger
- SUP 3: 1.3520 Low Jan 18
- SUP 4: 1.3452 Low Jan 11
GBPUSD traded sharply higher Monday and is extending this week's climb. A bearish theme still dominates though, following last week's sell-off that reinforced a bearish condition. Price is trading below the 50-day EMA and attention is on key support at 1.3572, Jul 20 low. For bulls, a convincing recovery back above the 50-day EMA at 1.3839 is required to ease the current bearish pressure. Initial resistance is at 1.3786, Aug 18 high.
EURGBP TECHS: Trading Below Recent Highs
- RES 4: 0.8670 High Jul 20 and key resistance
- RES 3: 0.8659 High Jul 21
- RES 2: 0.8618 76.4% retracement of the Jul 20 - Aug 10 sell-off
- RES 1: 0.8592/94 100-dma / High Aug 23
- PRICE: 0.8553 @ 06:10 BST Aug 26
- SUP 1: 0.8535 20-day EMA
- SUP 2: 0.8506 Low Jul 19
- SUP 3: 0.8484 Low Aug 16
- SUP 4: 0.8450 Low Aug 10 and a key support
EURGBP is trading below recent highs. Last week the cross traded back through both the 20- and 50-day EMAs. This signals scope for further gains near-term. Attention is on the 100-dma next at 0.8593 that was briefly probed Monday. Gains are still considered corrective though and from a trend perspective, the outlook is bearish. A return lower and a break of initial firm support at 0.8506, Aug 19 low would signal a resumption of bearish pressure.
USDJPY TECHS: Caught In A Range
- RES 4: 111.66 High Jul 2 and the bull trigger
- RES 3: 110.82 High Jul 7
- RES 2: 110.80 High Aug 11 and a key resistance
- RES 1: 110.46 High Aug 13
- PRICE: 109.99 @ 06:12 BST Aug 26
- SUP 1: 109.41 Low Aug 24
- SUP 2: 109.11/108.72 Low Aug 16 / Low Aug 04 and the bear trigger
- SUP 3: 108.56 Low May 25
- SUP 4: 108.47 76.4% of the Apr 23 - Jul 2 rally
USDJPY is firmer but still trades in a range. Despite recent gains, the pair appears vulnerable and attention is on the key support at 108.72, Aug 4 low. A breach of this level would strengthen a bearish case and expose the 108.47 Fibonacci retracement. For bulls, key near-term resistance is unchanged at 110.80, Aug 11 high. A break would ease bearish concerns and instead open key resistance at 111.66, Jul 2 high.
EURJPY TECHS: Approaching The 50-Day EMA
- RES 4: 131.09 High Jul 13
- RES 3: 130.56 High Jul 29
- RES 2: 130.02 50-day EMA
- RES 1: 129.76 Intraday high
- PRICE: 129.39 @ 06:15 BST Aug 26
- SUP 1: 128.60 Low Aug 24
- SUP 2: 127.94 Low Aug 19
- SUP 3: 127.88 38.2% retracement of the Oct '20 - Jun rally
- SUP 4: 127.31 Low Feb 17
EURJPY trend conditions remain bearish. From a short-term perspective though the cross continues to trade higher as the current correction extends. Further gains would open 129.71, Aug 16 high ahead of 130.02, the 50-day EMA. A clear break of the 50-day EMA is required to suggest scope for a stronger recovery. On the downside, key support has been defined at 127.94, Aug 19 low. A break would resume the downtrend.
AUDUSD TECHS: Bounce Considered Corrective
- RES 4: 0.7427 High Aug 4 and a key resistance
- RES 3: 0.7389 High Aug 11
- RES 2: 0.7341 High Aug 17
- RES 1: 0.7290 Low Jul 21 and a recent breakout level
- PRICE: 0.7263 @ 06:20 BST Aug 26
- SUP 1: 0.7201/7106 Low Aug 24 /Low Aug 20 and the bear trigger
- SUP 2: 0.7053 38.2% retracement of the Mar '20 - Feb uptrend
- SUP 3: 0.6991 Low Nov 2, 2020
- SUP 4: 0.6921 Low Jul 14, 2020
AUDUSD traded higher again Wednesday and maintains this week's firm tone. Gains however are considered corrective. The breach of 0.7290 last week confirmed an extension of the bearish price sequence of lower lows and lower highs, reinforcing the current downward cycle. Price has also cleared 0.7200 and this opens 0.7053 further out, a Fibonacci retracement. Initial firm resistance is seen at 0.7290, low Jul 21.
USDCAD TECHS: Weaker Tone Maintained
- RES 4: 1.3029 High Nov 25, 2020
- RES 3: 1.2976 1.00 proj of the Jun 23 - Jul 19 - 30 price swing
- RES 2: 1.2957 High Dec 21, 2020
- RES 1: 1.2834/ 2949 High Aug 23 / High Aug 20 and the bull trigger
- PRICE: 1.2619 @ 06:28 BST Aug 26
- SUP 1: 1.2579 Low Aug 24
- SUP 2: 1.2515 50-day EMA
- SUP 3: 1.2422 Jul 30 low
- SUP 4: 1.2303 Low Jul 6
USDCAD traded sharply lower Monday and maintains a bearish short-term tone. From a pattern perspective, activity on Aug 20 is a bearish shooting star candle. Monday's sell-off and particularly the weak close, reinforces this pattern and highlights a short-term reversal. Price has traded below the 20-day EMA and this opens 1.2515, the 50-day EMA. Key resistance has been defined at 1.2949.
FIXED INCOME
BUND TECHS: (U1) Deeper Corrective Pullback
- RES 4: 177.69 1.764 proj of the May 19 - Jun 11 - Jun 22 price swing
- RES 3: 177.61 High Aug 05 and the bull trigger
- RES 2: 177.24 High Aug 17 and 19
- RES 1: 176.87 High Aug 25
- PRICE: 175.97 @ 05:20 BST Aug 26
- SUP 1: 175.62 Low Jul 26
- SUP 2: 175.37 50-day EMA
- SUP 3: 174.83 Trendline support drawn from the May 19 low
- SUP 4: 174.64 50.0% retracement of the Jul 22 - Aug 5 rally
Bund futures traded sharply lower yesterday The contract has moved below its 20-day EMA and support at 176.21, Aug 11 low. The break lower suggests scope for a deeper short-term corrective pullback with attention on the 50-day EMA that intersects at 175.37. On the upside, price would need to move above yesterday's high of 176.87 to ease the current bearish pressure. This would open 177.24, the Aug 17 and 19 high.
BOBL TECHS: (U1) Trades Through Its 20-Day EMA
- RES 4: 135.700 High Dec 11, 2020 (cont)
- RES 4: 135.640 High Aug 05 and the bull trigger
- RES 3: 135.430 High Aug 20 a key near-term resistance
- RES 2: 135.340 Aug 25 high
- PRICE: 135.140 @ 05:33 BST Aug 26
- SUP 1: 135.030 Low Jul 26
- SUP 2: 134.962 50-day EMA
- SUP 3: 134.710 High Aug 7
- SUP 4: 134.591 Trendline support drawn from the May 20 low
Bobl futures traded lower yesterday. This resulted in a break of the 20-day EMA and support at 135.140, the Aug 13 low. The break lower signals potential for a deeper corrective pullback and opens the 50-day EMA that intersects at 134.962. On the upside, initial key resistance has been defined at 135.430, Aug 20 high. A break would reinstate a bullish theme and open 135.640, Aug 5 high and the bull trigger.
SCHATZ TECHS: (U1) Approaching Support
- RES 4: 112.425 2.618 proj of the Jun 22 - Jul 8 - Jul 13 price swing
- RES 3: 112.415 High Aug 05 and the bull trigger
- RES 2: 112.390 High Aug 6:
- RES 1: 112.350 High Aug 20 and key near-term resistance
- PRICE: 112.305 @ 05:19 BST Aug 26
- SUP 1: 112.295 Low Aug 13 and 16
- SUP 2: 112.282 50-day EMA
- SUP 3: 112.245 Low Jul 21
- SUP 4: 112.210 Low Jul 20
Schatz futures are weaker following yesterday's sell-off. The contract has traded through its 20-day EMA exposing support at 112.295, the Aug 13 and 16 low and the 50-day EMA at 112.282. A clear break of the average is required to suggest scope for a deeper short-term pullback. On the upside, initial firm resistance has been refined at 112.350, Aug 20 high where a break is needed to ease the developing bearish risk.
GILT TECHS: (Z1) Corrective Pullback
- RES 4: 130.72 High Aug 4 and the bull trigger (cont)
- RES 3: 130.53 High Aug 5 (cont)
- RES 2: 129.35 High Aug 20 and a key near-term resistance
- RES 1: 129.09 High Aug 25
- PRICE: 128.49 @ Close Aug 25
- SUP 1: 128.33 Low Aug 12
- SUP 2: 129.22 Low Aug 6 (cont)
- SUP 3: 128.79 Low Jul 16 (cont)
- SUP 4: 128.54 Low Jul 14 (cont)
Gilt futures traded lower yesterday and attention is on initial support at 128.33, the Aug 12 low. A break of this support would suggest scope for a deeper pullback. This would open a key near-term support at 129.22 (cont), the Aug 6 low. A breach of this support would strengthen a bearish case and note that it would also highlight a move below the 50-day EMA on the continuation chart. Key near-term resistance has been defined at 129.35.
BTP TECHS: (U1) Bull Channel Breakout
- RES 4: 157.71 High Aug 5 and the bull trigger
- RES 3: 155.43 High Aug 13
- RES 2: 155.11 High Aug 25
- RES 1: 154.63 Former channel support drawn off the May 19 low
- PRICE: 153.84 @ Close Aug 25
- SUP 1: 153.60/56 50-day EMA / Intraday low
- SUP 2: 153.14 Low Jul 22
- SUP 3: 152.84 50.0% retracement of the May 25 - Aug 5 rally
- SUP 4: 152.66 Low Jul 15
BTP futures traded lower yesterday. The contract cleared a key support at 154.54 marking a recent low and importantly the base of a bull channel drawn off the May 19 low. The bearish breakout signals scope for a deeper corrective pullback and attention is on the 50-day EMA at 153.60. A clear break of the average is required to suggest scope for further downside. Initial resistance is at the trendline - at 154.63 today.
EQUITIES
EUROSTOXX 50 TECHS: (U1) Consolidating
- RES 4: 4294.20 1.236 proj of the May 13 - Jun 17 - Jul 19 price swing
- RES 3: 4267.43 2.0% 10-dma envelope
- RES 2: 4238.50 High Aug 13 and the bull trigger
- RES 1: 4200.60 76.4% retracement of the Aug 13 - 19 sell-off
- PRICE: 4173.50 @ 06:02 BST Aug 25
- SUP 1: 4078.00 Low Aug 19 and the bear trigger
- SUP 2: 4026.20 76.4% retracement of the Jul 19 - Aug 13 rally
- SUP 3: 3944.00 Low Jul 21
- SUP 4: 3895.00 Low Jul 19
EUROSTOXX 50 futures are consolidating and continue to trade closer to recent highs. Gains since Aug 19 suggest the sell-off between Aug 13 - 19 has been a correction and that this correction is over. A key support has been defined at 4078.00, Aug 19 low. While it holds, scope is seen for an extension higher and a retest of 4238.50, the Aug 13 high and bull trigger. On the downside, a break of 4078.00 would instead reinstate a bearish theme.
E-MINI S&P (U1): Bullish Trend Conditions Remain Intact
- RES 4: 4580.21 1.382 proj of Jun 21 - Jul 14 - 19 price swing
- RES 3: 4542.58 1.236 proj of Jun 21 - Jul 14 - 19 price swing
- RES 2: 4500.00 Round number resistance
- RES 1: 4498.00 High Aug 25
- PRICE: 4487.00 @ 06:39 BST Aug 26
- SUP 1: 4431.18 20-day EMA
- SUP 2: 4357.58 50-day EMA
- SUP 3: 4347.75 Low Aug 19 and the bear trigger
- SUP 4: 4224.00 Low Jul 19 and key support
S&P E-minis are consolidating. The outlook remains bullish and the contract traded to a fresh all-time high Monday of 4485.75. The move higher confirms a resumption of the uptrend. The contract's recent recovery from 4347.75, Aug 19 low means the 50-day EMA remains intact. This average intersects at 4362.89 and represents a key support area. A clear break of the 50-day EMA is required to signal a short-term reversal. Bullish.
COMMODITIES
BRENT TECHS: (V1) Sharp Reversal Extends
- RES 4: $75.65 - High Jul 30
- RES 3: $74.50 - Bear channel top drawn off the Jul 6 high
- RES 2: $73.55 - High Aug 3
- RES 1: $72.42 - High Aug 25
- PRICE: $71.79 @ 06:35 BST Aug 26
- SUP 1: $70.29/$68.53 - 20-day EMA / Low Aug 24
- SUP 2: $64.60 - Low Aug 23
- SUP 3: $63.89 - Low May 21 and a key support
- SUP 4: $63.43 - 1.236 proj of the Jul 6 - 20 - 30 price swing
Brent futures rallied Monday and bulls have not looked back. The recovery this week has defined a key short-term support at $64.60, Aug 23 low where a break is required to reinstate a bearish theme. Short-term, the outlook remains bullish and Monday's price pattern was a bullish engulfing candle. Further gains would open $73.55, the Aug 3 high ahead of $74.44, a bear channel top drawn off the Jul 6 high.
WTI TECHS: (V1) Holding Onto Gains
- RES 4: $71.29 - High Aug 3
- RES 3: $70.74 - 764.% retracement of the Jul 30 - Aug 23 sell-off
- RES 2: $69.39 - High Aug 12 and key near-term resistance
- RES 1: $68.54 - High Aug 25
- PRICE: $68.06 @ 07:00 BST Aug 26
- SUP 1: $65.41 - Low Aug 24
- SUP 2: $61.74 - Low Aug 23
- SUP 3: $60.81 - 1.236 proj of the Jul 6 - 20 - 30 price swing
- SUP 4:$60.68 - Low May 21
WTI futures have rallied this week and remain firm. The recovery from Monday's low has defined a key short-term support at $61.74, Aug 23 low where a break is required to reinstate a bearish theme. Short-term, the outlook appears bullish and Monday's price pattern was a bullish engulfing candle, highlighting a reversal. The contract has traded above the 50-day EMA. This opens $69.39, Aug 12 high.
GOLD TECHS: Bullish Conditions Intact
- RES 4: $1863.3 - High Jun 16
- RES 3: $1853.3 - 61.8% retracement of the Jun 1 - 29 decline
- RES 2: $1834.1 - High Jul 15 and the bull trigger
- RES 1: $1809.6 - High Aug 23
- PRICE: $1786.3 @ 07:13 BST Aug 26
- SUP 1: $1774.5 - Low Aug 19
- SUP 2: $1751.7 - Low Aug 13
- SUP 3: $1717.8 - Low Aug 10
- SUP 4: $1690.6 - Low Aug 08 and the bear trigger
Gold maintains a bullish tone. The yellow metal traded higher Monday and in the process cleared the 50-day EMA at $1796.50. The break confirms a resumption of the upleg that started Aug 9. This signals scope for a climb towards resistance at $1834.1, Jul 15 high and a bull trigger. On the downside, initial support has been defined at $1774.5, Aug 19 low. A move below this support would be bearish and signal a short-term reversal.
SILVER TECHS: Outlook Remains Bearish
- RES 4: $26.467 - High Jul 14
- RES 3: $26.002 - High Aug 04 and a key resistance
- RES 2: $24.952 - 50-day EMA
- RES 1: $24.060 - 20-day EMA
- PRICE: $23.720 @ 07:17 BST Aug 26
- SUP 1: $22.626 - Low Aug 09 and the bear trigger
- SUP 2: $21.899 - Low Nov 30, 2020
- SUP 3: $20.871 - 50% retracement of the Mar '20 - Jan '21 rally
- SUP 4: $20.000 - Psychological round number
Silver has traded higher this week but remains vulnerable. Moving average conditions continue to highlight a bearish theme and note too that price action since Aug 9 still appears to be a flag - a bearish formation. A break and close below the Aug 9 low of $22.626 would confirm a resumption of bearish pressure and open a key Fibonacci support at 20.871, 50% of the Mar '20 - Feb '21 range. The 20-day EMA at $24.060 marks resistance.
Why MNI
MNI is the leading provider
of intelligence and analysis on the Global Fixed Income, Foreign Exchange and Energy markets. We use an innovative combination of real-time analysis, deep fundamental research and journalism to provide unique and actionable insights for traders and investors. Our "All signal, no noise" approach drives an intelligence service that is succinct and timely, which is highly regarded by our time constrained client base.Our Head Office is in London with offices in Chicago, Washington and Beijing, as well as an on the ground presence in other major financial centres across the world.