
Why MNI
MNI is the leading provider
of intelligence and analysis on the Global Fixed Income, Foreign Exchange and Energy markets. We use an innovative combination of real-time analysis, deep fundamental research and journalism to provide unique and actionable insights for traders and investors. Our "All signal, no noise" approach drives an intelligence service that is succinct and timely, which is highly regarded by our time constrained client base.Our Head Office is in London with offices in Chicago, Washington and Beijing, as well as an on the ground presence in other major financial centres across the world.

Price Signal Summary - EUROSTOXX 50 Bearish Engulfing Still In Play
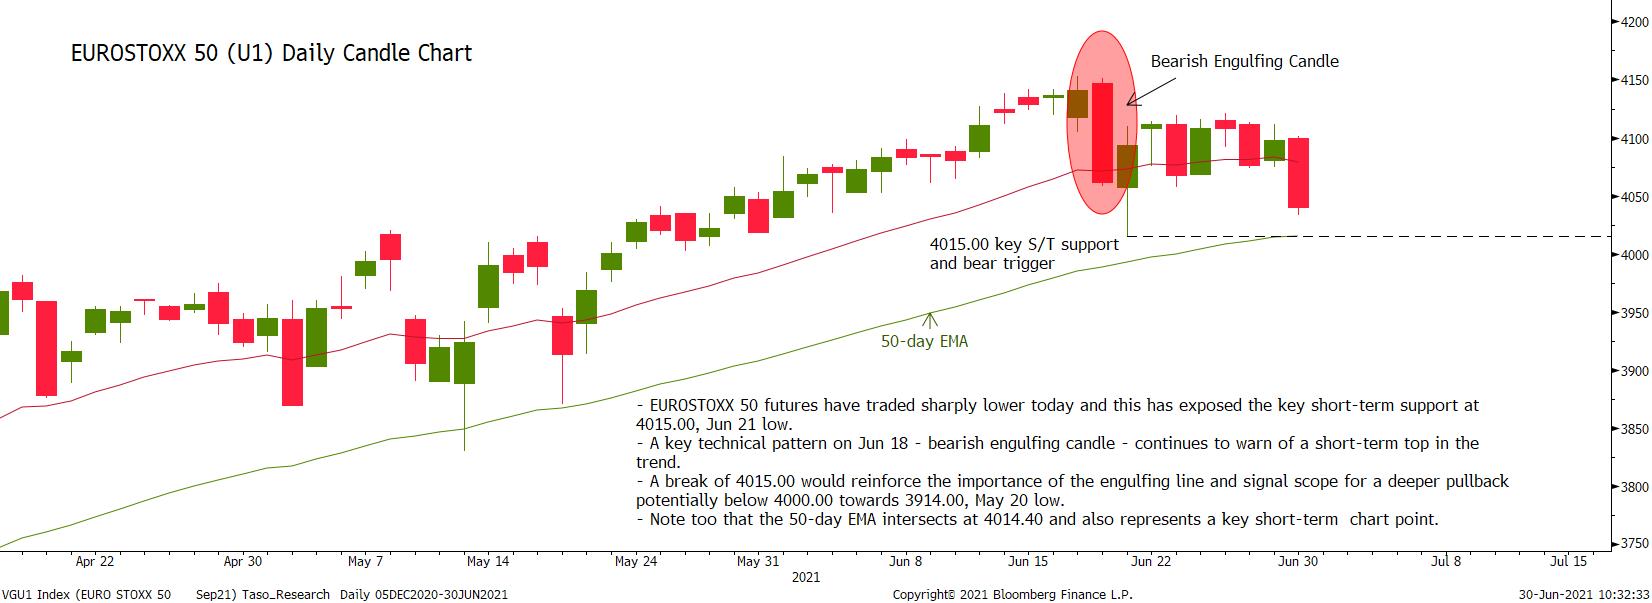
- In the equity space, S&P E-minis maintain a bullish theme and sights are on the 4300.00 handle. EUROSTOXX 50 futures have traded sharply lower on an intraday basis this week and this has exposed the key short-term support at 4015.00, Jun 21 low. A key technical pattern on Jun 18 - bearish engulfing candle - continues to warn of a short-term top in the trend. A break of 4015.00 would reinforce the importance of the engulfing line and signal scope for a deeper pullback potentially below 4000.00 towards 3914.00, May 20 low. Note too that the 50-day EMA intersects at 4014.40 and also represents a key short-term chart point.
- See chart:
- In FX, the USD remains on a bullish path despite the recent corrective pullback. The EURUSD focus is on 1.1837 next, 76.4% of the Mar 31 - May 25 rally. GBPUSD remains vulnerable. Attention is on 1.3717 next, Apr 16 low. The bear trigger is 1.3787, Jun 21 low. USDJPY needle still points north. Attention is on 111.30/64, Mar 26, 2020 high and 1.0% 10-dma envelope.
- On the commodity front, the yellow metal broke lower this week and cleared support at $1761.1, Jun 18 low. The break confirms a resumption of the downtrend that started Jun 1 and note the move lower has also confirmed a bear flag that developed during the most recent consolidation phase. The focus is on $1733.5, 76.4% retracement of the Mar 8 - Jun 1 rally. The Oil market trend condition remains bullish and pullbacks are considered corrective. Brent (Q1) focus is $76.97, 1.23 projection of Mar 23 - May 18 - May 21 price swing. Support lies at $73.37, the 20-day EMA. WTI (Q1) sights are set on $75.01, 1.382 projection of Mar 23 - May 18 - May 21 price swing. Watch support at $71.12, the 20-day EMA.
- Within FI, Bund futures are consolidating. The contract last week probed support at 171.80, Jun 17 low. A stronger sell-off would expose 171.37, Jun 3 low and 170.99, Mar 31 low and a key short-term support. Key support to watch in Gilt futures is at 126.70, Jun 3 low and marks an important pivot level. The key resistance is at 128.39, Jun 11 high.
FOREIGN EXCHANGE
EURUSD TECHS: Probing Key Short-Term Support
- RES 4: 1.2147 High Jun 15
- RES 3: 1.204250-day EMA
- RES 2: 1.2006 High Jun 17
- RES 1: 1.1975 High Jun 25
- PRICE: 1.1847 @ 06:07 BST Jul 1
- SUP 1: 1.1837 76.4% retracement of the Mar 31 - May 25 rally
- SUP 2: 1.1795 Low Apr 6
- SUP 3: 1.1738 Low Apr 5
- SUP 4: 1.1704 Low Mar 31 and a key support
EURUSD continues to trade lower this week and the pair has probed support at 1.1848, Jun 18, 21 lows and the bear trigger. The outlook is bearish. A clear break of 1.1848 would confirm a resumption of the downleg that started on May 25. Attention is on 1.1837, a Fibonacci retracement where a break would open 1.1704, Mar 31 low and a key support. Initial firm resistance is 1.1975, the Jun 25 high.
GBPUSD TECHS: Approaching The Near-Term Bear Trigger
- RES 4: 1.4133 High Jun 16
- RES 3: 1.4074 Low Jun 10
- RES 2: 1.3990/4001 50-day EMA / High Jun 23
- RES 1: 1.3968 20-day EMA
- PRICE: 1.3813 @ 06:13 BST Jul 1
- SUP 1: 1.3787 Low Jun 21
- SUP 2: 1.3717 Low Apr 16
- SUP 3: 1.3669 Low Apr 12 and a key support
- SUP 4: 1.3567 Low Apr 2
GBPUSD continues to trade lower this week with the pair approaching the key short-term support and bear trigger at 1.3787, Jun 21 low. Bears remain in charge and Cable is back below the 100-DMA, reinforcing current bearish conditions. A break of 1.3787 would strengthen a bearish case and open 1.3717, Apr 14 low. On the upside, initial firm resistance is seen at 1.4001, Jun 23 high.
EURGBP TECHS: Needle Still Points South
- RES 4: 0.8731 High Feb 26
- RES 3: 0.8701/21 High May 7 / High Apr 26 and the bull trigger
- RES 2: 0.8646/72 High Jun 1 / High May 25
- RES 1: 0.8609/29 High Jun 29,30 / High Jun 15
- PRICE: 0.8575 @ 06:18 BST Jul 1
- SUP 1: 0.8530/31 Low June 23 / 76.4% of the Apr 5 - 26 rally
- SUP 2: 0.8487 1.0% 10-dma envelope
- SUP 3: 0.8472 Low Apr 5 and the bear trigger
- SUP 4: 0.8401 2.0% 10-dma envelope
EURGBP traded lower yesterday and the outlook remains bearish. Support at 0.8561, May 12 low was breached Jun 17. This marked the end of the recent consolidation signalling scope for a deeper pullback. Attention is on 0.8531, 76.4% of the Apr 5 - 26 rally and just above last week's low. A break would expose key support at 0.8472, Apr 5 low. Initial firm resistance is unchanged at 0.8646, Jun 1 high.
USDJPY TECHS: Resumes Its Uptrend
- RES 4: 112.40 High Apr 24, 2019
- RES 3: 112.23 High Feb 20, 2020 and a key resistance
- RES 2: 111.71/73 High Mar 24, 2020 / 1.0% 10-dma envelope
- RES 1: 111.30 High Mar 26, 2020
- PRICE: 111.14 @ 06:26 BST Jul 1
- SUP 1: 110.42/109.72 Low Jun 30 / Low June 21
- SUP 2: 109.65/109.19 50-day EMA / Low Jun 7
- SUP 3: 108.56/34 Low May 25 / Low May 7 and key S/T support
- SUP 4: 107.48 Low Apr 23 and the bear trigger
USDJPY bounced sharply yesterday and the pair has probed initial resistance at 111.12, Jun 24 high and the near-term bull trigger. The recovery maintains the current bull trend and the positive price sequence of higher highs and higher lows. The focus is on 111.30/73, the Mar 26, 2020 high and 1.0% 10-dma envelope. Key trend support is at 109.72, Jun 21 low. A break would signal a top.
EURJPY TECHS: Trend Conditions Remain Bearish
- RES 4: 134.13 High Jun 1 and the bull trigger
- RES 3: 133.76 High Jun 10
- RES 2: 132.88 High Jun 17
- RES 1: 132.70 High Jun 23
- PRICE: 131.57 @ 06:32 BST Jul 1
- SUP 1: 131.22/130.04 Low Jun 22 / Low Jun 21 and bear trigger
- SUP 2: 129.59 Low Apr 23
- SUP 3: 128.83 Low Mar 29
- SUP 4: 128.29 Low Mar 24 and key support
The short-term trend outlook in EURJPY remains bearish. This follows the sharp move lower between Jun 15 - 21. The cross traded through the 50-day EMA and breached a bull channel support drawn off the Oct 30, 2020 low. The break lower highlights a reversal and price has also recently probed the 100-dma. Attention is on 130.00 and 129.59, Apr 23 low. Resistance is seen at the 132.70/88 zone, the Jun 23 and Jun 17 highs respectively.
AUDUSD TECHS: Extends This Week's Move Lower
- RES 4: 0.7666 50-day EMA
- RES 3: 0.7645 High Jun 17
- RES 2: 0.7617 High Jun 25 and a key short-term resistance
- RES 1: 0.7571 High Jun 29
- PRICE: 0.7482 @ 06:38 BST Jul 1
- SUP 1: 0.7476 Low Jun 21 and the bear trigger
- SUP 2: 0.7462 Low Dec 21, 2020
- SUP 3: 0.7372 1.236 proj of Feb 25 - Mar 9 - 18 price swing
- SUP 4: 0.7339 Low Nov 30, 2020
AUDUSD continues to trade lower this week. The outlook remains bearish following the move lower between Jun 11 - 21 that resulted in a break of key support at 0.7532 Apr 1 low. Price is also back below the 200-dma. The move through 0.7532 confirmed a resumption of the reversal that occurred Feb 25 and signals scope for a deeper pullback towards 0.7462 next, the Dec 21, 2020 low. Initial firm resistance is at 0.7617, the Jun 25 high.
USDCAD TECHS: Bullish Focus
- RES 4: 1.2653 High Apr 21 and a key resistance
- RES 3: 1.2535 High Apr 22
- RES 2: 1.2487/2501 High Jun 21 / 76.4% of Apr 21 - Jun 1 sell-off
- RES 1: 1.2424 High Jun 30
- PRICE: 1.2405 @ 06:44 BST Jul 1
- SUP 1: 1.2273/53 50-day EMA / Low Jun 23 and a key S/T support
- SUP 2: 1.2157 Low Jun 16
- SUP 3: 1.2057 Low Jun 7
- SUP 4: 1.2007 Low May 18 and key support
USDCAD is firmer and short-term conditions remain bullish. A positive theme follows the strong recovery between Jun 1 - 21 that confirmed a short-term reversal. The pair has also cleared the 50-day EMA reinforcing current short-term bullish conditions. Attention is on 1.2501, a Fibonacci retracement. A break would open 1.2653, Apr 21 high and an important resistance. Initial support is seen at 1.2253, Jun 23 low.
FIXED INCOME
BUND TECHS: (U1) Remains Below Resistance
- RES 4: 173.79 High Apr 8
- RES 3: 173.32 76.4% retracement of the Mar 25 - May 19 sell-off
- RES 2: 173.16 High Jun 11 and key resistance
- RES 1: 172.74/73.03 High Jun 30 / High Jun 21
- PRICE: 172.48 @ 05:15 BST Jul 1
- SUP 1: 171.67 Low Jun 22 and the near-term bear trigger
- SUP 2: 171.37 Low Jun 3
- SUP 3: 170.99 Low May 31 and key short-term support
- SUP 4: 170.56 Low May 24
Bund futures traded higher yesterday but remain below key resistance levels. A bearish theme remains intact. The contract probed 171.80, Jun 17 low last week. A clear break lower would signal scope for a deeper pullback and confirm a breach of the 50-day EMA. This would open 171.37, Jun 3 low ahead of a firmer support at 170.99, Mar 31 low. Key resistance is 173.16, Jun 11 high where a break is needed to resume the uptrend from May 19.
BOBL TECHS: (U1) Holding Above Recent Lows
- RES 4: 134.758 1.382 proj of the May 20 - 26 - 31 price swing
- RES 3: 134.663 1.236 proj of the May 20 - 26 - 31 price swing
- RES 2: 134.510 1.00 proj of the May 20 - 26 - 31 price swing
- RES 1: 134.180/250 High Jun 30 / High Jun 17
- PRICE: 134.110 @ 05:18 BST Jul 1
- SUP 1: 133.860 Low May 28, 31, Jun 22 and key S/T support
- SUP 2: 133.700 76.4% retracement of the May 20 - Jun 11 rally
- SUP 3: 133.530 Low May 21
- SUP 4: 133.450 Low May 20 and the bear trigger
Bobl futures edged higher yesterday. Although the recent move lower is considered corrective, a near-term bearish risk remains present. Price has breached the 20-day EMA and key support lies at 133.860, May 28, 31 and Jun 22 low. A break would strengthen a bearish case. On the upside, key resistance and the bull trigger has been defined at 134.510, a Fibonacci projection and the Jun 11 high. Initial firm resistance is at 134.250.
SCHATZ TECHS: (U1) Needle Still Points South
- RES 4: 112.210 High Jun 11 and the bull trigger
- RES 3: 112.185 High Jun 15 and 16
- RES 2: 112.175 High Jun 17 and 18
- RES 1: 112.165 High Jun 21
- PRICE: 112.145 @ 05:35 BST Jul 1
- SUP 1: 112.110 Low Apr 20, Jun 22, 23, 25 and 28
- SUP 2: 112.086 138.2% retracement of the May17 - Jun 11 rally
- SUP 3: 112.075 150.0% retracement of the May17 - Jun 11 rally
- SUP 4: 112.064 161.8% retracement of the May17 - Jun 11 rally
Schatz futures edged higher yesterday. Recent weakness resulted in a break of 112.120, May 17, Jun 21 lows. Note too, price also recently tested 112.110, Apr 20 low and the lows of last week. The outlook remains bearish and scope is seen for a move towards 112.086 and 112.075, Fibonacci retracement extensions. Initial firm resistance is 112.165, Jun 21 high. A break would ease the bearish threat and open 112.185, Jun 15, 16 highs.
GILT TECHS: (U1) Approaching Key Resistance
- RES 4: 128.92 1.236 proj of the May 13 - 26 - Jun 3 price swing
- RES 3: 128.50 1.00 proj of the May 13 - 26 - Jun 3 price swing
- RES 2: 128.39 High Jun 11 and the bull trigger
- RES 1: 128.21 High Jun 30
- PRICE: 128.10 @ Close Jun 30
- SUP 1: 127.25/126.91 Low Jun 10
- SUP 2: 126.70 Low Jun 23 / Low Jun 3 and key near-term support
- SUP 3: 126.55 Low May 21
- SUP 4: 126.12 Low May 19
Gilt futures traded higher yesterday and are closing in on key resistance. The contract on Jun 9, breached 127.74, May 26 high. This confirmed a bullish price sequence of higher highs and higher lows and the positive price condition remains intact. Price has held above a key short-term pivot support at 126.70, Jun 3 low. Further gains would open 128.39, Jun 11 high and the bull trigger. A break of 126.70 would instead be bearish.
BTP TECHS: (U1) Strong Rally
- RES 4: 153.40 1.236 proj of the May 19 - 28 price swing
- RES 3: 152.66 1.00 proj of the May 19 - 28 price swing
- RES 2: 151.68/152.47 High Jun 17 / High Jun 14 and the bull trigger
- RES 1: 151.51 High Jun 30
- PRICE: 151.41 @ Close Jun 30
- SUP 1: 150.56 Low Jun 30
- SUP 2: 149.97 Low Jun 25
- SUP 3: 149.74 50.0% retracement of the May 19 - Jun 14 rally
- SUP 4: 149.53 Low May 28
A strong rally dominated yesterday's session in BTP futures. The contract has defined a key short-term support at 149.97, Jun 25 low. The break higher yesterday suggests the recent corrective pullback between Jun 14 - 25 is over. Further gains would signal scope for a climb towards the key resistance at 152.47, Jun 14 high. Initial support lies at yesterday's low of 150.56. A break of 149.97 would reinstate a bearish threat.
EQUITIES
EUROSTOXX 50 TECHS: (U1) Bearish Engulfing Candle Remains A Threat
- RES 4: 4265.00 High Jan 15, 2008
- RES 3: 4175.00 Nov 26, 2008 low (cont)
- RES 2: 4153.00 High Jun 17 and bull trigger
- RES 1: 4121.00 High Jun 25
- PRICE: 4070.50 @ 05:58 BST Jul 1
- SUP 1: 4033.50 Low Jun 30
- SUP 2: 4016.02/4015.00 50-day EMA / Low Jun 21 and bear trigger
- SUP 3: 3914.00 Low May 20
- SUP 4: 3871.00 Low May 19
EUROSTOXX 50 futures traded lower yesterday and this has exposed the key short-term support at 4015.00, Jun 21 low. A key technical pattern on Jun 18 - bearish engulfing candle - continues to warn of a short-term top in the trend. A break of 4015.00 would reinforce the importance of the engulfing line and signal scope for a deeper pullback potentially below 4000.00 towards 3914.00, May 20 low. Initial resistance is at 4121.00, Jun 25 high.
E-MINI S&P (U1): 4300.00 Within Touching Distance
- RES 4: 4415.48 1.00 proj of Mar 25 - May 10 - 13 price swing
- RES 3: 4322.15 0.764 proj of Mar 25 - May 10 - 13 price swing
- RES 2: 4300.00 Round Number Resistance
- RES 1: 4298.25 Intraday high
- PRICE: 4296.50 @ 06:49 BST Jul 1
- SUP 1: 4233.20 20-day EMA
- SUP 2: 4174.75/26.75 50-day EMA / Low Jun 21 and key S/T support
- SUP 3: 4100.00 Round number support
- SUP 4: 4020.20 Low May 13 and key short-term support
S&P E-minis continue to climb and deliver fresh all-time highs, maintaining the current bullish theme and bullish price sequence. The contract recently recovered from support around the 50-day EMA and this reinforces bullish conditions. Attention is on the 4300.00 handle. A break would open 4322.15, a Fibonacci extension. Key short-term trend support is 4126.75, low Jun 21. Initial support is at 4233.20, the 20-day EMA.
COMMODITIES
BRENT TECHS: (U1) Support Lies At The 20-Day EMA
- RES 4: $79.02 - 1.50 proj of Mar 23 - May 18 - May 21 price swing
- RES 3: $78.03 - High Oct 29, 2018 (cont)
- RES 2: $76.42 - 1.23 proj of Mar 23 - May 18 - May 21 price swing
- RES 1: $75.77 - High Jun 28
- PRICE: $74.69 @ 06:49 BST Jul 1
- SUP 1: $72.94 - 20-day EMA
- SUP 2: $71.24 - Low Jun 17 and key near-term support
- SUP 3: $69.42 - High May 18 and the recent break out level
- SUP 4: $67.40 - Low May 25
Brent crude futures traded higher Monday but stalled at the session high $75.77 and price remains below this level. The outlook is bullish. Last week's recovery resulted in fresh trend highs following the clearance of $74.14 Jun 16 high. The move confirms a resumption of the uptrend and maintains the bullish price sequence of higher highs and higher lows. A break of $71.24, Jun 17 low is needed to signal a top. Initial support is at $72.94.
WTI TECHS: (Q1) Holding Above Support
- RES 4: $77.35 - 1.618 proj of Mar 23 - May 18 - May 21 price swing
- RES 3: $76.18 - 1.50 proj of Mar 23 - May 18 - May 21 price swing
- RES 2: $75.01 - 1.382 proj of Mar 23 - May 18 - May 21 price swing
- RES 1: $74.45 - High Jun 28
- PRICE: $73.56 @ 06:51 BST Jul 1
- SUP 1: $71.35/69.54 - 20-day EMA / Low Jun 17 and key S/T support
- SUP 2: $67.74 - 50-day EMA
- SUP 3: $66.80 - High May 18
- SUP 4: $65.02 - Low May 26
WTI crude resumed its uptrend Monday extending last week's gains. Despite pulling back from the high, the outlook remains bullish. A positive price sequence of higher highs and higher lows remains intact and signals scope for further upside with attention on $75.01, a Fibonacci projection. Key support has been defined at $69.54, Jun 17 low. A break is required to signal a top. Initial support is at $71.35, the 20-day EMA.
GOLD TECHS: Gains Considered Corrective
- RES 4: $1903.8/16.6 - High Jun 8 / High Jun 1 and the bull trigger
- RES 3: $1877.7 - High Jun 14
- RES 2: $1825.4 - High Jun 17
- RES 1: $1795.0/1809.1 - High Jun 23 / High 20-day EMA
- PRICE: $1776.2 @ 07:05 BST Jul 1
- SUP 1: $1750.8 - Low Jun 29
- SUP 2: $1733.5 -76.4% retracement of the Mar 8 - Jun 1 rally
- SUP 3: $1723.8 - Low Apr 13
- SUP 4: $1700.00 - Round number support
Gold traded lower Tuesday and cleared $1761.1, Jun 18 low. The break confirmed a resumption of the downtrend that started Jun 1 and the move lower has also confirmed the bear flag price pattern that developed during the most recent period of consolidation. This opens $1733.5, a Fibonacci retracement ahead of $1723.8, Apr 13 low. On the upside, initial resistance has been defined at $1795.00, Jun 23 high. Gains are considered corrective.
SILVER TECHS: In A Range
- RES 4: $28.556 - High Jun 1
- RES 3: $28.285 - High Jun 11 and a key resistance
- RES 2: $27.831 - High Jun 16
- RES 1: $26.495/27.245 - High Jun 18 / High Jun 17
- PRICE: $26.236 @ 07:10 BST Jul 1
- SUP 1: $25.554/529 - Low Jun 21 / Low Jun 29
- SUP 2: $25.199 - Low Apr 14
- SUP 3: $24.955 - 76.4% retracement of the Mar 31 - May 18 rally
- SUP 4: $24.686 - Low Apr 13
Silver traded lower Tuesday. The metal did probe support but remains within its recent range and what appears to be a bear flag formation. The pattern, if correct, reinforces current bearish conditions. Recent weakness resulted in a break of the 50-day EMA. Attention is on $24.955 next, a Fibonacci retracement. A firm resistance is seen at $27.245, Jun 17 high. Initial resistance is at 26.495, Jun 18 high.
Why MNI
MNI is the leading provider
of intelligence and analysis on the Global Fixed Income, Foreign Exchange and Energy markets. We use an innovative combination of real-time analysis, deep fundamental research and journalism to provide unique and actionable insights for traders and investors. Our "All signal, no noise" approach drives an intelligence service that is succinct and timely, which is highly regarded by our time constrained client base.Our Head Office is in London with offices in Chicago, Washington and Beijing, as well as an on the ground presence in other major financial centres across the world.