
Why MNI
MNI is the leading provider
of intelligence and analysis on the Global Fixed Income, Foreign Exchange and Energy markets. We use an innovative combination of real-time analysis, deep fundamental research and journalism to provide unique and actionable insights for traders and investors. Our "All signal, no noise" approach drives an intelligence service that is succinct and timely, which is highly regarded by our time constrained client base.Our Head Office is in London with offices in Chicago, Washington and Beijing, as well as an on the ground presence in other major financial centres across the world.
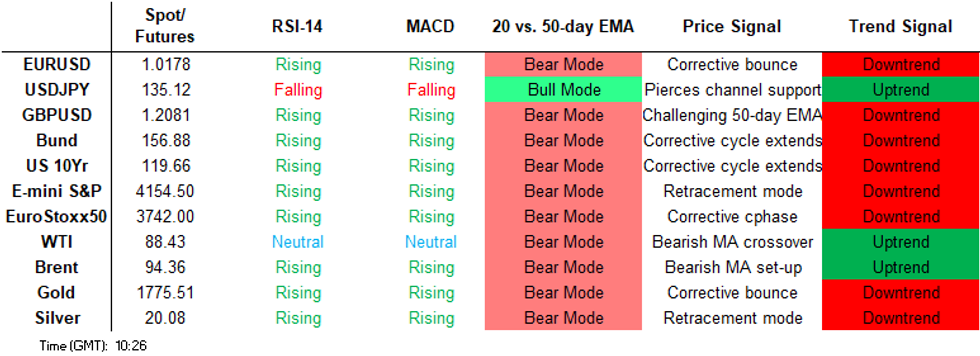
Price Signal Summary - EURUSD Consolidates And Remains Above Support
- In the equity space, S&P E-Minis are consolidating, the outlook however remains bullish. Fresh highs last week reinforces the current trend direction and this signals scope for a climb towards 4204.75 next, May 31 high and the next key resistance. Initial key support is 3998.05, the 50-day EMA. EUROSTOXX 50 futures trend conditions remain bullish and last week’s high print reinforces this theme. The contract has cleared the 76.4% retracement of the Jun 6 - Jul 5 downleg, at 3722.40. This opens 3840.00, the Jun 6 high. Initial firm support to watch is 3597.20, the 50-day EMA.
- In FX, the EURUSD short-term conditions are bullish as long as price holds above support at 1.0097, the Jul 27 low. A resumption of gains would signal scope for a continuation higher inside the bull channel drawn from the Feb 10 high - the top intersects at 1.0370. Weakness below 1.0097 would alter the picture. A bullish short-term theme in GBPUSD remains intact and last week’s pullback is considered corrective. Price has recently traded above the 50-day EMA and the next objective at 1.2332, the Jun 27 high. Potential is also seen for a climb towards 1.2406, the Jun 16 high and a key resistance. Initial support to watch lies is at 1.2004, Friday’s low. USDJPY is trading closer to its most recent highs. It is still possible that recent gains are a correction. The price levels to watch are; 136.91, the former bull channel support breached on Jul 28 and a key resistance and 130.41, last Tuesday’s low and a bear trigger.
- On the commodity front, Gold maintains a firmer tone despite Friday’s pullback. The yellow metal has recently breached the 50-day EMA and attention is on trendline resistance at $1799.6. The trendline is drawn from the Mar 8 high. A breach of the line would represent an important technical break and highlight a stronger reversal of the 5-month downtrend. Initial firm support lies at $1754.4 the Aug 3 low. In the Oil space, WTI futures remain vulnerable following last week’s move lower. Price has breached support at $88.23, Jul 14 low and a key support. This opens $85.37, the Mar 15 low.
- In the FI space, a short-term bull cycle in Bund futures remains intact and the recent pullback is considered corrective. Scope is seen for a climb to 159.79 next, the Apr 4 high (cont). Initial firm support is 154.88, the 20-day EMA. The trend condition in Gilts remains bullish and pullbacks are considered corrective. Two support level to watch are:
- 116.33, 50-day EMA.
- 116.27 Trendline support drawn from the Jun 16 low.
FOREIGN EXCHANGE
EURUSD TECHS: In A Range
- RES 4: 1.0449 High Jul 5
- RES 3: 1.0370 Bull channel resistance drawn from the Feb 10 high
- RES 2: 1.0341 50-day EMA
- RES 1: 1.0294 High Aug 2
- PRICE: 1.0185 @ 17:00 BST Aug 5
- SUP 1: 1.0097 Low Aug 27 and key short-term support
- SUP 2: 1.0064/0.9952 Low Jul 18 / 14 and the bear trigger
- SUP 3: 0.9944 1.618 projection of the Jun 9 - 15 - 27 price swing
- SUP 4: 0.9883 1.764 projection of the Jun 9 - 15 - 27 price swing
EURUSD traded lower Friday but remains inside a range as the pair continues to consolidate. The short-term outlook is bullish, while price trades above support at 1.0097, the Jul 27 low. A resumption of gains would signal scope for an extension higher within the bull channel - the top intersects at 1.0370 and marks a key resistance. Weakness below 1.0097 would alter the picture. This would expose parity once again and 0.9952, the Jul 14 low.
GBPUSD TECHS: Corrective Pullback Extends
- RES 4: 1.2518 High Jun 6
- RES 3: 1.2406 High Jun 16 and a key resistance
- RES 2: 1.2332 High Jun 27
- RES 1: 1.2199/2293 50-day EMA / High Aug 01
- PRICE: 1.2078 @ 06:23 BST Aug 8
- SUP 1: 1.2004 Low Aug 5
- SUP 2: 1.1961 Low Jul 25
- SUP 3: 1.1890/1760 Low Jul 21 / Low Jul 14 and the bear trigger
- SUP 4: 1.1673 1.00 proj of the May 27 - Jun 14 - 16 price swing
GBPUSD remains below its recent highs and the pair traded lower again Friday. A bullish short-term theme is intact though and the latest pullback is considered corrective. Price has recently traded above the 50-day EMA. This reinforces short-term bullish conditions and opens 1.2332, the Jun 27 high. Potential is also seen for a climb towards 1.2406, the Jun 16 high and a key resistance. Initial support to watch is 1.2004, Friday’s low.
EURGBP TECHS: Corrective Bounce Extends
- RES 4: 0.8627 High Jul 4
- RES 3: 0.8585 High Jul 21 and a key resistance
- RES 2: 0.8478 50-day EMA
- RES 1: 0.8453 High Aug 5
- PRICE: 0.8433 @ 06:29 BST Aug 8
- SUP 1: 0.8340 Low Aug 2
- SUP 2: 0.8313 Low Apr 22
- SUP 3: 0.8233 2.0% 10-dma envelope and low Apr 14
- SUP 4: 0.8203 Low Mar 7 and a key support
EURGBP traded higher again Friday, extending the bounce from 0.8340, the Aug 2 low. The outlook is bearish and gains are considered corrective. Recent weakness has reinforced this theme and established a price sequence of lower lows and lower highs. Moving average studies are in bear mode too. A continuation lower would open 0.8313, Apr 22 low. Initial firm resistance is 0.8478, the 50-day EMA.
USDJPY TECHS: Holding On To Recent Gains
- RES 4: 137.96 High Jul 22
- RES 3: 137.46 High Jul 27
- RES 2: 136.91 Former channel support drawn from the Mar 4 low
- RES 1: 135.50 High Aug 5
- PRICE: 135.27 @ 06:32 BST Aug 8
- SUP 1: 132.29 Low Mar 8
- SUP 2: 130.41/130.00 Low Aug 2 / Round number support
- SUP 3: 129.51 Low Jun 2
- SUP 4: 128.64 Low Jun 1
USDJPY rallied Friday, extending the recovery from 130.41, the Aug 2 low. Gains are - for now - considered corrective. A bearish theme was confirmed by the recent break lower that resulted in the breach of a number of important technical chart points. On Jul 28, a bull channel breakout, drawn from the Mar 4 low, signalled a reversal. Support at 131.50, the Jun 16 low has also been cleared. The next key resistance is 136.91, the former channel base.
EURJPY TECHS: Approaching The 20-and 50-Day EMAs
- RES 4: 140.07 High Jul 25
- RES 3: 139.41 High Jul 28
- RES 2: 138.56 50-day EMA
- RES 1: 137.98 20-day EMA
- PRICE: 137.84 @ 06:44 BST Aug 8
- SUP 1: 135.65 Low Aug 4
- SUP 2: 134.84/133.40 Low Aug 3 / 2 and a bear trigger
- SUP 3: 132.66 Low May 12 and a key support
- SUP 4: 131.99 61.8% retracement of the Mar 7 - Jun 28 bull leg
EURJPY is holding on to its most recent gains and has traded higher today. The recovery from 133.40, confirmed a hammer formation on Aug 2 and this pattern highlighted a reversal of the recent downleg. The subsequent recovery has opened 137.98 and 138.56, the 20- and 50-day EMA values and a key resistance zone. On the downside, a reversal lower and a breach of 133.40 would instead resume the bear cycle and open 132.66, May 12 low.
AUDUSD TECHS: Recent Move Lower Likely A Correction
- RES 4: 0.7141 76.4% retracement of the Jun 3 - Jul 14 downleg
- RES 3: 0.7069 High Jun 16
- RES 2: 0.7047/53 High Aug 1 / 61.8% of the Jun 3 - Jul 14 downleg
- RES 1: 0.6990 High Aug 4
- PRICE: 0.6936 @ 07:00 BST Aug 8
- SUP 1: 0.6859 Low Jul 21
- SUP 2: 0.6786 Low Jul 18
- SUP 3: 0.6682 14 and the bear trigger
- SUP 4: 0.6647 0.764 proj of the Apr 5 - May 12 - Jun 3 price swing
AUDUSD remains below the Aug 1 high and the pair traded lower again Friday. The short-term outlook remains bullish and for now, the latest pullback is considered corrective. A resumption of strength, and a break of resistance at 0.7047, Aug 1 high, would open the Jun 16 high at 0.7069. Further out there is scope for a climb towards 0.7141, a Fibonacci retracement. Support to watch is at 0.6859, the Jul 21 low.
USDCAD TECHS: Gains Considered Corrective
- RES 4: 1.3224 High Jul 14 and key resistance
- RES 3: 1.3135/3163 High Jul 15 / 3.0% Upper Bollinger Band
- RES 2: 1.3038 High Jul 18
- RES 1: 1.2985 High Aug 5
- PRICE: 1.2921 @ 07:08 BST Aug 8
- SUP 1: 1.2818 Low Aug 4
- SUP 2: 1.2767/63 Low Aug 01 / Low Jun 13
- SUP 3: 1.2685 76.4% retracement of the Jun 8 - Jul 14 upleg
- SUP 4: 1.2594 2.0% 10-dma envelope
The USDCAD outlook is bearish, despite last week’s recovery from 1.2767, Aug 1 low. S/T gains are considered corrective. 1.2819,Jun 28 low, has recently been pierced. A clear break would strengthen bearish conditions and open 1.2763, Jun 13 low and 1.2685, a Fibonacci retracement. On the upside, the break last week of 1.2947, Jul 25 high, is a positive development. A breach of Friday’s 1.2985 high is required to strengthen the case for bulls.
FIXED INCOME
BUND TECHS: (U2) MA Studies Highlight Uptrend
- RES 4: 161.38 2.00 projection of the Jun 16 - 24 - 28 price swing
- RES 3: 160.00 Round number resistance
- RES 2: 159.79 High Apr 4 (cont)
- RES 1: 158.33/159.70 High Aug 3 / 2 and the bull trigger
- PRICE: 156.09 @ 05:18 BST Aug 8
- SUP 1: 155.72/154.88 Low Aug 5 / 20-day EMA
- SUP 2: 153.11 50-day EMA
- SUP 3: 149.69 Low Jul 21 and key short-term support
- SUP 4: 148.24 Low Jul 1
Bund futures remain in an uptrend despite Friday’ pullback. A fresh trend high last week reinforced current trend conditions. The move higher confirmed a resumption of the uptrend and moving average studies remain in a bull mode condition. The focus is on 159.79 next, the Apr 4 high (cont). Key trend support has been defined at 149.69, Jul 21 low. A break is required to signal a potential top. Initial firm support is 154.88, the 20-day EMA.
BOBL TECHS: (U2) Outlook Remains Bullish
- RES 4: 130.000 Round number resistance
- RES 3: 129.950 2.00 projection of the Jun 16 -24 - 28 price swing
- RES 2: 129.001 1.764 projection of the Jun 16 -24 - 28 price swing
- RES 1: 128.060/128.760 High Aug 3 / 2 and the bull trigger
- PRICE: 126.970 @ 05:33 BST Aug 8
- SUP 1: 126.624/450 20-day EMA / Low Jul 28
- SUP 2: 125.820 50-day EMA
- SUP 3: 124.030 Low Jul 21 and a reversal trigger
- SUP 4: 123.010 Low Jun 30
Bobl futures trend conditions are unchanged and remain bullish - short-term dips are still considered corrective. Last week’s high print reinforces current trend conditions. The move higher confirmed a resumption of the uptrend and maintains the price sequence of higher highs and higher lows. The focus is on 129.001 next, a Fibonacci projection. Key support is 124.030, Jul 21 low. A break would signal a reversal. Initial firm support is 126.450, Jul 28 low.
SCHATZ TECHS: (U2) Corrective Pullback
- RES 4: 110.855 High Apr 4 (cont)
- RES 3: 110.500 High May 26 (cont)
- RES 2: 110.412 1.50 proj of the May 16 - 24 - 28 price swing
- RES 1: 110.100/380 High Aug 3 / Aug 2 and the bull trigger
- PRICE: 109.790 @ 05:32 BST Aug 8
- SUP 1: 109.750 Low Aug % and intraday low
- SUP 2: 109.670 Low Jul 28
- SUP 3: 109.588 50-day EMA
- SUP 4: 109.350 Low Jul 22
Schatz futures remain below recent highs. The move lower last week is likely a correction and trend conditions remain bullish. Fresh highs on Aug 2, confirmed a resumption of the current uptrend and maintains the bullish price sequence of higher highs and higher lows, signalling scope for a continuation higher. The focus is on 110.412 next, a Fibonacci projection. Key support is unchanged at 108.950, the Jul 21 low. Initial firm support is seen at 109.670.
GILT TECHS: (U2) Retracement Lower Extends
- RES 4: 121.88 High Apr 5 (cont)
- RES 3: 121.07 High May 12 (cont)
- RES 2: 120.00 Round number resistance
- RES 1: 118.88/119.84 High Aug 4 / 2 and the bull trigger
- PRICE: 116.66 @ Close Aug 5
- SUP 1: 116.33 50-day EMA
- SUP 2: 116.27 Trendline support drawn from the Jun 16 low
- SUP 3: 114.08 Low Jul 8 and a key support
- SUP 4: 113.03 Low Jun 30
Gilt futures traded lower again Friday, extending the currecting corrective pullback. The short-term outlook remains bullish. Moving average studies are in a bull mode set-up and gains since Jun 16 have established a bullish price sequence of higher highs and higher lows. Key trend support is at 114.08, the Jul 8 low. The next firm support is 116.33, the 50-day EMA. A resumption of gains would refocus attention on 119.84.
BTP TECHS: (U2) Bullish Theme Still In Play
- RES 4:131.61 High Apr 29 (cont)
- RES 3: 131.24 High May 12 (cont)
- RES 2: 130.00 Round number resistance
- RES 1: 129.27 High Aug 2
- PRICE: 128.14 @ Close Aug 5
- SUP 1: 126.40/124.95 Low Aug 1 / 50-day EMA
- SUP 2: 122.81/119.57 Low Jul 28 / Low Jul 21 and key S/T support
- SUP 3: 118.60 Low Jun 22
- SUP 4: 115.72 Low Jun 16
The BTP futures trend condition remains bullish and the contract is trading closer to its recent highs. The break on Jul 29 of key resistance at 126.41, Jul 1 high, reinforces conditions for bulls and highlights a broader bullish price sequence of higher highs and higher lows - the definition of an uptrend. Attention is on the 130.00 handle next. Initial firm support lies at 124.95, the 50-day EMA.
EQUITIES
EUROSTOXX50 TECHS: (U2) Trend Needle Still Points North
- RES 4: 3902.00 High Mar 29 and a key resistance
- RES 3: 3855.00 High Apr 21
- RES 2: 3840.00 High Jun 6 and key resistance
- RES 1: 3811.00 High Jun 8
- PRICE: 3743.00 @ 06:22 BST Aug 8
- SUP 1: 3658.00 Low Aug 2
- SUP 2: 3597.20/3467.00 50-day EMA / Low Jul 18 / 19
- SUP 3: 3343.00 Low Jul 5 and the bear trigger
- SUP 4: 3321.30 50.0% of the major 2020 - 2021 upleg (cont)
EUROSTOXX 50 futures trend conditions remain bullish and Thursday’s climb reinforces current conditions. The contract has cleared the 76.4% retracement of the Jun 6 - Jul 5 downleg, at 3722.40. The clear breach opens 3811.00 next, the Jun 8 high, ahead of 3840.00, the Jun 6 high. Key support and the bear trigger is unchanged at 3343.00, the Jul 5 low. Initial firm support to watch is 3597.20, the 50-day EMA.
E-MINI S&P (U2): Trading Closer To Its Recent Highs
- RES 4: 4345.75 2.00 proj of the Jun 17 - 28 - Jul 14 price swing
- RES 3: 4306.50 High May 4
- RES 2: 4204.75 High May 31 and a key resistance
- RES 1: 4173.25 High Aug 4
- PRICE: 4146.00 @ 06:39 BST Aug 8
- SUP 1: 3998.05/13.25 50-day EMA / Low Jul 26 and key S/T support
- SUP 2: 3820.25 Low Jul 18
- SUP 3: 3723.75/3639.00 Low Jul 14 / Low Jun 17 and a bear trigger
- SUP 4: 3578.27 0.618 proj of the Mar 29 - May 20 - 31 price swing
Current trend conditions in S&P E-Minis are bullish and the contract is trading closer to its recent highs. Last week’s high print confirms a resumption of the current bull cycle and maintains the positive price sequence of higher highs and higher lows. This opens 4204.75 next, May 31 high and the next key resistance. On the downside, initial trend support is at 3913.25, the Jul 26 low. The 50-day EMA intersects at 3998.05.
COMMODITIES
BRENT TECHS: (V2) Bearish Threat Remains Present
- RES 4: $112.92 - High Jun 29
- RES 3: $110.72 - High Jul 5
- RES 2: $106.50 - High Jul 29 and a key resistance
- RES 1: $99.92/102.43 - 20- and 50-day EMA
- PRICE: $95.69 @ 06:53 BST Aug 8
- SUP 1: $92.78 - Low Aug 5
- SUP 2: $91.22 - Low Jul 14 and the bear trigger
- SUP 3: $90.00 - Round number support
- SUP 4: $88.31 - Low Mar 9 and a key support
Brent futures traded lower last week, extending the pullback from $106.50, the Jul 29 high. The outlook appears bearish following the recent failure to hold on to gains above the 50-day EMA - a key pivot resistance. The EMA intersects at $102.43. Price has cleared $96.70 support, the Jul 25 low. This exposes $91.22, the Jul 14 low. Key resistance has been defined at $106.50. A break is required to reinstate a bullish focus.
WTI TECHS: (U2) Remains Vulnerable
- RES 4: $113.87 - High Jun 17
- RES 3: $111.14 - High Jun 29
- RES 2: $108.28 - High Jul 5
- RES 1: $95.56/101.88 - 20-day EMA / High Jul 29 and key resistance
- PRICE: $89.76@ 07:15 BST Aug 8
- SUP 1: $87.01 - Low Aug 5
- SUP 2: $85.37 - Low Mar 15
- SUP 3: $83.51 - 1.50 projection of the Jun 8 - 22 - 29 price swing
- SUP 4: $81.34 - 1.618 projection of the Jun 8 - 22 - 29 price swing
WTI futures remain vulnerable and last week’s bearish price action reinforces this theme. The move lower follows a recent failure at resistance around the 50-day EMA - the average intersects at $99.02. Price has also breached support at $88.23, the Jul 14 low and a key support. Key resistance has been defined at $101.88, Jul 29 high. A break of this level would reinstate a bullish theme.
GOLD TECHS: Trendline Resistance Within Reach
- RES 4: $1847.9 - High Jun 22
- RES 3: $1825.1 - High Jun 30
- RES 2: $1799.6 - Trendline resistance drawn from the Mar 8 high
- RES 1: $1795.0 - High Aug 4 / 5
- PRICE: $1774.4 @ 07:18 BST Aug 8
- SUP 1: $1756.4/54.4 - 20-day EMA / Low Aug 3
- SUP 2: $1711.7/1681.0 - Low Jul 27 / 21
- SUP 3: $1680.5 - 1.764 proj of the Mar 8 - 29 - Apr 18 price swing
- SUP 4: $1676.9 - Low Mar 8 2021
Gold maintains a firmer tone despite Friday’s setback. The yellow metal has breached the 50-day EMA and attention is on trendline resistance at $1799.6. A breach of the trendline would represent an important technical break and highlight a stronger reversal of the 5-month downtrend. On the downside, initial firm support lies at $1754.4 the Aug 3 low. Key support is unchanged at $1681.0.
SILVER TECHS: Bullish Focus
- RES 4: $21.540 - High Jun 27
- RES 3: $21.000 - Round number resistance
- RES 2: $21.540 - High Jun 27
- RES 1: $20.508 - High Aug 2
- PRICE: $19.992 @ 08:00 BST Aug 8
- SUP 1: $19.062 - Low Jul 28
- SUP 2: $18.146/18.000 - Low Jul 14 / Round number support
- SUP 3: $17.312 - 3.00 proj of the Mar 8 - 29 - Apr 18 price swing
- SUP 4: $16.955 - Low Jun 15 2020
Silver is consolidating as bulls pause for breath. The metal has recently pierced the 50-day EMA, currently at 20.322. The average represents a key short-term resistance and a clear break would strengthen the current bull cycle. This would open, $21.540, Jun 27 high. On the downside, the broader downtrend remains intact and recent gains are still considered corrective. Key support has been defined at $18.146, the Jul 14 low and bear trigger.
Why MNI
MNI is the leading provider
of intelligence and analysis on the Global Fixed Income, Foreign Exchange and Energy markets. We use an innovative combination of real-time analysis, deep fundamental research and journalism to provide unique and actionable insights for traders and investors. Our "All signal, no noise" approach drives an intelligence service that is succinct and timely, which is highly regarded by our time constrained client base.Our Head Office is in London with offices in Chicago, Washington and Beijing, as well as an on the ground presence in other major financial centres across the world.