
Why MNI
MNI is the leading provider
of intelligence and analysis on the Global Fixed Income, Foreign Exchange and Energy markets. We use an innovative combination of real-time analysis, deep fundamental research and journalism to provide unique and actionable insights for traders and investors. Our "All signal, no noise" approach drives an intelligence service that is succinct and timely, which is highly regarded by our time constrained client base.Our Head Office is in London with offices in Chicago, Washington and Beijing, as well as an on the ground presence in other major financial centres across the world.

Price Signal Summary - Evening Star Reversal In Gilts?
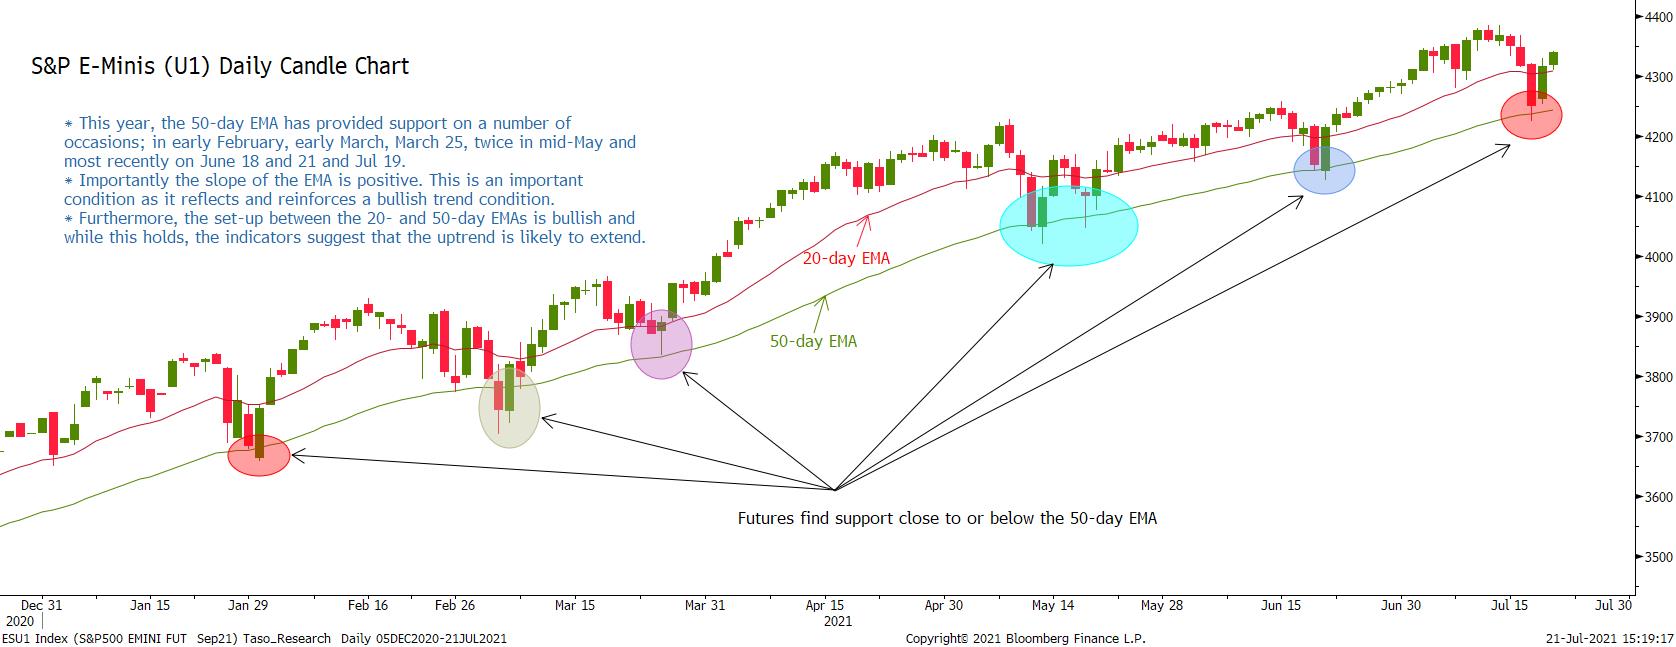
- In the equity space, conditions continue to improve for bulls following the recent sharp move lower. S&P E-minis found support at Monday's low. The contract tested the 50-day EMA and the average has so far provided support. A key pivot level has been defined at 4224.00, Monday's low. The bull trigger is 4384.50, the Jul 14 high. EUROSTOXX 50 futures are extending the recovery from Monday's low of 3895.00, low Jul 19 and a pivotal short-term support. Watch resistance at 4101.50, Jul 1 high.
- See chart:
- In FX, the USD outlook remains bullish. EURUSD maintains a bearish tone. The focus is on 1.1704, Mar 31 low and a key support. GBPUSD has recovered from Tuesday's low of 1.3572. Gains are considered corrective, Resistance is seen at 1.3817, the 20-day EMA. USDJPY is trading above Monday's low but remains vulnerable. This week's low print of 109.07 confirmed a resumption of the downtrend paving the way for an extension lower. The focus is on 108.47, 76.4% of the Apr 23 - Jul 2 rally. Resistance is at 110.70, Jul 14 high.
- On the commodity front, Gold maintains a bullish tone and the recent pullback is considered corrective. Key short-term support is at $1791.7, Jul 12 low. A break would be bearish. Brent futures gains are considered corrective. The focus is on $67.43, a Fibonacci retracement. Initial resistance is at $71.40, Jul 19 high. WTI (U1) sights are on $64.60, 76.4% of the May 21 - Jul 6 rally. A break of resistance at $71.40, Jul 19 high would potentially represent a bullish development.
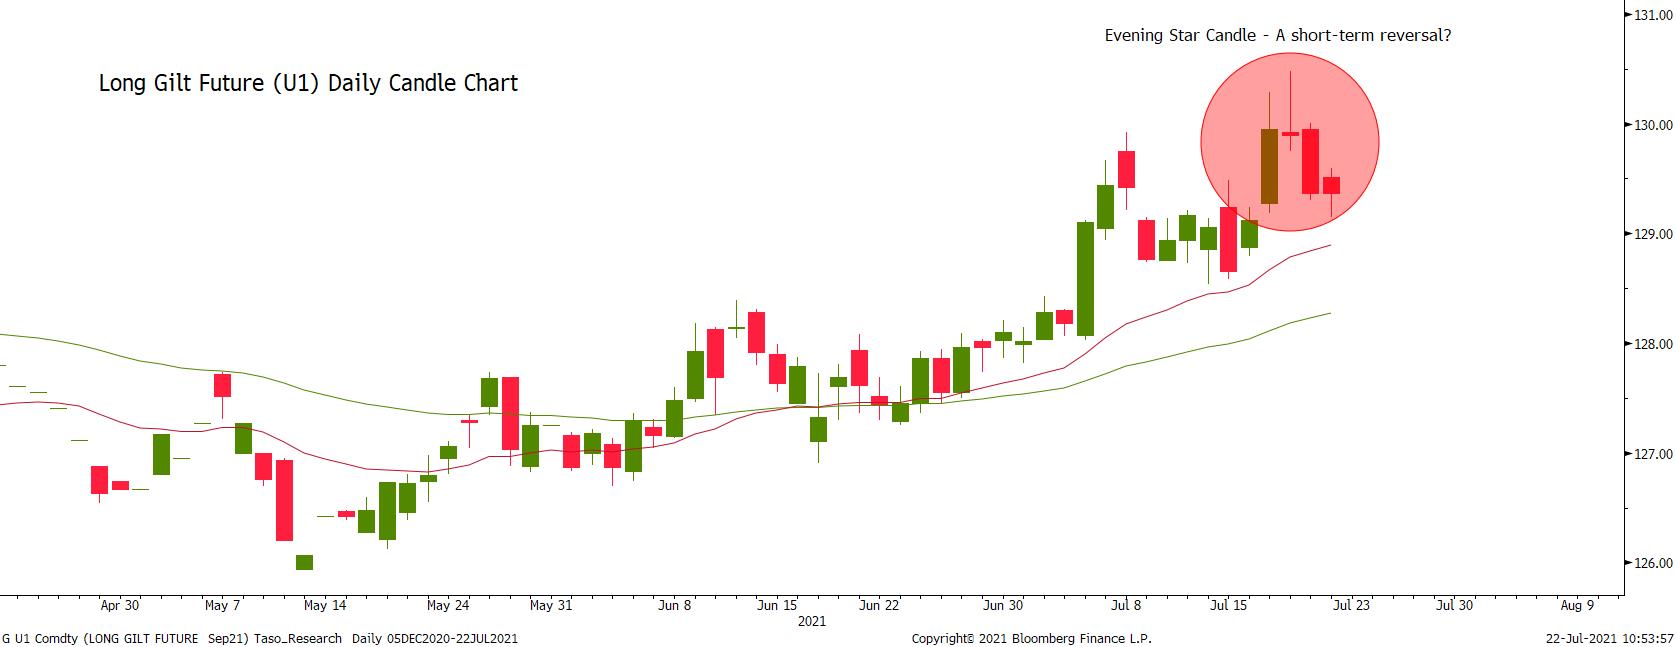
- Within FI, Bund futures remain firm following this week's break of 174.77, Jul 8 high. Sights are on 176.30, 76.4% retracement of the Dec '20 - May sell-off (cont). Gilts remain in a bullish condition despite the current pullback. The break of 129.92, Jul 8 high opens 130.72 2.236 projection of the May 13 - 26 - Jun 3 price swing. We are monitoring a bearish candle pattern, an evening star reversal. A deeper pullback would expose support at 128.54, low Jul 14.
- See chart:
FOREIGN EXCHANGE
EURUSD TECHS: Needle Still Points South
- RES 4: 1.2006 High Jun 29 / Jun 17
- RES 3: 1.1936/75 50-day EMA / High Jun 25
- RES 2: 1.1930 High Jun 29
- RES 1: 1.1851/1881 High Jul 15 / High Jul 9
- PRICE: 1.1768 @ 06:03 BST Jul 23
- SUP 1: 1.1752 Low Jul 21
- SUP 2: 1.1738 Low Apr 5
- SUP 3: 1.1704 Low Mar 31 and a key support
- SUP 4: 1.1603 Low Nov 4, 2020
EURUSD maintains a bearish outlook and the pair remains below the first resistance level at 1.1851. A bearish price sequence of lower lows and lows and lower highs remains intact highlighting a clear bearish theme. Note too the imminent formation of a death cross (50- breaking below the 200-dma) that also highlights a bearish threat. A break of 1.1704 would trigger a deeper pullback. Initial firm resistance is at 1.1851, Jul 15 high.
GBPUSD TECHS: Gains Considered Corrective
- RES 4: 1.4074 Low Jun 10
- RES 3: 1.4001 High Jun 23 and key resistance
- RES 2: 1.3813/3893 20-day EMA / 50-day EMA
- RES 1: 1.3790 High Jul 19
- PRICE: 1.3778 @ 06:08 BST Jul 23
- SUP 1: 1.3691/3572 Low Jul 22 / Low Jul 20
- SUP 2: 1.3520/08 Low Jan 18 / 2.0%10-dma envelope
- SUP 3: 1.3452 Low Jan 11
- SUP 4: 1.3430 Low Dec 28, 2020
GBPUSD traded higher again Thursday. Recent gains are considered corrective and a bearish trend structure still dominates. The recent breach of 1.3669, Apr 12 low reinforces a bearish theme with MA studies continuing to point south. The pair has tested 1.3579, 38.2% of the Mar '20 - Jun rally. An extension lower would open 1.3520, Jan 18 low. The 2.0% 10-dma envelope intersects at 1.3508. Initial resistance is at the Jul 19 high of 1.3790.
EURGBP TECHS: Sharp Reversal Lower
- RES 4: 0.8701/21 High May 7 / High Apr 26 and the bull trigger
- RES 3: 0.8672 High May 25
- RES 2: 0.8670 High Jul 20 and 76.4% of the Apr - Jul bearish phase
- RES 1: 0.8592 50-day EMA
- PRICE: 0.8552 @ 06:16 BST Jul 23
- SUP 1: 0.8541 Low Jul 23
- SUP 2: 0.8504 Low Jul 14 and key short-term support
- SUP 3: 0.8484/72 1% 10-dma envelope / Low Apr 5
- SUP 4: 0.8430 Low Feb 27, 2020
EURGBP traded lower yesterday, extending the reversal from the Jul 20 high. The sharp move lower puts on hold a recent bullish focus and instead attention turns to support at 0.8504, the Jul 14 low and a near-term bear trigger. A break of this support would reinstate a bearish theme and open 0.8472, the Apr 5 low. On the upside, key resistance has been defined at 0.8670, the Jul 20 high.
USDJPY TECHS: Holds Onto Recent Corrective Gains
- RES 4: 111.71 High Mar 24, 2020
- RES 3: 111.66 High Jul 2 and the bull trigger
- RES 2: 110.70/82 High Jul 14/ High Jul 7
- RES 1: 110.39 High Jul 21
- PRICE: 110.26 @ 06:23 BST Jul 23
- SUP 1: 109.07 Low Jul 19
- SUP 2: 108.56 Low May 25
- SUP 3: 108.47/34 76.4% of the Apr 23 - Jul 2 rally / Low May 7
- SUP 4: 108.08 Low Apr 27
USDJPY is holding onto this week's gains. Gains though are considered corrective and the pair remains vulnerable. This follows Monday's break of support at 109.53, Jul 8 low. The move lower resumes the reversal from early July and paves the way for an extension lower. Note that support at 109.19 has also been breached, Jun 7 low. Attention is on 108.47, a Fibonacci retracement. Firm resistance is seen at 110.70, Jul 14 high.
EURJPY TECHS: Corrective Cycle
- RES 4: 132.70 High Jun 23
- RES 3: 132.43 High Jul 1 and a key resistance
- RES 2: 131.09/22 High Jul 13 / 50-day EMA
- RES 1: 130.30/43 High Jul 22 / High Jul 14
- PRICE: 129.77 @ 06:36 BST Jul 23
- SUP 1: 128.60 Low Jul 20
- SUP 2: 128.48 200-dma
- SUP 3: 128.29 Low Mar 24 and key support
- SUP 4: 127.88 38.2% retracement of the Oct '20 - Jun rally
The EURJPY trend condition remains bearish despite recent gains. Attention is on the 200-dma at 128.48. A clear break of this average would strengthen the current bearish theme. Note, momentum and moving average studies remain bearish too. Further out, potential is seen for a move towards 127.88, the 38.2% retracement of the Oct '20 - Jun rally. 130.30, Jul 22 high marks initial firm resistance.
AUDUSD TECHS: Trend Indicators Remain Bearish
- RES 4: 0.7534 High Jul 7
- RES 3: 0.7503 High Ju13
- RES 2: 0.7456 20-day EMA
- RES 1: 0.7429 High Jul 19
- PRICE: 0.7370 @ 06:40 BST Jul 23
- SUP 2: 0.7290 Low Jul 21
- SUP 3: 0.7284/65 Low Nov 24, 2020 / 2.0% 10-dma envelope
- SUP 3: 0.7235 1.382 proj of Feb 25 - Apr 1 - May 10 price swing
- SUP 4: 0.7222 Low Nov 13, 2020
The AUDUSD outlook remains bearish. This follows the recent sell-off and a breach of the channel base at 0.7360. The channel is drawn from the Feb 25 high and despite the fact that price is back in the channel area, the move lower marks an important short-term technical break. Scope is for weakness towards 0.7235 next, the 1.236 projection of the Feb 25 - Apr 1 - May 10 price swing. On the upside, initial resistance is seen at 0.7429, Jul 19 high.
USDCAD TECHS: Pullback Considered Corrective
- RES 4: 1.2916 1.382 proj of Jun 1 - 21- 23 price swing
- RES 3: 1.2881 High Jan 28
- RES 2: 1.2807/46 High Jul 19 / 1.236 proj of Jun 1 - 21- 23 swing
- RES 1: 1.2730 High Jul 20
- PRICE: 1.2570 @ 06:49 BST Jul 23
- SUP 1: 1.2526 Low Jul 21
- SUP 2: 1.2502/2428 Low Jul 15 / Low Jul 14
- SUP 3: 1.2303/2253 Low Jul 6 / Low Jun 23 and a key support
- SUP 4: 1.2157 Low Jun 16
Despite the strong move lower Tuesday and Wednesday, the USDCAD outlook remains bullish. On Jul 8, the pair breached resistance at 1.2590, Jul 8 high. This confirmed a resumption of the uptrend and Monday's strong rally has reinforced bullish conditions, confirming an extension of the bull cycle that started Jun 1. The focus is on 1.2846 next, a Fibonacci projection and 1.2881, the Jan 28 high. On the downside, watch support is at 1.2502.
FIXED INCOME
BUND TECHS: (U1) Bullish Tone Remains Intact
- RES 4: 176.64 High Feb 11 (cont)
- RES 3: 176.38 1.382 proj of the May 19 - Jun 11 - Jun 22 price swing
- RES 2: 176.30 76.4% retracement of the Dec '20 - May sell-off (cont)
- RES 1: 176.28 High Jul 20 and the bull trigger
- PRICE: 175.89 @ 05:08 BST Jul 23
- SUP 1: 174.77/45 High Jul 8 / Low Jul 15
- SUP 2: 173.70 LowJul 13 and 14
- SUP 3: 173.15 50-day EMA
- SUP 4: 173.04 Channel base drawn off the May 19 low
Bund futures maintain a firmer tone. Price is trading close to recent highs and above former resistance of 174.77, Jul 8 high. The break of this level confirmed a resumption of the uptrend and marked a bullish breakout of the rising channel drawn off the May 19 low. Attention is on 176.38, a Fibonacci projection. Note that momentum is overbought and this is being monitored. Initial support is at 174.77.
BOBL TECHS: (U1) Needle Points North
- RES 4: 135.350 High Apr 8 (cont)
- RES 3: 135.313 2.236 proj of the May 20 - 26 - 31 price swing
- RES 2: 135.160 2.00 proj of the May 20 - 26 - 31 price swing
- RES 1: 135.130 High Jul 20 and 22
- PRICE: 135.050 @ 05:18 BST Jul 23
- SUP 1: 134.710/580 High Jul 8 / 20-day EMA
- SUP 2: 134.417 50-day EMA
- SUP 3: 134.410 Low Jul 13 and a key support
- SUP 4: 134.200 Bull channel base drawn off the May 20 low
Bobl futures are holding onto recent gains. The contract on Jul 8 cleared a key short-term resistance at 134.510, Jun 11 high and a Fibonacci projection. This confirmed a resumption of the uptrend that started May 20 and the subsequent climb reinforces the current bullish trend structure. The rising channel top drawn from the May 20 low has also been breached. Initial support lies at 134.710, Jul 8 high.
SCHATZ TECHS: (U1) Holding Onto Gains
- RES 4: 112.320 1.618 proj of the Jun 22 - Jul 8 - Jul 13 price swing
- RES 3: 112.307 1.50 proj of the Jun 22 - Jul 8 - Jul 13 price swing
- RES 2: 112.290 High Feb 11 (cont)
- RES 1: 112.285 High Jul 20 and the bull trigger
- PRICE: 112.275 @ 05:00 BST Jul 23
- SUP 1: 112.210 Low Jul 20
- SUP 2: 112.180/150 Low Jul 16 / Low Jul 13
- SUP 3: 112.140 Low Jul 5 and 6
- SUP 4: 112.120 Low Jun 30
The Schatz futures outlook remains bullish following Tuesday's strong rally and the contract is holding onto gains. Resistance at 112.210, Jun 11 high has been cleared. This strengthens a bullish case and opens 112.295 next, a Fibonacci projection. Note too that the rally has also established a bullish price sequence of higher highs and higher lows, the definition of an uptrend. On the downside, initial support is seen at 112.210, Jul 20 low.
GILT TECHS: (U1) Trend conditions Remain Bullish
- RES 4: 131.37 38.2% retracement of the Aug '20 - Jun sell-off
- RES 3: 130.72 2.236 proj of the May 13 - 26 - Jun 3 price swing
- RES 2: 130.62 High Feb 22 (cont)
- RES 1: 130.48 High Jul 20 and the bull trigger
- PRICE: 129.68 @ Close Jul 22
- SUP 1: 129.10 Low Jul 22
- SUP 2: 128.54/39 Low Jul 14 / High Jun 11 and recent breakout level
- SUP 3: 128.03 Jul 6
- SUP 4: 127.25 Low Jun 10
Gilt futures are trading below recent highs. A bullish trend condition remains intact following this week's climb and break of 129.92, Jul 8 high. The break confirms a resumption of the uptrend from mid-May and maintains a bullish price sequence of higher highs and higher lows. The focus is on 130.62, Feb 22 high (cont). Note, Wednesday's close highlights an evening star candle reversal pattern, a concern for bulls. Watch support at 128.54, low Jul 14.
BTP TECHS: (U1) Fresh Trend High
- RES 4: 155.44 1.00 proj of May 19 - Jun 14 - Jun 25 price swing
- RES 3: 155.00 Round number resistance
- RES 2: 154.15 0.764 proj of May 19 - Jun 14 - Jun 25 price swing
- RES 1: 154.05 High Jul 22
- PRICE: 153.83 @ Close Jul 22
- SUP 1: 152.65 Low Jul 14
- SUP 2: 151.93/54 Low Jul 8 / Low Jul 6
- SUP 3: 151.19 High Jul 1
- SUP 4: 150.56 Low Jun 30
BTPs maintain a bullish tone and rallied once again yesterday. A positive outlook follows the recent resumption of the uptrend - gains on Jul 6 and 7 resulted in a breach of key resistance at 152.47, Jun 14 high. The break confirmed a resumption of the uptrend that started May 19. This week's fresh high prints reinforce a bullish theme. Attention is on 154.15, a Fibonacci projection. Initial support is at 152.65, Jul 14 low.
EQUITIES
EUROSTOXX 50 TECHS: (U1) Pivot Resistance Remains Intact
- RES 4: 4153.00 High Jun 17 and bull trigger
- RES 3: 4121.00 High Jun 25
- RES 2: 4101.50 High Jul 1 and key near-term resistance
- RES 1: 4071.50 High Jul 22
- PRICE: 4060.50 @ 05:53 BST Jul 23
- SUP 1: 3944.00/3895.00 Low Jul 19
- SUP 2: 3871.00 Low Jul 21 / Low May 19
- SUP 3: 3830.00 Low May 13 and a key support
- SUP 4: 3779.00 Low Mar 26
EUROSTOXX 50 futures maintain this week's recovery and are trading close to yesterday's high. Key near-term resistance is seen at 4101.50, Jul 1 high. While this level remains intact, recent gains are considered corrective. A break higher is required to strengthen a bullish case and this would suggest scope for a climb towards the Jun 17 high of 4153.00. A reversal lower would expose Monday's low of 3895.00.
E-MINI S&P (U1): Approaching The Bull Trigger
- RES 4: 4508.82 1.236 proj of Mar 25 - May 10 - 13 price swing
- RES 3: 4415.48 1.00 proj of Mar 25 - May 10 - 13 price swing
- RES 2: 4400.00 Round number resistance
- RES 1: 4384.50 High Jul 14 and the bull trigger
- PRICE: 4350.75 @ 14:25 BST Jul 23
- SUP 1: 4224.00 Low Jul 19 and key short-term support
- SUP 2: 4187.58 61.8% retracement of the Jun 21 - Jul 14 rally
- SUP 3: 4126.75 Low Jun 21
- SUP 4: 4046.00 Low May 19
S&P E-minis started the week on a soft note but found support at Monday's low and have since recovered. Recent weakness resulted in a break of 4279.25, Jul 8 low. This did signal a S/T top and suggested scope for a deeper pullback. However, the contract found support at the 50-day EMA - the average represents an important trend support. Price is approaching the bull trigger at 4384.50, Jul 14 high. Key support is at 4224.00.
COMMODITIES
BRENT TECHS: (U1) Testing The 61.8% Retracement
- RES 4: $77.84 - High Jul 6 and the bull trigger
- RES 3: $76.72 - High Jul 14
- RES 2: $75.39 - 76.4% retracement of the Jul 6 - 20 downleg
- RES 1: $73.90 - High Jul 22
- PRICE: $73.45 @ 06:56 BST Jul 23
- SUP 1: $67.44/43 - Low Jul 20 / 76.4% of the May 21 - Jul 6 rally
- SUP 2: $66.11 - Low May 24
- SUP 3: $64.22 - Low May 21
- SUP 4: $63.09 - Low Apr 22
Brent futures are holding onto this week's gains and price is testing $73.87, the 61.8% retracement of the Jul 6 - 20 downleg. A clear breach of this average would strengthen a bullish case and put on hold the recent bearish theme. This would signal scope for a climb towards key resistance at $77.84, the Jul 6 high. A reversal lower is required to refocus attention on $67.44, Jul 20 low.
WTI TECHS: (U1) Holding Onto Recent Gains
- RES 4: $76.07 - High Jul 6 and the bull trigger
- RES 3: $74.90 - High Jul 13
- RES 2: $73.46 - 76% retracement of the Jul 6 - 20 downleg
- RES 1: $72.03 - High Jul 22
- PRICE: $71.59 @ 07:05 BST Jul 23
- SUP 1: $69.31 - 50-day EMA
- SUP 2: $65.01/64.60 - Low Jul 20 / 76.4% of the May 21 - Jul 6 rally
- SUP 3: $63.10 - Low May 24
- SUP 4: $61.06 - Low May 21 and key support
Brent futures are holding onto the strong rebound from Tuesday's $65.01 low. Price is testing the 61.8% retracement of the Jul 6 - 20 downleg at $71.85. A breach of this average would strengthen a bullish case and place on hold the recent bearish theme. This would signal scope for a climb towards key resistance at $76.07, the Jul 6 high. A reversal lower would refocus attention on $65.01, Jul 20 low and the key support.
GOLD TECHS: Holds Above Short-Term Support
- RES 4: $1877.5 - 76.4% retracement of the Jun 1 - 29 decline
- RES 3: $1863.3 - High Jun 16
- RES 2: $1853.3 - 61.8% retracement of the Jun 1 - 29 decline
- RES 1: $1834.1 - High Jul 15 and the bull trigger
- PRICE: $1805.3 @ 07:19 BST Jul 23
- SUP 1: $1791.7 Low Jul 12 and key near-term support
- SUP 2: $1774.4/1750.8 - Low Jul 2 / Low Jun 29
- SUP 3: $1733.5 -76.4% retracement of the Mar 8 - Jun 1 rally
- SUP 4: $1723.8 - Low Apr 13
Gold is unchanged and consolidating and remains below $1834.1, Jul 15 high. The outlook remains bullish and the recent pullback is considered corrective. Price however needs to clear last week's high print to confirm a resumption of the bull cycle. Support to watch is at $1791.7, Jul 12 low. A breach would be bearish and instead would signal scope for an extension lower towards the key support at $1750.8, Jun 29 low.
SILVER TECHS: Bears Still In Charge
- RES 4: $27.831 - High Jun 16
- RES 3: $26.775/27.245 - High Jul 6 and key resistance / High Jun 17
- RES 2: $26.467 - High Jul 14
- RES 1: $25.761 - High Jul 19
- PRICE: $25.392 @ 07:23 BST Jul 23
- SUP 1: $24.758 - Low Jul 21
- SUP 2: $24.686 - Low Apr 13
- SUP 3: $24.257 - Low Apr 1
- SUP 4: $23.781 - Low Mar 31and key support
Silver remains bearish. The metal has this week breached support at $25.529, Jun 29 low and bear trigger. The break confirmed a resumption of the downleg that started May 18. Note that $24.955, 76.4% of the Mar 31 - May 18 rally has also been breached. This opens $24.686, Apr 13 low. Moving average studies are in a bear mode reinforcing the current bearish theme. Key resistance has been defined at $26.775, Jul 6 high.
Why MNI
MNI is the leading provider
of intelligence and analysis on the Global Fixed Income, Foreign Exchange and Energy markets. We use an innovative combination of real-time analysis, deep fundamental research and journalism to provide unique and actionable insights for traders and investors. Our "All signal, no noise" approach drives an intelligence service that is succinct and timely, which is highly regarded by our time constrained client base.Our Head Office is in London with offices in Chicago, Washington and Beijing, as well as an on the ground presence in other major financial centres across the world.