
Why MNI
MNI is the leading provider
of intelligence and analysis on the Global Fixed Income, Foreign Exchange and Energy markets. We use an innovative combination of real-time analysis, deep fundamental research and journalism to provide unique and actionable insights for traders and investors. Our "All signal, no noise" approach drives an intelligence service that is succinct and timely, which is highly regarded by our time constrained client base.Our Head Office is in London with offices in Chicago, Washington and Beijing, as well as an on the ground presence in other major financial centres across the world.
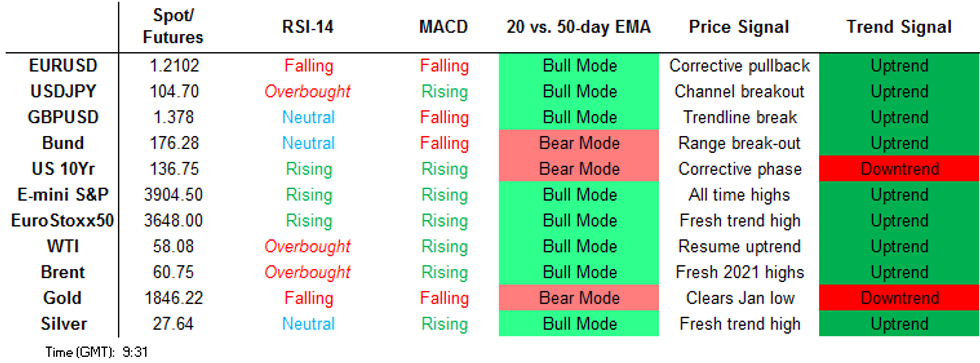
Price Signal Summary - Monitoring A Bullish Engulfing Line In EURUSD
In equities, E-mini S&P futures at all-time highs once again and futures have topped 3900.00. The focus shifts to the psychological 4000.00 handle. The EUROSTOXX50 index is firmer too. The index has breached 3657.83, Jan 8 high to resume the underlying uptrend. Attention is on 3700.00 and 3798.19. The latter is the 0.764 projection of the Mar - Jul - Oct 2020 price swing.
In the FX space, USDJPY remains bullish. The focus is on 106.05 next, 1.50 projection of the Jan 6 - 11 rally from the Jan 21 low.
EURUSD break of 1.2000 last week signals scope for weakness towards 1.1945, 23.6% retracement of the Mar - Jan rally and 1.1924, Nov 30 low. We are however monitoring Friday's bullish engulfing candle pattern. This is a concern for bears.
EURGBP has cleared 0.8800 and remains bearish. The next support is at 0.8711, May 11, 2020 low.
On the commodity front, Gold cleared $1804.7, Jan 18 low last week strengthening a bearish theme. This opens $1764.8, next, Nov 30 low. Oil contracts remain firm. Brent (J1) targets $60.62 next, Jan 29 high (cont). WTI (H1) bulls eye $58.00 next, a round number resistance and $59.06 further out, 1.382 projection of Apr - Aug rally from the Nov 2 low.
In the FI space, Bunds (H1) remain heavy. The focus is on 175.61, 1.236 proj of Jan the 4 - 12 sell-off from the Jan 27 high. Gilts (H1) last week resumed the downtrend from the August 2020 high. Attention is on 131.53, 2.236 projection of the Dec 11 - 24 sell-off from the Jan 4 high. BTPs (H1) Friday probed 152.67, Jan 8 high with the uptrend intact. This opens 153.00, a round number resistance.
FOREIGN EXCHANGE
EURUSD TECHS: Bullish Engulfing Reversal Still In Play
- RES 4: 1.2223 High Jan 13
- RES 3: 1.2190 High Jan 22 and a key resistance
- RES 2: 1.2156 High Jan 29
- RES 1: 1.2092/98 50- and 20-day EMA levels
- PRICE: 1.2079 @ 05:54 GMT Feb 9
- SUP 1: 1.1952 Low Feb 5
- SUP 2: 1.1945 23.6% retracement March - Jan rally
- SUP 3: 1.1924 Low Nov 30
- SUP 4: 1.1840 2.0% 10-dma envelope
EURUSD edges higher, extending the recovery off Friday's 1.1952 low. Friday's activity as highlighted yesterday, is a potential bullish engulfing reversal. If correct, the pattern suggests scope for a recovery and also highlights a base at last week's low. A strong resistance resides at 1.2092/98, the 50- and 20-day EMAs. A break would be bullish. On the downside, sub 1.1952 levels would resume recent bearish pressure.
GBPUSD TECHS: Fresh Highs
- RES 4: 1.4082 1.00 proj of May - Sep 2020 rally from Sep 23 low
- RES 3: 1.3998 High Apr 26, 2018
- RES 2: 1.3935 High Apr 27, 2018
- RES 1: 1.3804 High Apr 30, 2018
- PRICE: 1.3781 @ 05:07 GMT Feb 9
- SUP 1: 1.3667 20-day EMA
- SUP 2: 1.3567 Low Feb 4 and key support
- SUP 3: 1.3552/20 Low 50-day EMA / Low Jan 18 and key support
- SUP 4: 1.3505 Low Jan 12
GBPUSD is firmer and has traded higher today breaching recent resistance at 1.3759, Jan 27 high. The break higher confirms a resumption of the underlying uptrend that has been in place since the early March 2020 reversal. The focus is on 1.3804 next, Apr 30, 2020 high. On the downside, firm support lies at 1.3567, Feb 4 low. A break is required to dent the current bullish theme.
EURGBP TECHS: Bearish Trend Conditions Remain Intact
- RES 4: 0.9085 High Jan 6
- RES 3: 0.8924/96 50-day EMA / High Jan 12
- RES 2: 0.8853/0.8925 20-day EMA / High Jan 18 and key resistance
- RES 1: 0.8840 High Feb 4
- PRICE: 0.8765 @ 06:17 GMT Feb 9
- SUP 1: 0.8711 Low May 11, 2020
- SUP 2: 0.8691 Low May 5, 2020
- SUP 3: 0.8671 Low Apr 30, 2020 and a key support
- SUP 4: 0.8638 2.0% 10-dma envelope
EURGBP remains bearish following last week's extension lower with price trading closer to recent lows. Moving average conditions are also in a bear condition and this reinforces the current trend set-up. The focus is on 0.8711 next, May 11, 2020 low with scope too for a breach of the 0.8700 handle. On the upside, initial resistance is at 0.8840. A breach of this level would signal scope for a stronger corrective bounce.
USDJPY TECHS: Finds Resistance
- RES 4: 106.11 High Oct 7, 2020
- RES 3: 106.05 1.50 projection of Jan 6 / 11 / 21 swing
- RES 2: 105.77 High Feb 5
- RES 1: 105.26 Intraday high
- PRICE: 104.86 @ 06:27 GMT Feb 9
- SUP 1: 104.47 20-day EMA
- SUP 2: 104.20 Trendline support drawn off the Jan 6 low
- SUP 3: 103.64 Former channel top drawn off the Mar 2020 high
- SUP 4: 103.33 Low Jan 21
USDJPY gains have stalled and the pair is extending the pullback from last week's 105.77 high. The move lower is considered a correction following recent bullish price developments. On Jan 27, the pair cleared a bear channel resistance drawn off the Mar 2020 high and resistance at 104.40 gave way on Jan 28, confirming a resumption of the uptrend that started Jan 6. The next support is seen at 104.47, the 20-day EMA.
EURJPY TECHS: Bullish Focus
- RES 4: 128.39 High Dec 20. 2018
- RES 3: 127.88 0.618 projection of May - Jun rally from Oct 30 low
- RES 2: 127.49/50 High Jan 7 / High Mar 1, 2019
- RES 1: 127.13 High Feb 8
- PRICE: 126.64 @ 06:31 GMT Feb 9
- SUP 1: 126.01 50-day EMA
- SUP 2: 125.60 Low Jan 27
- SUP 3: 125.09 Low Jan 18 and the key support
- SUP 4: 124.98 100-DMA
EURJPY rallied Friday after an extended period of consolidation last week. The move higher cements the bullish tone with the focus on key resistance at 127.49, Jan 7 high. A break of this hurdle would confirm a resumption of the broader uptrend that has been in place since early May 2020. This would open 127.88 initially, a Fibonacci projection. On the downside, initial support is at 125.98, the 50-day EMA.
AUDUSD TECHS: Pulling Away From Recent Lows
- RES 4: 0.7917 High Mar 14, 2018 and a key resistance
- RES 3: 0.7885 High Mar 15. 2018
- RES 2: 0.7782/7820 High Jan 21 / High Jan 6 and the bull trigger
- RES 1: 0.7731 Intraday high
- PRICE: 0.7724 @ 06:39 GMT Feb 9
- SUP 1: 0.7651 Low Feb 8
- SUP 2: 0.7564 Low Feb 2 and the short-term bear trigger
- SUP 3: 0.7557 Low Dec 28
- SUP 4: 0.7517 Low Dec 22
AUDUSD is firmer. Friday's price action is being monitored as a possible reversal signal following last week's inability to clear the 50-day EMA. The pair has breached resistance at 0.7704, Jan 29 high and this signals scope for a climb towards 0.7782/0.7820, the Jan 21 high and Jan 6 high respectively. The latter is also a bull trigger. On the downside, a break of 0.7564, Feb 2 low would resume recent bearish pressure.
USDCAD TECHS: Corrective Pullback
- RES 4: 1.2957 High Dec 21 and key resistance
- RES 3: 1.2915 High Dec 23
- RES 2: 1.2881 High Jan 28
- RES 1: 1.2812 50-day EMA
- PRICE: 1.2729 @ 06:50 GMT Feb 9
- SUP 1: 1.2719 Intraday low
- SUP 2: 1.2686 Low Jan 27 and key near-term support
- SUP 3: 1.2635 Low Jan 22
- SUP 4: 1.2590 Low Jan 21 and major support
USDCAD is slightly weaker. In terms of patterns the recent consolidation appeared to be a pennant however, the structure has changed. The pullback appears to be a deeper corrective move instead and attention is on support at 1.2686, Jan 27 low and a key S/T level. A break would be a bearish development though and exposes the Jan 21 trend low of 1.2590. On the upside, a 1.2881 break, Jan 28 high would resume recent bullish activity.
FIXED INCOME
BUND TECHS: (H1) Needle Still Points South
- RES 4: 178.12 High Jan 27 and the bull trigger
- RES 3: 177.66 High Jan 29
- RES 2: 177.01 20-day EMA
- RES 1: 176.48/70 High Feb 5 / High Feb 3
- PRICE: 176.10 @ 05:04 GMT Feb 9
- SUP 1: 176.61 Low Feb 8 and 1.236 proj of Jan 4 - 12 - 27 swing
- SUP 2: 175.31 1.382 proj of Jan 4 - 12 sell-off from Jan 27 high
- SUP 3: 175.07 1.50 proj of Jan 4 - 12 sell-off from Jan 27 high
- SUP 4: 174.84 1.618 proj of Jan 4 - 12 sell-off from Jan 27 high
Bund futures remain weak despite yesterday's recovery off the 175.61 day low. The contract has extended its recent sell-off. Price last week traded through support at 176.89, Jan 29 low, a short-term trendline support at 176.88 drawn off the Jan 12 low and 176.34, the Jan 12 low. Furthermore, Friday's activity resulted in a breach of support at 175.84, Nov 11 low. The focus is on 175.31, a Fibonacci projection. Initial resistance is seen at 176.48.
BOBL TECHS: (H1) Bearish Theme Still Dominates
- RES 4: 135.370 High Jan 29
- RES 3: 135.205 50-day EMA
- RES 2: 135.128 20-day EMA
- RES 1: 135.010 High Feb 5
- PRICE: 134.930 @ 05:06 GMT Feb 9
- SUP 1: 134.790 Low Feb 5 and the bear trigger
- SUP 2: 134.620 1.00 proj of Dec 11 - Jan 12 sell-off from Jan 27 high
- SUP 3: 134.530 Low Sep 1, 2020 (cont)
- SUP 4: 134.450 Low Aug 14, 2020 (cont)
BOBL futures maintain a weaker tone following last week's sell-off and the extension lower from 135.480, Jan 27 high. The move lower last week saw price trade below support at 134.970, Jan 22 low and 134.840, the Jan 12 low and a bear trigger. The break of this latter level strengthens a bearish argument and signals scope for a move towards 134.620, a Fibonacci projection. Initial resistance is seen at Friday's high of 135.010.
SCHATZ TECHS: (H1) Key Support Still Exposed
- RES 4: 112.365/68 High Jan 27 / 61.8% of the Dec 11 - 28 downleg
- RES 3: 112.335 High Jan 1
- RES 2: 112.305 High Feb 2
- RES 1: 112.280 High Feb 3 and 5
- PRICE: 112.255 @ 04:12 GMT Feb 9
- SUP 1: 112.245 Low Feb 4, 5 and 8
- SUP 2: 112.240 Low Jan 12, 21 and 22 low
- SUP 3: 112.235 Low Dec 23 and the bear trigger
- SUP 4: 112.201 0.764 proj of Dec 11 -28 sell-off from Jan 27 high
Schatz futures remain closer to recent lows. The contract traded higher Jan 27 clearing 112.330 in the process, Jan 4, 5 and 15 highs. The break confirmed a triple bottom reversal highlighting a shift in sentiment. While this pattern remains valid, last week's sell-off threatens recent bullish activity. The move lower has exposed key support at 112.235, Dec 23 low and 112.240, Jan 2, 21 and 22 low. Initial firm resistance is at 112.280.
GILT TECHS: (H1) Bearish Cycle Extends
- RES 4: 134.10 High Feb 2
- RES 3: 133.65 High Jan 4
- RES 2: 133.55 Low Dec 1 and a recent breakout level
- RES 1: 132.75 High Feb 5
- PRICE: 132.31 @ Close Feb 8
- SUP 1: 131.73 Low Feb 8
- SUP 2: 131.53 2.236 proj of Dec 11 - 24 sell-off from Jan 4 high
- SUP 3: 131.24 2.382 projection of Dec 11 - 24 sell-off from Jan 4 high
- SUP 4: 131.01 2.50 projection of Dec 11 - 24 sell-off from Jan 4 high
Gilt futures sold off again yesterday before finding support at the 131.73 session low. The continued move lower reinforces underlying bearish conditions with further downside likely near-term. Furthermore, last week's weakness confirmed a resumption of the underlying downtrend that started early August last year. The focus is on 131.53 next, a Fibonacci projection. On the upside, initial resistance is at Friday's intraday high of 132.75.
BTP TECHS: (H1) Fresh Trend High Once Again
- RES 4: 154.00 Round number resistance
- RES 3: 153.87 1.00 proj of the Oct - Jan rally from Jan 22 low
- RES 2: 153.00 Round number resistance
- RES 1: 152.77 High Feb 8
- PRICE: 152.69 @ Close Feb 8
- SUP 1: 151.43 Low Jan 4
- SUP 2: 150.70/43 Low Feb 2 / Low Jan 26
- SUP 3: 149.57 Low Jan 22 and bear trigger
- SUP 4: 149.09 Low Nov 11 (cont)
BTP futures remain bullish. The contract gapped higher Feb 3 and also traded above a trendline resistance drawn off the Jan 8 high. Futures extended gains and Friday saw price trade above the former trend high of 152.67, Jan 8 high to register a high print of 152.76 and yesterday's high was 152.77. This climb confirms a resumption of the uptrend and opens 153.00 next. On the downside, firm support has been defined at 150.70, Feb 2 low.
EQUITIES
EUROSTOXX 50 Techs: Probes Key Resistance
- RES 4: 3867.28 High Feb 20, 2020
- RES 3: 3798.19 0.764 proj of Mar - Jul - Oct 2020 swing
- RES 2: 3700.00 Round number resistance
- RES 1: 3681.82 High Feb 8
- PRICE: 3665.51 @ Close Feb 8
- SUP 1: 3594.76 20-day EMA
- SUP 2: 3545.09 Low Feb 2
- SUP 3: 3473.76 Low Jan 28 and the bear trigger
- SUP 4: 3455.94 Low Dec 22
EUROSTOXX 50 rebounded last week and has defined a key short-term support at 3473.76, Jan 28 low. Gains last week resulted in breach of the recent trend high at 3657.83, Jan 8 high. Yesterday's climb highlights the break and confirms a resumption of the underlying uptrend and opens the 3700.00 handle. For bears, the index needs to clear support at 3473.76 to reinstate a bearish theme. This would open 3401.14, Dec 21 low.
COMMODITIES
BRENT TECHS: (J1) Clears $60.00
- RES 4: $65.00 - Round number resistance
- RES 3: $64.58 - High Jan 22, 2020 (cont)
- RES 2: $62.46 - High Jan 24, 2020 (cont)
- RES 1: $61.61 - 1.500 proj of the Apr - Aug - Nov 2020 price swing
- PRICE: $61.18 @ 06:48 GMT Feb 9
- SUP 1: $59.08 - Low Feb 5
- SUP 2: $57.31 - High Jan 13 and former breakout level
- SUP 3: $56.61 - 20-day EMA
- SUP 4: $54.40 - Low Jan 22
Brent futures maintain a bullish tone following last week's gains and the confirmed resumption of the underlying uptrend following the breach of $57.31, Jan 13 high. The contract has this week cleared $60.00 and the clear break signals potential for a climb towards $61.61, a Fibonacci projection. On the downside initial firm support is seen at $57.31 with key trend support at $54.40, Jan 22 low.
WTI TECHS: (H1) Defying Gravity
- RES 4: $63.17 - 1.618 proj of Apr - Aug rally from the Nov 2 low
- RES 3: $61.11 - 1.500 proj of Apr - Aug rally from the Nov 2 low
- RES 2: $60.00 - Psychological round number
- RES 1: $59.06 - 1.382 proj of Apr - Aug rally from the Nov 2 low
- PRICE: $58.52 @ 06:57 GMT Feb 9
- SUP 1: $56.43 - Low Feb 5
- SUP 2: $55.30 - Low Feb 4
- SUP 3: $53.94 - High Jan 13 and recent breakout level
- SUP 4: $53.67 - 20-day EMA
WTI futures maintain a bullish tone. Last week, futures traded above former resistance at $53.94, Jan 13 high and a bull trigger. The breach of this level confirmed a resumption of the underlying uptrend and paves the way for strength towards $59.06 next, a Fibonacci projection. Further out, sights are set on $60.00. Key trend support remains $51.44, Jan 22 low where a break is required to signal a top. Initial support is at $56.43, Feb 5 low.
GOLD TECHS: Testing The 20-day EMA
- RES 4: $1892.8 - 61.8% retracement of the Jan 6 - Feb 4 sell-off
- RES 3: $1875.7 - High Jan 29 and key near-term resistance
- RES 2: $1857.5 - 50-day EMA
- RES 1: $1834.9 - 20-day EMA
- PRICE: $1841.5 @ 07:25 GMT Feb 9
- SUP 1: $1807.9 - Low Feb 8
- SUP 2: $1785.0 - Low Feb 4
- SUP 3: $1775.9 - Low Dec 1
- SUP 4: $1764.8 - Low Nov 30
Gold has found support this week and is extending the rebound from last week's low of $1785.0. The yellow metal has arrived at the 20-day EMA at $1843.9. A break of this average would expose the 50-day EMA at $1857.5. Clearance of both averages would be a bullish development and open resistance at $1875.7, the Jan 29 high. On the downside, sub $1785.0 levels would instead resume the recent bearish pressure.
SILVER TECHS: Corrective Bounce
- RES 4: $30.100 - High Feb 1
- RES 3: $29.053 - High Feb 2
- RES 2: $28.000 - Round number resistance
- RES 1: $27.610 - Intraday high
- PRICE: $27.436 @ 07:49 GMT Feb 9
- SUP 1: $25.785 - 50-day EMA
- SUP 2: $25.483 - 76.4% retracement of the Jan 18 - Feb 1 rally
- SUP 3: $24.700 - Low Jan 27
- SUP 4: $24.057 - Low Jan 18 and a key support
Silver traded sharply higher Feb 1 clearing resistance at $27.931, Jan 6 high. The climb resulted in a test of $30.00 and registered a fresh trend high print of the upleg that started mid-March last year. On Feb 2 though, price action reversed the previous day's direction and Silver still remains vulnerable, despite the recent move higher from$25.905, Feb 4 low. Further weakness would open $25.483, a Fibonacci retracement. Key resistance is at $30.100.
Why MNI
MNI is the leading provider
of intelligence and analysis on the Global Fixed Income, Foreign Exchange and Energy markets. We use an innovative combination of real-time analysis, deep fundamental research and journalism to provide unique and actionable insights for traders and investors. Our "All signal, no noise" approach drives an intelligence service that is succinct and timely, which is highly regarded by our time constrained client base.Our Head Office is in London with offices in Chicago, Washington and Beijing, as well as an on the ground presence in other major financial centres across the world.