
Why MNI
MNI is the leading provider
of intelligence and analysis on the Global Fixed Income, Foreign Exchange and Energy markets. We use an innovative combination of real-time analysis, deep fundamental research and journalism to provide unique and actionable insights for traders and investors. Our "All signal, no noise" approach drives an intelligence service that is succinct and timely, which is highly regarded by our time constrained client base.Our Head Office is in London with offices in Chicago, Washington and Beijing, as well as an on the ground presence in other major financial centres across the world.
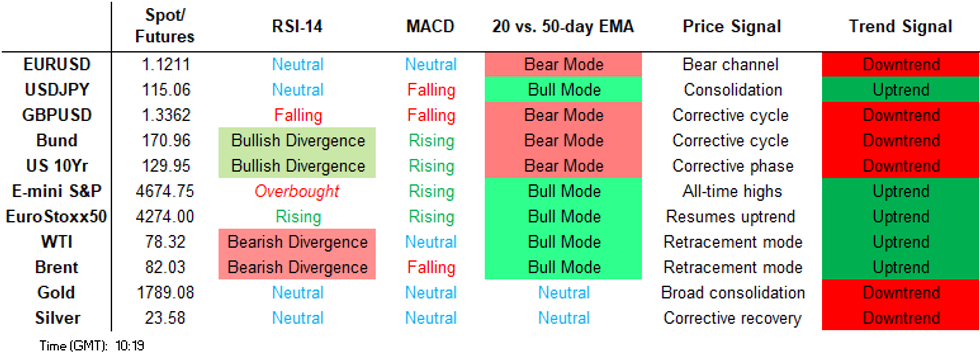
Price Signal Summary - S&P E-Minis Bearish Shooting Star Candle
- In the equity space, charts are highlighting some short-term bearish threats. {US} S&P E-minis failed to hold onto Monday's high. In pattern terms, the candle formation on this day is a shooting star and does highlight a potential short-term top. If correct, this leaves support at 4625.25 exposed, the Nov 10 low. Key resistance is Monday's high of 4740.50. The recent sell-off has been steeper in EUROSTOXX 50 futures. The contract has traded through the 20-day EMA and this exposes the 50-day EMA at 4233.80. This average is a key support parameter.
- In FX, trend conditions are unchanged in the USD and the uptrend remains firmly intact. EURUSD remains in a downtrend. The pair is trading below the base of its bear channel drawn from the Jun 1 high. The focus is on 1.1185 next, the Jul 1, 2020 low. Resistance is at 1.1374, the Nov 18 high. GBPUSD probed support at 1.3353, the Nov 12 low. The focus is on 1.3334, 1.00 projection of the Sep 14 - 29 - Oct 20 price swing. Resistance is at 1.3514, the Nov 18 high. USDJPY has cleared last week's high and breached the 115.00 handle. This confirms a resumption of the underlying uptrend with attention on 115.51 next, the Mar 10, 2017 high. Support has been defined at 113.59, the Nov 19 low.
- On the commodity front, Gold remains vulnerable following this week's move lower. The yellow metal has cleared the 20- and 50-day EMAs and this opens the base of a bull channel at $1755.4. The channel is drawn off the Aug 9 low. WTI futures have rebounded off recent lows. Further gains would open $80.68, Nov 16 high where a break would strengthen short-term conditions for bulls. Key short-term support has been defined at $74.76, Nov 22 low.
- In the FI space, Bund futures have pulled back from recent highs. A deeper pullback would expose the key support at 170.06, Nov 5 low. Gilts maintain a bullish tone. Watch key support at 125.40, Nov 17 low. A break would alter the picture.
FOREIGN EXCHANGE
EURUSD TECHS: Consolidating At Its Lows
- RES 4: 1.1755 High Sep 22
- RES 3: 1.1620/92 Bear channel top from Jun 1 high / High Oct 28
- RES 2: 1.1514 Low Nov 5
- RES 1: 1.1374/1431 High Nov 18 / 20-day EMA
- PRICE: 1.1221 @ 09:47 GMT Nov 24
- SUP 1: 1.1185 Low Jul 1, 2020
- SUP 2: 1.1128 1.764 proj of the Jan 6 - Mar 31 - May 25 price swing
- SUP 3: 1.1040 76.4% retracement of the Mar '20 - Jan '21 uptrend
- SUP 4: 1.0976 2.00 proj of the Jan 6 - Mar 31 - May 25 price swing
EURUSD has traded lower this morning. The trend condition remains bearish. The move lower continues to cement the downtrend and price is trading below the base of the bear channel drawn from the Jun 1 high. The objective of 1.1222, a Fibonacci projection, has been met. The focus is on 1.1185 next, Jul 1 2020 low. Initial resistance is at 1.1374, Nov 18 high with the 20-day EMA at 1.1431. A break of 1.1374 would ease bearish pressure.
GBPUSD TECHS: Trend Needle Points South
- RES 4: 1.3913 High Sep 14 and a key resistance
- RES 3: 1.3835 High Oct 20
- RES 2: 1.3698 High Nov 4
- RES 1: 1.3514/3607 High Nov 18 and a key resistance / High Nov 9
- PRICE: 1.3382 @ 06:03 GMT Nov 24
- SUP 1: 1.3343 Low Nov 23
- SUP 2: 1.3334 1.00 proj of the Sep 14 - 29 - Oct 20 price swing
- SUP 3: 1.3304 Low Dec 22, 2020
- SUP 4: 1.3216 1.236 proj of the Sep 14 - 29 - Oct 20 price swing
GBPUSD traded lower yesterday and probed support at 1.3353, the Nov 12 low. The outlook remains bearish and further downside is likely near-term. The recent breach of 1.3412, Sep 29 low has strengthened the case for bears and confirmed a resumption of the downtrend. Furthermore, MA studies are in a bear mode, reinforcing current conditions. The focus is on 1.3334 next, a Fibonacci projection. Firm resistance is seen at 1.3514, Nov 9 high.
EURGBP TECHS: Downtrend Remains Intact
- RES 4: 0.8595/98 High Nov 5 / 76.4% of the Sep 29 - Oct 26 sell-off
- RES 3: 0.8538/74 High Nov 15 / High Nov 11
- RES 2: 0.8493 50-day EMA
- RES 1: 0.8463- Nov 3 low and the 20-day EMA
- PRICE: 0.8401 @ 06:07 GMT Nov 24
- SUP 1: 0.8381 Low Nov 22
- SUP 2: 0.8356 Low Feb 26, 2020
- SUP 3: 0.8339 Low Feb 25, 2020
- SUP 4: 0.8282/77 Low Feb 18, 2020 / Low Dec 13, 2019
EURGBP is consolidating. The cross remains in a downtrend and continues to trade near recent lows. The recent sharp sell-off, together with the break of support at 0.8403, Oct 26 low signals scope for an extension lower. The focus is on 0.8356 next, Feb 26, 2020 low. Note that the cross is also approaching the base - at 0.8300/8280 - of a broad multi-year range and this area represents a major support. Initial resistance is seen at 0.8463.
USDJPY TECHS: Bullish Focus
- RES 4: 117.53 High Jan 9, 2017
- RES 3: 116.87 High Jan 11, 2017
- RES 2: 116.09 1.764 proj of Apr 23 - Jul 2 - Aug 4 price swing
- RES 1: 115.51 High Mar 10, 2017
- PRICE: 114.92 @ 06:13 GMT Nov 24
- SUP 1: 113.59 Low Nov 19 and key near-term support
- SUP 2: 113.02/73 50-day EMA / Low Nov 9
- SUP 3: 112.08 High Sep 30 and a recent breakout level
- SUP 4: 111.51 Low Oct 8
USDJPY remains in an uptrend. Tuesday's gains confirmed a resumption of the uptrend following the break of last week's high of 114.99 on Nov 17. Furthermore, the break higher negated a recent bearish engulfing candle and this too reinforces current bullish conditions. The focus is on 115.51, Mar 10, 2017 high next. On the downside, key short-term support has been defined 113.59, Nov 19 low. A break would signal a possible short-term top.
EURJPY TECHS: Short-Term Trend Needle Still Points South
- RES 4: 132.56 High Nov 4
- RES 3: 131.59 High Nov 5
- RES 2: 130.55 50-day EMA
- RES 1: 129.99/130.12 High Nov 19 / High Nov 16
- PRICE: 129.28 @ 06:29 GMT Nov 24
- SUP 1: 127.98/93 Low Nov 19 / Low Sep 22 and a key support
- SUP 2: 127.28 1.00 proj of the Jun 1 - Sep 22 - Oct 20 price swing
- SUP 3: 127.04 Low Feb 15
- SUP 4: 126.65 Low Feb 10
EURJPY continues to trade above last week's 127.98 low. The short-term outlook remains bearish. Recent weakness resulted in a print below 128.33, Oct 6 low. A clear break would leave key support at 127.93 exposed, the Sep 22 low. Clearance of 127.93 would confirm an important technical break and open 127.28, a Fibonacci projection level. 129.99, the Nov 19 high marks initial resistance. A break is needed to ease bearish pressure.
AUDUSD TECHS: Remains Below The Bull Channel Base
- RES 4: 0.7529/57 200-dma / 50.0% of the Feb - Aug sell-off
- RES 3: 0.7432/7471 High Nov 9 / High Nov 4
- RES 2: 0.7371 High Nov 15
- RES 1: 0.7293 High Nov 18
- PRICE: 0.7216 @ 06:34 GMT Nov 24
- SUP 1: 0.7192 Low Oct 1
- SUP 2: 0.7170 Low Sep 29
- SUP 3: 0.7106 Low Aug 20 and a major support
- SUP 4: 0.7049 Low Nov 4, 2020
AUDUSD remains soft. The pair has breached the base of its bull channel drawn from the Aug 20 low. The break of this area of support at 0.7260 reinforces bearish conditions and signals scope for a deeper short-term pullback. The move lower has opened 0.7170, Sep 29 low where a break would expose 0.7106 further out, Aug 20 low. Resistance to watch is at 0.7371, Nov 15 high.
USDCAD TECHS: Northbound
- RES 4: 1.2896 High Sep 20 and a key resistance
- RES 3: 1.2849 High Sep 21
- RES 2: 1.2775 High Sep 29
- RES 1: 1.2745 High Nov 23
- PRICE: 1.2681 @ 06:42 GMT Nov 24
- SUP 1: 1.2585/2493 Low Nov 19 / 16
- SUP 2: 1.2387 Low Nov 1o
- SUP 3: 1.2288 Low Oct 21 and the bear trigger
- SUP 4: 1.2253 Low Jun 23
USDCAD traded higher again yesterday as the pair continues to retrace the Sep - Oct sell-off. Price has now topped the October high of 1.2739 and is approaching 1.2753, 76.4% of the Sep 20 - Oct 21 sell-off and 1.2775, Sep 29 high. Clearance of these levels would set the scene for a climb towards 1.2896, the Sep 20 high. On the downside, a key short-term support has been defined at 1.2493, the Nov 16 low.
FIXED INCOME BUND TECHS:
(Z1) Pullback Still Considered Corrective
- RES 4: 173.93 High Aug 25
- RES 3: 173.54 High Aug 31
- RES 2: 172.95 61.8% retracement of the Aug - Nov sell-off
- RES 1: 172.57 High Nov 22
- PRICE: 171.01 @ 05:05 GMT Nov 24
- SUP 1: 170.56 Low Nov 23
- SUP 2: 170.06 Low Nov 5
- SUP 3: 168.98 Low Nov 3
- SUP 4: 167.69 Low Nov 1 and the bear trigger
Bund futures traded lower yesterday. For now, the pullback is considered corrective as long as support at 170.06 remains intact, the Nov 5 low. Last week's rally confirmed a resumption of the uptrend and the recent breach of 171.95 - 61.8% of the Aug - Nov sell-off opens potential for gains toward 172.95, the 76.4% retracement. A break of 170.06 however would alter the picture.
BOBL TECHS: (Z1) Remains Above Support
- RES 4: 136.14 High Aug 25
- RES 3: 136.00 Round number resistance
- RES 2: 135.870 High Sep 3
- RES 1: 135.690 High Nov 22
- PRICE: 135.160 @ 05:17 GMT Nov 24
- SUP 1: 134.954 50-day EMA
- SUP 2: 134.700/320 Low Nov 11 / Low Nov 3
- SUP 3: 133.900/690 Low Nov 2
- SUP 4: 133.340 Low Mar 19 and key medium-term support (cont)
Bobl futures remain in an uptrend and the most recent pullback is still likely a correction. The contract last week breached resistance at 135.320, Nov 15 high. This confirmed a resumption of the short-term uptrend and has opened 135.870 next, Sep 3 high. The break higher also signals scope for a climb towards 136.00 and beyond further out. Key short-term support lies at 134.700, Nov 11 low. A break would reverse the direction.
SCHATZ TECHS: (Z1) Uptrend Remains Intact
- RES 4: 112.656 76.4% retracement of the Mar - Jun 2020 sell-off
- RES 3: 112.585 High Mar 17 2020 (cont)
- RES 2: 112.505 High Nov 4 2020 (cont) and a key resistance
- RES 1: 112.495 High Nov 22
- PRICE: 112.425 @ 05:31 GMT Nov 24
- SUP 1: 112305/255 20- and 50-day EMAs
- SUP 2: 112.100 Low Nov 3
- SUP 3: 112.050 Low Nov 2
- SUP 4: 111.945 Low Oct 28 and major support
The Schatz futures outlook remains bullish following last week's gains and the recent pullback is considered corrective. The recent break higher confirmed a resumption of the short-term uptrend and has paved the way for gains towards 112.505 next, Nov 4 2020 high (cont). Note that the breach of 112.415 resulted in a 100.0% retracement of the Aug -Sep sell-off, reinforcing the bullish theme. Initial firm support lies at 112.255, the 50-day EMA.
GILT TECHS: (Z1) Watching Support
- RES 4: 128.18 High Sep 10 and 14
- RES 3: 127.95 76.4% retracement of the Aug - Oct downleg
- RES 2: 127.69 High Sep 21
- RES 1: 127.02/29 High Nov 22 / High Nov 9 and the bull trigger
- PRICE: 125.84 @ Close Nov 23
- SUP 1: 125.40 Low Nov 17
- SUP 2: 124.79/25 Low Nov 4 / Low Nov 1
- SUP 3: 123.43 Low Oct 21 and the bear trigger
- SUP 4: 123.16 Low Feb 27, 2019 (cont)
The near-term outlook in Gilt futures remains bullish and short-term pullbacks are still considered corrective. A double bottom reversal confirmed on Oct 27 together with a bullish price sequence of higher highs and higher lows, highlights the current bullish condition. A resumption of strength would refocus attention on 127.69 next, Sep 21 high. Initial firm support has been defined at 125.40, the Nov 17 low. A break would alter the picture.
BTP TECHS: (Z1) Breaches A Key Short-Term Support
- RES 4: 155.14 High Aug 31
- RES 3: 154.64 High Sep 22 / 23 and a key resistance
- RES 2: 153.59 High Sep 24
- RES 1: 151.96/153.12 50-day EMA / High Nov 10 and the bull trigger
- PRICE: 150.53 @ Close Nov 23
- SUP 1: 150.31 Low Nov 23
- SUP 2: 149.41 61.8% retracement of the Nov 1 - 10 rally
- SUP 3: 148.54 76.4% retracement of the Nov 1 - 10 rally
- SUP 4: 147.12 Low Nov 1 and the bear trigger
BTP futures continued to face resistance yesterday and the move lower resulted in a breach of support 150.72, Nov 12 low. The break lower undermines the recent bull theme and a deeper sell-off would open 149.41, a Fibonacci retracement level. On the upside, key short-term resistance has been defined at 153.12, Nov 10 high where a break is required to reinstate the recent bullish theme.
EQUITIES
EUROSTOXX 50 TECHS: (Z1) Correction Extends Beyond The 20-Day EMA
- RES 4: 4498.00 High Dec 27, 2007 (cont)
- RES 3: 4448.00 High Jan 2, 2008 (cont)
- RES 2: 4420.80 1.382 proj of the Jul 19 - Sep 6 - Oct 6 price swing
- RES 1: 4409.50 High Nov 18
- PRICE: 4297.50 @ 05:50 GMT Nov 24
- SUP 1: 4263.00 Low Nov 23
- SUP 2: 4233.80/4223.00 50-day EMA / High Sep 6
- SUP 3: 4119.00 Low Oct 18
- SUP 4: 4004.00 / 3949.50 Low Oct 12 / Low Oct 6 and bear trigger
EUROSTOXX 50 futures started the week on a softer note and traded lower yesterday. The pullback is considered corrective and is allowing a recent overbought condition to unwind. Price has cleared the 20-day EMA and the break signals potential for a deeper decline potentially towards the 50-day EMA at 4233.80. The bull trigger is the recent 4409.50 high. A break would resume the uptrend.
E-MINI S&P (Z1): Remains Below Monday's High
- RES 4: 4842.75 2.00 proj of Jul 19 - Aug 16 - 19 price swing
- RES 1: 4800.00 Round number resistance
- RES 2: 4783.40 1.764 proj of Jul 19 - Aug 16 - 19 price swing
- RES 1: 4740.50/46.68 High Nov 22 / 1.618 of Jul 19-Aug 16-19 swing
- PRICE: 4689.75 @ 06:51 GMT Nov 24
- SUP 1: 4625.25 Low Nov 10
- SUP 2: 4556.96/4543.75 50-day EMA / Low Oct 27
- SUP 3: 4472.00 High Sep 27
- SUP 4: 4317.25/4260.00 Low Oct 12 / Low Oct 1 and the bear trigger
S&P E-minis failed to hold onto Monday's high of 4740.50. The reversal lower highlights a bearish candle formation - a shooting star. Yesterday's initial extension reinforces the bearish nature of the candle pattern and exposes support at 4625.25, the Nov 10 low. A break of this support would signal scope for a deeper pullback towards the 50-day EMA at 4555.96. On the upside, clearance of 4740.50 would reinstate a bullish theme.
COMMODITIES
BRENT TECHS: (F2) Extends Gains From Recent Lows
- RES 4: $87.73 - 2.00 proj of the Aug 23 - Sep 3 - Sep 9 price swing
- RES 3: $87.00 - Round number resistance
- RES 2: $85.77 - High Oct 25 and the bull trigger
- RES 1: $83.14 - High Nov 16
- PRICE: $82.63 @ 06:50 GMT Nov 24
- SUP 1: $77.58 - Low Nov 22
- SUP 2: $77.19 - 38.2% retracement of the Aug 23 - Oct 25 rally
- SUP 3: $75.80 - Low Sep 30
- SUP 4: $74.70 - High Sep 15
Brent futures have rebounded off recent lows and the contract continues to strengthen. Price is approaching resistance at $83.14, Nov 16 high where a break would strengthen conditions for bulls. This would signal potential for a climb towards the major resistance of $85.77, Oct 25 high. On the downside, key short-term support has been defined at $77.58, Nov 22 low. A break would be bearish.
WTI TECHS: (F2) Still Finding Support
- RES 4: $85.00 - Round number resistance
- RES 3: $84.50 - 1.236 proj of the Sep 21 - Oct 6 - 7 price swing
- RES 2: $83.30/83.83 - High Nov 10 / High Oct 25 and the bull trigger
- RES 1: $80.68 - Low Nov 4 / High Nov 16
- PRICE: $78.91 @ 06:57 GMT Nov 24
- SUP 1: $74.76 - Low Nov 22 and the bear trigger
- SUP 2: $74.25 - Low Oct 7 and key near-term support
- SUP 3: $72.36 - Low Sep 30
- SUP 4: $70.81 - Low Sep 23
WTI futures have rebounded off recent lows and the contract continues to strengthen. Further gains would open $80.68, Nov 16 high where a break would strengthen short-term conditions for bulls. This would signal potential for a climb towards the major resistance of $83.83, the Oct 25 high. On the downside, key short-term support has been defined at $74.76, Nov 22 low. A break would be bearish.
GOLD TECHS: Heading Towards The Channel Base
- RES 4: $1909.7 - High Jun 3
- RES 3: $1903.8 - High Jun 8
- RES 2: $1877.2/82.8 High Nov 16 / Bull channel top
- RES 1: $1823.0/49.1 - 20-day EMA / High Nov 22
- PRICE: $1795.8 1 @ 07:16 GMT Nov 24
- SUP 1: $1782.0 - LOw Nov 23
- SUP 2: $1759.0 - Low Nov 3 and a key support
- SUP 3: $1755.4 - Bull Channel base drawn from the Aug 9 low
- SUP 4: $1721.7 - Low Sep 29 and a key support
Gold remains vulnerable. The yellow metal has sold off sharply this week as it pulls further away from $1877.2, the Nov 16 high. Price has moved back below the 20- and the 50-day EMA. The clear breach of these averages suggests scope for a deeper pullback towards the base of a bull channel at $1755.4. The channel is drawn off the Aug 9 low. Initial resistance is at $1823.0, the 20-day EMA.
SILVER TECHS: Approaching A Firm Support
- RES 4: $26.778 - High Jul 6
- RES 3: $26.467 - High Jul 14
- RES 2: $26.002 - High Aug 4 and a key resistance
- RES 1: $25.406 - High Nov 16
- PRICE: $23.627 @ 07:18 GMT Nov 24
- SUP 1: $23.020 - Low Nov 3 and a key near-term support
- SUP 2: $22.213 - Low Oct 6
- SUP 3: $21.423 - Low Sep 29 and key support
- SUP 4: $20.871 - 50.0% retracement of the Mar '20 - Feb '21 rally
Silver continues to pull away from recent highs. The metal has traded through the 50-day EMA. The breach of this average suggests scope for a deeper short-term pullback and opens $23.020, the Nov 3 low and a firm near-term support. For bulls, a break of $25.406, Nov 16 high would reinstate a bullish theme and confirm a resumption of the uptrend. This would open $26.002, the Aug 4 high.
Why MNI
MNI is the leading provider
of intelligence and analysis on the Global Fixed Income, Foreign Exchange and Energy markets. We use an innovative combination of real-time analysis, deep fundamental research and journalism to provide unique and actionable insights for traders and investors. Our "All signal, no noise" approach drives an intelligence service that is succinct and timely, which is highly regarded by our time constrained client base.Our Head Office is in London with offices in Chicago, Washington and Beijing, as well as an on the ground presence in other major financial centres across the world.