
Why MNI
MNI is the leading provider
of intelligence and analysis on the Global Fixed Income, Foreign Exchange and Energy markets. We use an innovative combination of real-time analysis, deep fundamental research and journalism to provide unique and actionable insights for traders and investors. Our "All signal, no noise" approach drives an intelligence service that is succinct and timely, which is highly regarded by our time constrained client base.Our Head Office is in London with offices in Chicago, Washington and Beijing, as well as an on the ground presence in other major financial centres across the world.
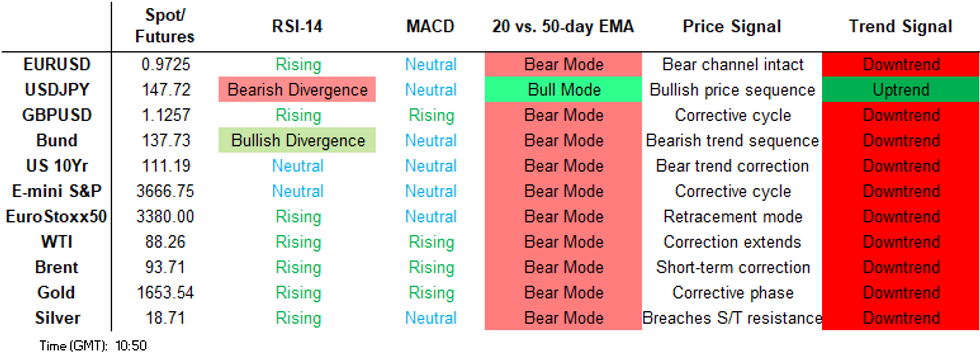
Price Signal Summary - Reversal Higher In S&P E-Minis Signals The Start Of A Corrective Cycle
- In the equity space, a volatile session on Thursday in S&P E-Minis resulted in a strong bounce from the day low as well as the trend low of 3502.00. The recovery suggests the contract has entered a corrective phase and if correct, this will allow an oversold trend condition to unwind. Attention is on 3737.94, the 20-day EMA. A break would reinforce a bullish theme. Key support and the bear trigger lies at 3502.00.The EUROSTOXX 50 futures traded in a volatile manner Thursday, rebounding sharply from the day low of 3251.00. The contract has traded above the 20-day EMA and this is a positive development. The focus is on the 50-day EMA at 3476.80 and resistance at 3492.00, the Oct 6 high. On the downside, the key support zone to watch is at 3251.00-3236.00, the Oct 13 / 3 lows.
- In FX, EURUSD traded to a fresh weekly low Thursday. Gains are considered corrective and the pair remains in bear mode. The reversal from 0.9999 on Oct 4 marked a failure at the top of the bear channel drawn from the Feb 10 high. The focus is on 0.9536, the Sep 28 low. GBPUSD traded higher Thursday. A continuation would signal scope for a test and possible breach of 1.1495, the Oct 5 high and bull trigger. The pair is through the 20-day EMA and this has improved short-term conditions for bulls. A resumption of weakness would instead expose 1.0922 and 1.0787, the 50.0% and 61.8% retracement of Sep 26 - Oct 5 bull cycle. USDJPY maintains a bullish tone. This week's climb has resulted in a break of 145.90, Sep 22 high, confirming a resumption of the primary uptrend. Attention is on 147.66, the Aug 1998 high. The level has been pierced, a clear break would open 148.42, the 1.382 projection of the May 24 - Jul 14 - Aug 2 price swing.
- On the commodity front, the recent strong reversal in Gold signals the end of the recovery between Sep 28 - Oct 4 and note that price has moved below the trendline resistance drawn from the Mar 8 high. The focus is on $1615.0, the Sep 28 low. In the Oil space, the reversal higher in WTI futures on Thursday undermines the bearish theme that developed earlier this week. A key short-term support has been defined at $85.56, yesterday’s low, where a break would resume bearish activity. A continuation higher would expose resistance at $93.64, the Oct 10 high.
- In the FI space, the broader bearish theme in Bund futures remains intact. The focus is on 135.52, the Sep 28 low and key support. This level was probed Wednesday, a clear break would confirm a resumption of the downtrend and open the 135.00 handle. Resistance is at 139.21, the 20-day EMA. Gilt futures remain bearish following the reversal from last week’s high. The focus is on 90.99, Sep 28 low and bear trigger. This level has been pierced, a clear break would open the psychological 90.00 handle. Short-term gains are considered corrective. Resistance is at 97.65, the 20-day EMA.
FOREIGN EXCHANGE
EURUSD TECHS: Corrective Bounce
- RES 4: 1.0198 High Sep 12 and a key resistance
- RES 3: 1.0051 High Sep 20
- RES 2: 0.9936/9999 Bear channel top from Feb 10 high / High Oct 4
- RES 1: 0.9812 20-day EMA
- PRICE: 0.9783 @ 06:03 BST Oct 14
- SUP 1: 0.9633 Low Oct 13
- SUP 2: 0.9536 Low Sep 28 and key support
- SUP 3: 0.9501 1.382 projection of the Aug 10 - Sep 6 - 12 price swing
- SUP 4: 0.9398 Bear channel base drawn from the Feb 10 high
EURUSD traded to a fresh weekly low Thursday, before recovering. Gains are considered corrective and the pair remains in bear mode. The reversal from 0.9999 on Oct 4 marked a failure at the top of the bear channel drawn from the Feb 10 high and this strengthens a bearish theme. The focus is on 0.9536, the Sep 28 low. 0.9999 is a key resistance. Note that the channel top is at 0.9936 and also represents a key hurdle for bulls.
GBPUSD TECHS: Has Breached The 20-Day EMA
- RES 4: 1.1738 High Sep 13 and a key resistance
- RES 3: 1.1590 High Sep 14
- RES 2: 1.1468/1495 50-day EMA / High Oct 5 and the bull trigger
- RES 1: 1.1380 High Oct 13
- PRICE: 1.1328 @ 06:16 BST Oct 14
- SUP 1: 1.1215 20-day EMA
- SUP 2: 1.0924/22 Low Oct 12 / 50.0% of Sep 26 - Oct 5 bull cycle
- SUP 3: 1.0787 61.8% retracement of Sep 26 - Oct 5 bull cycle
- SUP 4: 1.0541/0350 Low Sep 28 / All Time Low
GBPUSD traded higher Thursday, extending the bounce from Wednesday's 1.0924 low. The recent move lower appears to be a correction. A continuation higher would signal scope for a test and possible breach of 1.1495, the Oct 5 high and bull trigger. The pair is through the 20-day EMA and this has improved short-term conditions for bulls. A resumption of weakness would instead expose 1.0922 and 1.0787, Fibonacci retracement levels.
EURGBP TECHS: Breaches The 50-Day EMA
- RES 4: 0.9292 High Sep 11 2020
- RES 3: 0.9066/9266 High Sep 28 / High Sep 26 and key resistance
- RES 2: 0.8980 High Sep 29
- RES 1: 0.8750/8867 20-day EMA / High Oct 12
- PRICE: 0.8637 @ 06:19 BST Oct 14
- SUP 1: 0.8559 76.4% retracement of the Aug 2 - Sep 26 rally
- SUP 2: 0.8522 Low Aug 30
- SUP 3: 0.8471 Low Aug 28
- SUP 4: 0.8408 Low Aug 24
EURGBP traded lower Thursday as the cross extended the pullback from Wednesday’s high of 0.8867. The sell-off has resulted in a break of support at 0.8649 and a move below the 50-day EMA, at 0.8676. This signals scope for an extension and has opened 0.8559, a Fibonacci retracement level. Key short-term resistance has been defined at 0.8867 where a break is required to reinstate a bullish theme.
USDJPY TECHS: Sights Are On The August 1998 High
- RES 4: 150.00 Psychological round number
- RES 3: 149.22 3.382 proj of the Aug 2 - 8 - 11 price swing
- RES 2: 148.42 1.382 proj of the May 24 - Jul 14 - Aug 2 price swing
- RES 1: 147.66/67 High Aug 1998 and a key resistance / Intraday high
- PRICE: 147.45 @ 06:28 BST Oct 14
- SUP 1: 145.73/144.60 / Low Oct 12 / 20-day EMA
- SUP 2: 143.53 Low Oct 5
- SUP 3: 141.71 50-day EMA
- SUP 4: 140.36 Low Sep 22, and key support
USDJPY maintains a bullish tone and traded higher Thursday. This week's climb has resulted in a break of 145.90, Sep 22 high, confirming a resumption of the primary uptrend. It also marks an extension of the price sequence of higher highs and higher lows. Attention is on 147.66, the Aug 1998 high. The level has been pierced, a clear break would open 148.42, a Fibonacci projection. Firm trend support lies at 144.60, the 20-day EMA.
EURJPY TECHS: Recovery Extends And Bullish Outlook Improves
- RES 4: 148.45 High Dec 15 2014
- RES 3: 147.76 1.236 proj of the May 12 - Jun 28 - Aug 2 price swing
- RES 2: 145.64 High Sep 12 and the bull trigger
- RES 1: 144.48 High Sep 14
- PRICE: 144.24 @ 06:50 BST Oct 14
- SUP 1: 141.88/140.83 20-day EMA / 50-day EMA
- SUP 2: 139.44/137.40 Low Sep 29 / 26 and key support
- SUP 3: 136.02 Low Aug 25
- SUP 4: 135.52 Low Aug 24
EURJPY is extending its recovery from 140.90, Oct 10 high. The cross has this week managed to remain above the 50-day EMA at 140.83 and this level marks a key support. Moving average studies highlight a broader uptrend and a stronger resumption of gains together with a clear break of 144.09, Oct 5 high, would signal scope for further gains near-term. On the downside, a clear break of the 50-day EMA is required to highlight a bearish threat.
AUDUSD TECHS: Retracement Mode
- RES 4: 0.6650 50-day EMA
- RES 3: 0.6656 High Sep 23
- RES 2: 0.6547 High Oct 4 and key resistance
- RES 1: 0.6363/6470 Low Sep 28 / 20-day EMA
- PRICE: 0.6328 @ 06:58 BST Oct 14
- SUP 1: 0.6170 Low Oct 13
- SUP 2: 0.6133 1.382 proj of the Apr 5 - May 12 - Jun 3 price swing
- SUP 3: 0.6099 76.4% retracement of the 2020 - 2021 bull cycle
- SUP 4: 0.6035 1.50 proj of the Apr 5 - May 12 - Jun 3 price swing
AUDUSD traded lower Thursday before rebounding from the day low. A bearish theme remains intact and short-term gains are considered corrective. The pair has this week cleared 0.6363, the Sep 28 low and bear trigger. The break confirms a resumption of the primary downtrend and the print below 0.6200 exposes 0.6133 next, a Fibonacci projection. On the upside, initial firm resistance to watch is 0.6470, the 20-day EMA.
USDCAD TECHS: Uptrend Intact Despite The Pullback
- RES 4: 1.4040 76.4% retracement of the 2020 - 2021 bear cycle
- RES 3: 1.4016 3.382 proj of the Aug 25 - Sep 7 - 13 price swing
- RES 2: 1.4000 Psychological round number
- RES 1: 1.3977 High Oct 13
- PRICE: 1.3725 @ 07:03 BST Oct 14
- SUP 1: 1.3707 Low Oct 13
- SUP 2: 1.3605/03 20-day EMA / Low Oct 4
- SUP 3: 1.3358 Low Sep 21
- SUP 4: 1.3353 50-day EMA
USDCAD traded higher Thursday before reversing the day’s gains. Despite the pullback, a bullish theme remains intact. The latest recovery from 1.3503, Oct 10 high, reinforces bullish conditions and this low represents a key short-term support. Moving average studies continue to highlight an uptrend and 1.3838, the Sep 30 high and key resistance has been cleared, strengthening bullish conditions. Support to watch is 1.3605, the 20-day EMA.
FIXED INCOME
BUND TECHS: (Z2) Corrective Bounce
- RES 4: 144.56 High Sep 12
- RES 3: 143.68 38.2% retracement of the Aug 2 - Sep 28 bear leg
- RES 2: 140.13/42.87 High Oct 6 / 4
- RES 1: 139.21 20-day EMA
- PRICE: 137.20 @ 05:10 BST Oct 14
- SUP 1: 135.14 Low Oct 12 and the bear trigger
- SUP 2: 135.00 Round number support
- SUP 3: 134.76 4.382 proj of the Aug 2 - 12 - 15 price swing
- SUP 4: 134.24 4.50 proj of the Aug 2 - 12 - 15 price swing
Bund futures maintain a softer tone despite a recovery from Wednesday’s low of 135.14. The reversal from 142.87, Oct 4 high, marked the end of the correction between Sep 28 - Oct 4 and confirmed a resumption of the primary downtrend. This reinforces a broader bearish theme and moving average studies remain in a bear mode position. Key resistance has been defined at 142.87. The 20-day EMA, at 139.21, is the first resistance.
BOBL TECHS: (Z2) Bear Threat Remains Present
- RES 4: 122.510 High Sep 12
- RES 3: 121.950 High Oct 4 and the bull trigger
- RES 2: 121.330 High Oct 5
- RES 1: 120.016 20-day EMA
- PRICE: 119.360 @ 05:19 BST Oct 14
- SUP 1: 118.550 Low Oct 13
- SUP 2: 118.020 Low Sep 28 and the bear trigger
- SUP 3: 117.918 2.382 proj of the Aug 25 - Sep 1 - Sep 6 price swing
- SUP 4: 117.630 2.50 proj of the Aug 25 - Sep 1 - Sep 6 price swing
Bobl futures are consolidating and trading closer to recent lows. A bearish outlook remains intact. The reversal from 121.950, Oct 4 high confirmed the end of the corrective cycle between Sep 28 and Oct 4. Attention is on the key support and bear trigger at 118.020, the Sep 28 low. A break of this level would confirm a resumption of the primary downtrend. 121.950 marks key resistance. The 20-day EMA, at 120.016, is the first resistance.
SCHATZ TECHS: (Z2) Bearish Outlook
- RES 4: 108.010 High Sep 13
- RES 3: 107.770 High Oct 4 and key resistance
- RES 2: 107.610 High Oct 5
- RES 1: 107.202 20-day EMA
- PRICE: 106.985 @ 05:39 BST Oct 14
- SUP 1: 106.775 Low Oct 11
- SUP 2: 106.535 Low Sep 26 and key support
- SUP 3: 106.379 2.382 proj of the Aug 25 - Sep 1 - Sep 6 price swing
- SUP 4: 105.800 Low Nov 2008 (cont)
Schatz futures are unchanged and remain in consolidation mode. The primary trend direction remains down. The reversal from 107.770, Oct 4 high signals a resumption of the broader downtrend and attention is on key support and bear trigger at 106.535, Sep 26 low. A break would confirm a resumption of the primary downtrend. Key resistance has been defined at 107.770, where a break would highlight a stronger reversal.
GILT TECHS: (Z2) Gains Considered Corrective
- RES 4: 105.34 High Sep 22
- RES 3: 102.45 High Sep 23
- RES 2: 100.92 High Oct 4 and a key resistance
- RES 1: 97.65 20-day EMA
- PRICE: 94.52 @ Close Oct 13
- SUP 1: 90.99/90.38 Low Sep 28 and the bear trigger / Low Oct 12
- SUP 2: 90.00 Psychological round number
- SUP 3: 88.94 2.764 proj of the May 12 - Jun 16 - Aug 2 swing (cont)
- SUP 4: 86.30 3.00 proj of the May 12 - Jun 16 - Aug 2 swing (cont)
Gilt futures pierced 90.99 on Wednesday, the Sep 28 low. Despite the subsequent recovery and volatile price action, the trend outlook remains bearish and short-term gains are considered corrective. Initial resistance to watch is at 97.65, the 20-day EMA. A break would suggest scope for a stronger corrective bounce and open 100.92, the Oct 4 high and key resistance. On the downside, 90.38, the Oct 12 low, is the bear trigger.
BTP TECHS: (Z2) Bear Trigger Remains Exposed
- RES 4: 119.06 High Sep 8 and a key resistance
- RES 3: 118.51 High Sep 13
- RES 2: 117.05 High Sep 22
- RES 1: 112.79/116.71 20-day EMA / High Oct 4
- PRICE: 110.10 @ Close Oct 13
- SUP 1: 108.85 Low Oct 11
- SUP 2: 108.13 Low Sep 28 and key support
- SUP 3: 107.27 2.382 proj of the Aug 25 - Sep 1 - 8 price swing
- SUP 4: 106.68 2.618 proj of the Aug 25 - Sep 1 - 8 price swing
The BTP futures trend condition remains bearish and this week’s extension reinforces this condition. The reversal from 116.71, the Oct 4 high, signals the end of the corrective cycle between Sep 28 - Oct 4. A continuation lower would open the key support and bear trigger at 108.13, the Sep 28 low. A break of this level would confirm a resumption of the broader downtrend. 116.71 marks the key resistance.
US 10YR FUTURE TECHS: (Z2) Vulnerable Despite Today’s Bounce
- RES 4: 115-13+ Low Sep 7
- RES 3: 114-31+ 38.2% retracement of the Aug 2 - Sep 28 bear leg
- RES 2: 112-25+/113-30 20-day EMA / High Oct 4 and the bull trigger
- RES 1: 111-28+ High Oct 12
- PRICE: 111-03 @ 19:31 BST Oct 13
- SUP 1: 110-00 Psychological Support
- SUP 2: 109-23+ Low Nov 30 2007 (cont)
- SUP 3: 108.23 3.0% 10-dma envelope
- SUP 4: 108-20 1.00 projection of the Oct 4 - 11 - 13 price swing
Treasuries broke out of this week’s consolidative range today, resulting in a break of support at 110-19, the Sep 28 low and bear trigger. Despite the bounce off the day low, the break confirms a resumption of the downtrend and maintains the trend sequence of lower and lower highs. The focus is on the psychological 110.00 handle where a break would further reinforce bearish conditions. Initial key resistance is at 112-25+, the 20-day EMA.
EQUITIES
EUROSTOXX50 TECHS: (Z2) Bull Cycle
- RES 4: 3678.00 High Sep 13 and bull trigger
- RES 3: 3585.00 High Sep 14
- RES 2: 3518.20 Trendline resistance drawn from the Aug 17 high
- RES 1:3476.80/3492.00 50-day EMA / High Oct 6
- PRICE: 3420.00 @ 05:58 BST Oct 14
- SUP 1: 3251.00/3236.00 Low Oct 13 / 3 and a key support zone
- SUP 2: 3305.00 Low Oct 11
- SUP 3: 3236.00/3229.00 Low Oct 3 / Low Nov 9 2020 (cont)
- SUP 4: 3163.00 Low Nov 6 2020
EUROSTOXX 50 futures traded in a volatile manner Thursday, rebounding sharply from the day low of 3251.00. The contract is higher today and price has traded above the 20-day EMA. This highlights a short-term reversal and the start of a bull cycle. The focus is on the 50-day EMA at 3476.80 and resistance at 3492.00, the Oct 6 high. On the downside, the key support zone to watch is at 3251.00-3236.00.
E-MINI S&P (Z2): Reversal Signals The Start Of A Correction
- RES 4: 4023.44 61.8% retracement of the Aug 16 - Oct 13 downleg
- RES 3: 3923.88 50.0% retracement of the Aug 16 - Oct 13 downleg
- RES 2: 3867.00 50-day EMA
- RES 1: 3737.94/3820.00 20-day EMA / High Oct 5
- PRICE: 3706.00 @ 05:37 BST Oct 14
- SUP 1: 3502.00 Low Oct 13 and the bear trigger
- SUP 2: 3491.13 50.0% retracement of the 2020 - 2022 bull cycle
- SUP 3: 3453.78 1.618 proj of the Aug 16 - Sep 7 - 13 price swing
- SUP 4: 3388.70 1.764 proj of the Aug 16 - Sep 7 - 13 price swing
A volatile session on Thursday in S&P E-Minis resulted in a strong bounce from the day low as well as the trend low of 3502.00. The recovery suggests that the contract has entered a corrective phase and if correct, this will allow an oversold trend condition to unwind. Attention is on 3737.94, the 20-day EMA. A break would reinforce a bullish theme and open 3820.00, the Oct 5 high. Key support and the bear trigger lies at 3502.00.
COMMODITIES
BRENT TECHS: (Z2) Recovery Undermines Recent Bearish Threat
- RES 4: $107.41 - 76.4% retracement of the Aug 6 - Sep 26 bear leg
- RES 3: $104.62 - High Jul 5
- RES 2: $101.39 - High Aug 30
- RES 1: $96.46/98.75 - High Oct 11 / 10 and key near-term resistance
- PRICE: $94.75 @ 07:01 BST Oct 14
- SUP 1: $91.08/90.59 - Low Oct 13 / 50.0% of the Sep 26 - Oct 10 rally
- SUP 2: $88.67 - 61.8% retracement of the Sep 26 - Oct 10 rally
- SUP 3: $85.00/82.44 - Low Sep 30 / Low Sep 26 and the bear trigger
- SUP 4: $81.97 - 1.618 proj of the Jul 29 - Aug 5 - 30 price swing
The recovery in Brent futures yesterday undermines the bearish threat that appeared to be strengthening on the back of this week’s move lower from Monday’s high of $98.75. A continuation higher would expose $98.75 and a break of this level would reinstate a bullish theme, signalling scope for a stronger recovery. Key short-term support has been defined at $91.08, yesterday’s low. A break would be bearish.
WTI TECHS: (X2) Finds Support
- RES 4: $104.31 - 76.4% retracement of the Jun 8 - Sep 26 downleg
- RES 3: $98.95 - 61.8% retracement of the Jun 8 - Sep 26 downleg
- RES 2: $96.82 - High Aug 31
- RES 1: $91.35/93.64 - High Oct 11 / 10 and key resistance
- PRICE: $89.19 @ 07:13 BST Oct 14
- SUP 1: $85.56 - Low Oct 13
- SUP 2: $84.94 - 50.0% retracement points of the Sep 26 - Oct 10 rally
- SUP 3: $82.89 - 61.8% retracement points of the Sep 26 - Oct 10 rally
- SUP 4: $79.14/76.25 - Low Sep 30 / 26 and the bear trigger
The reversal higher in WTI futures on Thursday undermines the bearish theme that developed earlier this week. A key short-term support has been defined at $85.56, yesterday’s low, where a break would confirm a resumption of bearish activity. On the upside, a continuation higher would expose resistance at $93.64, the Oct 10 high. A break of this level would strengthen bullish conditions.
GOLD TECHS: Trend Needle Still Pointing South
- RES 4: $1765.5 - High Aug 25
- RES 3: $1745.6 - High Sep 29
- RES 2: $1735.1 - High Sep 12 and a key resistance
- RES 1: $1699.9/1729.5 - High Oct 10 / 4 and the bull trigger
- PRICE: $1670.4 @ 07:16 BST Oct 14
- SUP 1: $1642.5 - Low Oct 13
- SUP 2: $1615.0 - Low Sep 28 and the bear trigger
- SUP 3: $1610.5 - 1.00 proj of the Jun 13 - Jul 21 - Aug 10 swing
- SUP 4: $1569.1 - Low Apr 1 2020
Gold traded in a volatile manner Thursday but maintains a softer tone. The recent recovery stalled at $1729.5, Oct 4 high. The reversal signals the end of the climb between Sep 28 - Oct 4 and note that price has moved below the trendline resistance drawn from the Mar 8 high. A continuation lower would expose the key support and bear trigger at $1615.0, the Sep 28 low. On the upside, a break of $1729.5 is required to reinstate a bullish theme.
SILVER TECHS: Bear Threat Remains Present
- RES 4: $22.253 - 50.0% retracement of the Mar 8 - Sep 1 bear cycle
- RES 3: $21.967 - High Jun 17
- RES 2: $21.540 - High Jun 27
- RES 1: $20.187/21.242 - High Oct 10 / 4 and key resistance
- PRICE: $19.001 @ 08:16 BST Oct 14
- SUP 1: $18.455 - Low Oct 13
- SUP 2: $17.967/562 - Low Sep 28 / Low Sep 1 and bear trigger
- SUP 3: $16.955 - Low Jun 15 2020
- SUP 4: $16.473 - 1.00 proj of the Jun 6 - Jul 14 - Aug 10 price swing
Silver found resistance on Oct 4 at $21.242 on Oct 4. The subsequent reversal has resulted in a break of the 50-day EMA. This suggests potential for a continuation lower and the metal traded lower again yesterday. The clear break of $19.052, the Oct 3 low, has exposed $17.967, the Sep 28 low. Key resistance is at $21.242, where a break is required to reinstate a bullish theme and a stronger reversal.
Why MNI
MNI is the leading provider
of intelligence and analysis on the Global Fixed Income, Foreign Exchange and Energy markets. We use an innovative combination of real-time analysis, deep fundamental research and journalism to provide unique and actionable insights for traders and investors. Our "All signal, no noise" approach drives an intelligence service that is succinct and timely, which is highly regarded by our time constrained client base.Our Head Office is in London with offices in Chicago, Washington and Beijing, as well as an on the ground presence in other major financial centres across the world.