
Why MNI
MNI is the leading provider
of intelligence and analysis on the Global Fixed Income, Foreign Exchange and Energy markets. We use an innovative combination of real-time analysis, deep fundamental research and journalism to provide unique and actionable insights for traders and investors. Our "All signal, no noise" approach drives an intelligence service that is succinct and timely, which is highly regarded by our time constrained client base.Our Head Office is in London with offices in Chicago, Washington and Beijing, as well as an on the ground presence in other major financial centres across the world.
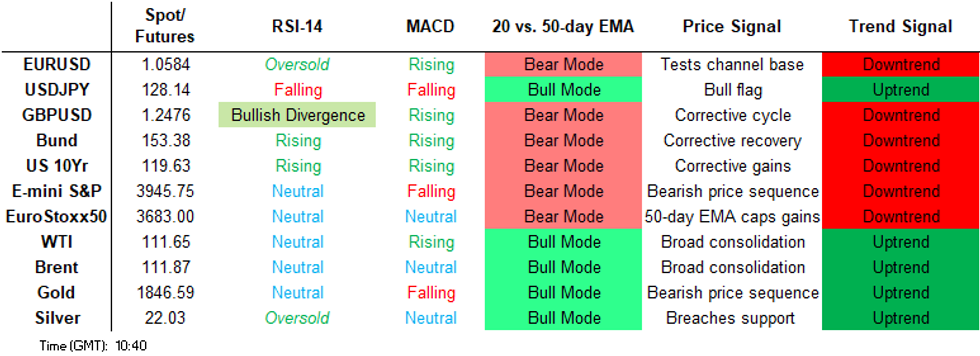
Price Signal Summary - USD Correction Still In Play
- In the equity space, S&P E-Minis found resistance Wednesday at 4095.00. This leaves initial key resistance - 4099.00, the May 9 high - intact. The reversal lower Wednesday signals a resumption of the primary downtrend and attention is on support and bear trigger at 3855.00, May 12 low. A break would resume the downtrend and open 3843.25, the Mar 25 2021 low (cont). Gains are considered corrective and a break of 4099.00 is required to alter the short-term picture. The primary trend direction in EUROSTOXX 50 futures is down. However, the contract remains in a corrective cycle following the recovery from 3466.00, May 10 low. Price has probed resistance at 3732.00, the 50-day EMA. A clear break of this average would improve a short-term bullish theme. On the downside, key support and the bear trigger is unchanged at 3466.00.
- In FX, EURUSD traded higher Thursday and breached resistance at the 20-day EMA. The average intersected at 1.0569 and the move above this level suggests scope for a stronger short-term recovery. This has opened the next key resistance at 1.0642, the May 5 high. Note that the recent bounce from 1.0350, May 13 low, also marks a recovery from the base of a bear channel, drawn from the Feb 10 high. The channel top is at 1.0866. Initial support is at 1.0461, May 18/19 low. Yesterday, GBPUSD reversed Wednesday’s bear leg. The pair has probed resistance at the 20-day EMA, at 1.2492. A clear break of this average would signal scope for a stronger short-term recovery and open 1.2638, the May 4 high and a key resistance. Initial support lies at 1.2317, the May 17 low. USDJPY traded lower Thursday. 127.52, the May 12 low has been breached and this exposes the next key support at 126.95, Apr 27 low. The current pullback is likely a correction, and this is allowing a recent overbought trend reading to unwind. A break of 126.95 would signal scope for an extension towards the 50-day EMA, at 125.69. A reversal higher and a move above 130.05, May 9 high would be bullish.
- On the commodity front, Gold remains vulnerable and short-term gains are considered corrective. The yellow metal traded through $1800.0 on Monday. The focus is on $1780.4, the Jan 28 low. In the Oil space, WTI futures maintain a firm note, following recent gains, and despite the latest pullback. The contract has this week breached resistance at $110.07, Mar 24 high. A resumption of gains would open $116.43, the Mar 7 trend high. Initial support is at $103.24, the May 19 low.
- In the FI, Bund futures resistance has been defined at $155.33 May 12 high. The trend direction remains down and an extension lower would open 150.49, the May 9 and the bear trigger. The broader trend condition in Gilts remains down. The contract has found resistance at 121.07, May 12 high. The bear trigger is at 116.87, May 9 low.
FOREIGN EXCHANGE
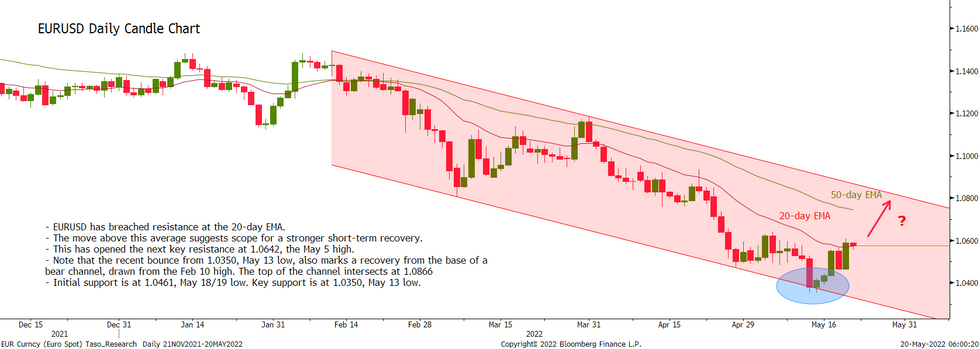
EURUSD TECHS: Breaches The 20-Day EMA
- RES 4: 1.0866 Bear channel resistance drawn from the Feb 10 high
- RES 3: 1.0758 Low Apr 14 and a recent breakout level
- RES 2: 1.0642 High May 5 and key short-term resistance
- RES 1: 1.0607 High May 19
- PRICE: 1.0573 @ 06:05 BST May 20
- SUP 1: 1.0461/350 Low May 18 and19 / Low May 13 and bear trigger
- SUP 2: 1.0341 Low Jan 3 2017 and a key support
- SUP 3: 1.0333 1.236 proj of the Feb 10 - Mar 7 - 31 price swing
- SUP 4: 1.0288 2.0% 10-dma envelope
EURUSD traded higher Thursday and breached resistance at the 20-day EMA. The average intersected at 1.0569 and the move above this level suggests scope for a stronger short-term recovery. This has opened the next key resistance at 1.0642, the May 5 high. Note that the recent bounce from 1.0350, May 13 low, also marks a recovery from the base of a bear channel, drawn from the Feb 10 high. Initial support is at 1.0461, May 18/19 low.
GBPUSD TECHS: Probes Resistance
- RES 4: 1.2772 High Apr 26
- RES 3: 1.2769 50-day EMA
- RES 2: 1.2638 High May 4 and a key resistance
- RES 1: 1.2525 High May 19
- PRICE: 1.2459 @ 06:18 BST May 20
- SUP 1: 1.2317/2156 Low May 17 / Low May 13 and the bear trigger
- SUP 2: 1.2081 76.4% retracement of the Mar ‘20 - Jun ‘21 uptrend
- SUP 3: 1.2000 psychological round number
- SUP 4: 1.1903 1.00 proj of the Apr 14 - 28 - May 4 price swing
GBPUSD traded higher Thursday and in turn reversed Wednesday’s bear leg. The pair has probed resistance at the 20-day EMA, at 1.2492. A clear break of this average would signal scope for a stronger short-term recovery and open 1.2638, the May 4 high and a key resistance. On the downside key support and the bear trigger is unchanged at 1.2156, the May 13 low. Initial support lies at 1.2317, the May 17 low.
EURGBP TECHS: Tuesday’s Low Is Still Intact
- RES 4: 0.8658 High Sep 29 2021
- RES 3: 0.8643 High Sep 30 2021
- RES 2: 0.8619 High May 12 and bull trigger
- RES 1: 0.8534 High May 16
- PRICE: 0.8491 @ 06:34 BST May 20
- SUP 1: 0.8393/ 0.8391 Low May 17 / 61.8% of Apr 14 - May 12 upleg
- SUP 2: 0.8367 Low May 2 and a key support
- SUP 3: 0.8337 76.4% retracement of the Apr 14 - May 12 upleg
- SUP 4: 0.8313 Low Apr 22
EURGBP is unchanged and remains above Tuesday’s 0.8393 low. For now, the recent bear leg is considered corrective, however, given the pace of the sell-off, an extension lower still appears likely. Price has traded through the 20- and 50-day EMAs and this exposes 0.8367, May 2 low and a key support. On the upside, initial firm resistance to watch is at 0.8534, May 16 high. A break would refocus attention on 0.8619, the May 12 high and bull trigger.
USDJPY TECHS: Support Appears Exposed
- RES 4: 133.11 High Apr 4 2002
- RES 3: 132.39 High Apr 15 2002
- RES 2: 131.96 1.00 proj of the Feb 24 - Mar 28 - 31 price swing
- RES 1: 130.05/131.35 High May 12 / High May 9 and the bull trigger
- PRICE: 127.80 @ 06:40 BST May 20
- SUP 1: 127.03 Low May 19
- SUP 2: 126.95 Low Apr 27 and a key support
- SUP 3: 125.09 Low Apr 14
- SUP 4: 124.01 Low Apr 11
USDJPY traded lower Thursday. 127.52, the May 12 low has been breached and this exposes the next key short-term support at 126.95, the Apr 27 low. The current pullback is likely a correction, and this is allowing a recent overbought trend reading to unwind. A break of 126.95 would signal scope for an extension towards the 50-day EMA, at 125.60. A reversal higher and a move above 130.05, May 9 high would be a bullish development.
EURJPY TECHS: Watching Support
- RES 4: 141.06 High Jun 4 2015 and a key resistance
- RES 3: 140.87 0.50 proj of the Mar 7 - 28 - Apr 5 price swing
- RES 2: 138.32/140.00 High May 9 / High Apr 21 and the bull trigger
- RES 1: 136.75 High May 12
- PRICE: 135.18 @ 06:49 BST May 20
- SUP 1: 133.75/132.66 Low May 16 / Low May 12 and the bear trigger
- SUP 2: 132.56100-dma
- SUP 3: 132.20 50% retracement of the Mar 7 - Apr 21 bull phase
- SUP 4: 131.59 Low Mar 22
EURJPY remains below Tuesday’s high of 136.69. The 132.66 low on May 12, has been defined as the key short-term support. The recent recovery still threatens a previous bearish theme. A resumption of gains would open 138.32, the May 9 high and an important short-term resistance. On the downside, clearance of 132.66 is required to reinstate the threat of a deeper retracement.
AUDUSD TECHS: Corrective Bounce Extends
- RES 4: 0.7266 High May 4/5 and a bull trigger
- RES 3: 0.7187 50-day EMA
- RES 2: 0.7135 Low May 6
- RES 1: 0.7073 High May 19
- PRICE: 0.7041 @ 06:56 BST May 20
- SUP 1: 0.6950/29 Low May 18 / Low May 12 and the bear trigger
- SUP 2: 0.6805 Low Jun 22 2020
- SUP 3: 0.6784 0.764 proj of the Apr 5 - May 2 - 4 price swing
- SUP 4: 0.6759 50.0% retracement of the Mar ‘20 - Feb ‘21 upleg
AUDUSD traded higher Thursday and in the process breached 0.7054, the May 11 high. An extension higher would strengthen the current bull cycle and signal potential for a climb towards the 50-day EMA at 0.7187. Gains are still considered corrective and the primary direction remains down. The bear trigger is unchanged at 0.6829, the May 12 low. A break would resume the downtrend.
USDCAD TECHS: Bear Cycle Remains In Play
- RES 4: 1.3185 High Nov 13 2020 and 2.0% 10-dma envelope
- RES 3: 1.3091 High Nov 24 2020
- RES 2: 1.3077 High May 16 and the bull trigger
- RES 1: 1.2896/2982 High May 18 / High May 16
- PRICE: 1.2807 @ 07:01 BST May 20
- SUP 1: 1.2759 50-day EMA
- SUP 2: 1.2714 Low May 5 and a key support
- SUP 3: 1.2568 Low Apr 22
- SUP 4: 1.2459 Low Apr 21
USDCAD remains below 1.3077, May 16 high, and maintains a short-term bearish tone - the pair traded lower Thursday. The recent move down though is considered corrective and the broader outlook is bullish. Recent gains resulted in a breach of 1.2914, May 2 high, and 1.2964, the Dec 20 2021 high. The break of the latter marks an important medium-term bullish development. Key support to watch is at 1.2714, the May 5 low.
FIXED INCOME
BUND TECHS: (M2) Resistance Still Intact
- RES 4: 157.87 High Apr 7
- RES 3: 156.40 50-day EMA
- RES 2: 156.00 High Apr 28 and a key short-term resistance
- RES 1: 155.33 High May 12
- PRICE: 153.77 @ 05:04 BST May 20
- SUP 1: 151.87/150.49 Low May 11 / Low May 9
- SUP 2: 150.15 0.764 proj of the Mar 7 - 29 - Apr 4 price swing
- SUP 3: 150.00 Psychological round number
- SUP 4: 149.49 Low Jul 13 2015 (cont)
Bund futures are trading below recent highs. The trend direction is unchanged and remains down. Recent fresh cycle lows reinforce the bearish condition and maintain the price sequence of lower lows and lower highs - the definition of a downtrend. Moving average studies are still in a bear mode condition. A continuation lower would refocus attention on 150.49, the bear trigger. Firm trend resistance is unchanged at 156.00.
BOBL TECHS: (M2) Primary Trend Still Down
- RES 4: 129.350 High Apr 4 and a reversal point
- RES 3: 128.830 High Apr 7
- RES 2: 128.451 50-day EMA
- RES 1: 128.380 High May 12
- PRICE: 127.230 @ 05:12 BST May 20
- SUP 1: 126.610/126.010 Low May 18 / Low May 6 and a bear trigger
- SUP 2: 126.00 Round number support
- SUP 3: 125.450 0.618 proj of the Mar 7 - 29 - Apr 4 price swing
- SUP 4: 125.260 Low Apr 24 20014 (cont)
Bobl futures remain above the May 6 low but have also pulled away from its recent highs. Price, on May 12, probed resistance at 128.310, the Apr 14/28 high. A resumption of strength and a clear breach of 128.310 would signal scope for a test of the 50-day EMA at 128.451. Short-term gains would be considered corrective however - the primary trend direction remains down. A continuation lower would refocus attention on key support at 126.010.
SCHATZ TECHS: (M2) Sights Are On The Bear Trigger
- RES 4: 111.095 50.0% retracement of the Mar 7 - May 6 downleg
- RES 3: 111.000 Round number resistance
- RES 2: 110.855 High Apr 4
- RES 1: 110.649/110.690 50-day EMA / High May 13
- PRICE: 110.260 @ 04:14 BST May 20
- SUP 1: 109.980 Low May 6 and bear trigger
- SUP 2: 109.777 0.618 proj of the Mar 7 - 30 - Apr 4 price swing
- SUP 3: 109.555 Low Oct 31 2011 (cont)
- SUP 4: 109.340 Low Oct 28 011 (cont)
The primary trend direction in Schatz futures remains down and following the pullback from 110.690, May 13 high, the recent bullish corrective cycle appears to be over. A continuation lower would refocus attention on the bear trigger at 109.980, the May 6 low. The 50-day EMA, at 110.649, remains intact and this indicator represents an important resistance. For bears, a breach of 109.980 would resume the downtrend.
GILT TECHS: (M2) Bearish Theme
- RES 4: 122.72 High Mar 18
- RES 3: 122.35 High Apr 4
- RES 2: 121.84 50.0% retracement of the Mar 1 - May 9 bear leg
- RES 1: 119.95/121.07 High May 19 / High May 12
- PRICE: 119.11 @ Close May 19
- SUP 1: 118.25 Low May 11
- SUP 2: 116.87 Low May 9 and the bear trigger
- SUP 3: 116.35 Low Dec 30 2015 (cont)
- SUP 4: 115.40 1.00 proj of the Mar 1 - 28 - Apr 4 price swing
The primary trend direction in Gilt futures remains down. The pullback from recent highs just above the 50-day EMA, suggests that a correction between May 9 - 12 is over. If correct, a continuation lower would open the key support and bear trigger at 116.87, May 9 low. Key short-term resistance has been defined at 121.07, May 12 high, where a break is required to reinstate a short-term bullish bullish theme.
BTP TECHS: (M2) Corrective Phase Still In Play
- RES 4: 135.23 High Apr 14
- RES 3: 133.58 50-day EMA
- RES 2: 133.53 High Apr 28
- RES 1: 131.24 High May 12
- PRICE: 129.13 @ Close May 19
- SUP 1: 127.24/125.54 Low May 11 / Low May 9 and the bear trigger
- SUP 2: 125.02 1.236 proj of the Mar 1 - 29 - 31 price swing
- SUP 3: 124.02 Low Mar 18 2020 (cont) and a major support
- SUP 4: 123.41 1.382 proj of the of the Mar 1 - 29 - 31 price swing
The trend condition in BTP futures remains bearish and the primary direction is down. A corrective (bullish) cycle has recently been established though and the contract has trade above a trendline resistance drawn from the Mar 1 high. A resumption of strength would signal scope for a move towards 133.53, Apr 28 high. Key support has been defined at 125.54, the May 9 low and the bear trigger. A break would resume the downtrend.
EQUITIES
EUROSTOXX50 TECHS: (M2) 50-Day EMA Offers Resistance
- RES 4: 3944.00 High Mar 29 and a key resistance
- RES 3: 3883.00 High Apr 21
- RES 2: 3775.00 High May 5
- RES 1: 3745.00 High May 18
- PRICE: 3658.00 @ 05:20 BST May 20
- SUP 1: 3576.00/3466.00 Low May 19 / Low May 10 and bear trigger
- SUP 2: 3458.90 76.4% retracement of the Mar 7 - 29 rally
- SUP 3: 3400.00 Round number support
- SUP 4: 3309.00 Low Mar 7 and a major support
The primary trend theme in EUROSTOXX 50 futures remains bearish. A corrective cycle is in play though following the recovery from 3466.00, May 10 low. Price has this week challenged the 50-day EMA, at 3732.00, which has so far capped gains. A clear breach of the EMA would improve a short-term bullish theme and open 3775.00, the May 5 high. Key support and the bear trigger is unchanged at 3466.00, May 10 low.
E-MINI S&P (M2): BearishThreat Remains Present
- RES 4: 4509.00 High Apr 21
- RES 3: 4393.25 High Apr 22
- RES 2: 4303.50 High Apr 26/28 and a key short-term resistance
- RES 1: 4099.00/4240.82 High May 9 / 50-day EMA
- PRICE: 3930.75 @ 06:55 BST May 20
- SUP 1: 3855.00/3843.25 Low May 12 / Low Mar 25 2021 (cont)
- SUP 2: 3820.25 2.50 proj of the Mar 29 - Apr 18 - 21 price swing
- SUP 3: 3787.74 2.618 proj of the Mar 29 - Apr 18 - 21 price swing
- SUP 4: 3747.52 2.764 proj of the Mar 29 - Apr 18 - 21 price swing
S&P E-Minis found resistance at Wednesday’s high of 4095.00. This leaves initial key resistance - 4099.00, the May 9 high - intact. The reversal lower Wednesday signals a potential resumption of the primary downtrend and attention is on support and bear trigger at 3855.00, May 12 low. A break would resume the downtrend and open 3843.25, the Mar 25 2021 low (cont). Clearance of 4099.00 is required to ease the bearish threat.
COMMODITIES
BRENT TECHS: (N2) Bullish Theme Remains Intact
- RES 4: $123.44 - High Mar 8
- RES 3: $121.13 - 76.4% retracement of the Mar 7 - 15 downleg
- RES 2: $115.76 - High Mar 24 and a bull trigger
- RES 1: $115.69 - High May 17
- PRICE: $111.33 @ 07:01 BST May 20
- SUP 1: $105.70/101.30 - Low May 13 / Low May 11
- SUP 2: $99.25 - Low Apr 25 and a key near-term support
- SUP 3: $97.18 - Low Apr 11
- SUP 4: $92.59 - Low Mar 15 and a bear trigger
Brent futures are trading below Tuesday’s high of $115.69. A bullish theme remains intact though. The pair has this week breached resistance at $114.00, May 5 high. This signals potential for an extension higher short-term and has opened $115.76, the Mar 24 high and a bull trigger. A break would open the $120.00 handle. On the downside, key support is unchanged at $101.30, the May 11 low. Initial support is seen at $105.70, the May 19 low.
WTI TECHS: (N2) Short-Term Trend Needle Points North
- RES 4: $120.00 - Psychological round number
- RES 3: $116.43 - High Mar 7 and the trend high
- RES 2: $115.04 - High Mar 8
- RES 1: $113.20 - High May 17
- PRICE: $109.16 @ 09:03 BST May 20
- SUP 1: $103.24 - Low May 19
- SUP 2: $100.97/96.93 - 50-day EMA / Low May 11 and key S/T level
- SUP 3: $94.47 - Low Apr 25
- SUP 4: $92.15 - Low Apr 11 and a key support
WTI futures maintain a bullish theme despite a pullback from this week’s highs. Price has breached resistance at $109.77, May 5 high and this improved the outlook for bulls. Note that $110.07, the Mar 24 high has also been cleared this week. A resumption of gains would open the key resistance and trend high of $116.43 on Mar 7. Key short-term support lies at $96.93, May 11 low.
GOLD TECHS: Corrective Gains
- RES 4: $1919.9 - High Apr 29 and key resistance
- RES 3: $1909.8 - High May 5
- RES 2: $1861.0 - 20-day EMA
- RES 1: $1858.8 - High May 12
- PRICE: $1845.7 @ 07:15 BST May 20
- SUP 1: $1807.5/1787.0 - Low May 18
- SUP 2: $1780.4 - Low Jan 28 and a key support
- SUP 3: $1753.7 - Low Dec 15 2021
- SUP 4: $1749.3 - 1.236 proj of the Mar 8 - 29 - Apr 18 price swing
Gold remains vulnerable despite the recovery from Monday’s low of $1787.0. The yellow metal has this week traded through the $1800.0 handle. This signals scope for $1784.4, the Jan 28 low. Last week’s breach of $1848.8, 76.4% of the Jan 28 - Mar 8 rally, confirmed a resumption of the downtrend. Initial resistance has been defined at $1858.8, the May 12 high ahead of the 20-day EMA at $1861.0.
SILVER TECHS: Corrective Bounce Extends
- RES 4: $24.666 - High Apr 22
- RES 3: $23.974 - Low Mar 29
- RES 2: $23.331 - 50-day EMA
- RES 1: $22.356 - 20-day EMA
- PRICE: $22.039 @ 08:06 BST May 20
- SUP 1: $20.464 - Low May 13 and the bear trigger
- SUP 2: $20.282 - 2.00 proj of the Mar 8 - 29 - Apr 18 price swing
- SUP 3: $20.000 - Psychological round number
- SUP 4: $19.581 - 2.236 proj of the Mar 8 - 29 - Apr 18 price swing
The Silver outlook remains bearish despite the bounce from the May 13 low of $20.464. Recent weakness resulted in a break of support at $22.008, the Feb 3 low and a bear trigger. The move lower reinforced the bearish theme and also resulted in a breach of $21.427/423, the Dec 15 2021 low and Sep 29 2021 low. Sights are on $20.000 next. Firm short-term resistance to watch is at $22.356, the 20-day EMA.
Why MNI
MNI is the leading provider
of intelligence and analysis on the Global Fixed Income, Foreign Exchange and Energy markets. We use an innovative combination of real-time analysis, deep fundamental research and journalism to provide unique and actionable insights for traders and investors. Our "All signal, no noise" approach drives an intelligence service that is succinct and timely, which is highly regarded by our time constrained client base.Our Head Office is in London with offices in Chicago, Washington and Beijing, as well as an on the ground presence in other major financial centres across the world.