
Why MNI
MNI is the leading provider
of intelligence and analysis on the Global Fixed Income, Foreign Exchange and Energy markets. We use an innovative combination of real-time analysis, deep fundamental research and journalism to provide unique and actionable insights for traders and investors. Our "All signal, no noise" approach drives an intelligence service that is succinct and timely, which is highly regarded by our time constrained client base.Our Head Office is in London with offices in Chicago, Washington and Beijing, as well as an on the ground presence in other major financial centres across the world.
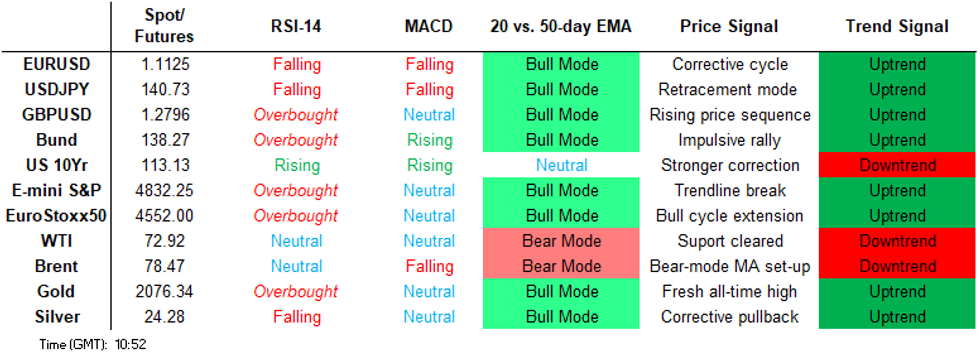
Price Signal Summary - USDJPY Clears Support And Resumes Its Downtrend
- In the equity space, a bullish theme in S&P E-Minis remains intact and this week’s fresh trend highs reinforce current conditions. The contract has recently cleared resistance at 4738.50, the Jul 27 high, reinforcing current positive trend conditions. Sights are on 4854.75 next, a 1.00 projection of the Nov 10 - Dec 1 - 7 price swing. Initial firm support lies at 4726.28, the 20-day EMA. A bullish theme in EUROSTOXX 50 futures remains intact and recent weakness appears to be a correction. Moving average studies are in a bull-mode position, signalling a rising trend cycle. The focus is on 4636.70, the 76.4% retracement of the 2000 - 2009 downleg (cont). Support to watch is 4518.40, the 20-day EMA.
- In FX, EURUSD maintains a positive tone and the pair continues to appreciate - this week’s gains reinforce bullish conditions. Price has recently traded through key resistance at 1.1017, the Nov 29 high and a bull trigger, as well as 1.1081, 76.4% of the Jul - Oct bear leg. This opens 1.1229, the Jul 20 high. Initial firm support is seen at 1.0938, the 20-day EMA. The trend outlook in GBPUSD remains bullish. The pair has breached resistance at 1.2794, the Dec 14 high and traded through 1.2800. This confirms a resumption of the uptrend and opens 1.2881, 76.4% retracement of the Jul 14 - Oct 4 bear leg. Initial firm support has been defined at 1.2612, the Dec 21 low. USDJPY is trading lower today and the pair remains below 144.96, the Dec 9 high. The recent recovery from 140.97, the Dec 14 low, has been a correction and the trend condition remains bearish. Support at 140.97, the Dec 14 low, has been cleared, confirming a resumption of the downtrend that started Nov 13. This opens 140.23, 2.00 projection of the Nov 13 - 21 - 22 price swing. Initial firm resistance is at 144.15, the 20-day EMA.
- On the commodity front, the Dec 13 reversal in Gold and the subsequent move higher points to the end of the Dec 4 - 13 corrective pullback. This week’s move highlights a bullish theme and note that moving average studies are in a bull-mode position too, reflecting an uptrend. A continuation higher has opened $2097.1, 76.4% of the Dec 4 - 13 bear leg. Initial support is at $2031.3, the 20-day EMA. In the oil space, bearish conditions in WTI futures remain intact and recent gains still appear to be a correction. Resistance to watch is $75.80, the 50-day EMA. The average was pierced on Monday. A clear break of it would strengthen a bullish theme and highlight a stronger reversal. For bears, moving average studies are in a bear-mode position, highlighting a downtrend. The trigger for a resumption of the downtrend lies at $67.98, the Dec 13 low.
- In the FI space, the uptrend in Bund futures is intact and the contract traded higher once again yesterday, confirming a resumption of the trend and an extension of the recent break of resistance at 135.81, the Dec 7 high. This maintains the price sequence of higher highs and higher lows. Sights are on 139.39, a 3.382 projection of the Nov of the 13 - 17 - 24 price swing. Firm short-term support is seen at 135.75, the 20-day EMA. The current uptrend in Gilt futures remains intact. The contract traded to a fresh trend high yesterday, reinforcing bullish conditions. This maintains a bullish price sequence of higher highs and higher lows. The focus is on 104.00 next. Firm support lies at 100.20, the Dec 13 high. Short-term weakness would be considered corrective. Initial support lies at 102.05, the Dec 19 high.
FOREIGN EXCHANGE
EURUSD TECHS: Northbound
- RES 4: 1.1276 High Jul 18 and a key resistance
- RES 3: 1.1229 High Jul 20
- RES 2: 1.1150 High Jul 27
- RES 1: 1.1139 Intraday high
- PRICE: 1.1129 @ 10:15 GMT Dec 28
- SUP 1: 1.1017 High Nov 29 and a recent breakout level
- SUP 2: 1.0938/1.0850 20- and 50-day EMA values
- SUP 3: 1.0724 Low Dec 8 and the bear trigger
- SUP 4: 1.0693 Low Nov 14
EURUSD maintains a positive tone and the pair continues to appreciate - this week’s gains reinforce bullish conditions. Price has recently traded through key resistance at 1.1017, the Nov 29 high and a bull trigger, as well as 1.1081, 76.4% of the Jul - Oct bear leg. This opens 1.1229, the Jul 20 high. Moving average studies are in a bull-mode set-up too, highlighting positive market sentiment. Initial firm support is seen at 1.0938, the 20-day EMA.
GBPUSD TECHS: Resumes Its Uptrend
- RES 4: 1.3045 High Jul 19
- RES 3: 1.2996 High Jul 27
- RES 2: 1.2881 76.4% retracement of the Jul 14 - Oct 4 bear leg
- RES 1: 1.2827 Intraday high
- PRICE: 1.2800 @ 10:16 GMT Dec 28
- SUP 1: 1.2652 20-day EMA
- SUP 2: 1.2612 Low Dec 21 and a key short-term support
- SUP 3: 1.2543 50-day EMA
- SUP 4: 1.2500 Low Dec 13
The trend outlook in GBPUSD remains bullish. The pair has breached resistance at 1.2794, the Dec 14 high and traded through 1.2800. This confirms a resumption of the uptrend and paves the way for a climb towards 1.2881, a Fibonacci retracement. Moving average studies are in a bull-mode position, highlighting an uptrend. On the downside, initial firm support has been defined at 1.2612, the Dec 21 low.
EURGBP TECHS: Bullish Conditions Remain Intact
- RES 4: 0.8814 High May 4
- RES 3: 0.8768 High Nov 20 and key resistance
- RES 2: 0.8716 76.4% retracement of the Nov 20 - Dec 11 sell-off
- RES 1: 0.8699 High Dec 27
- PRICE: 0.8675 @ 06:33 GMT Dec 28
- SUP 1: 0.8646/18 20-day EMA / Low Dec 20
- SUP 2: 0.8571 Low Dec 15
- SUP 3: 0.8549 Low Dec 11 and the bear trigger
- SUP 4: 0.8524 Low Sep 5
EURGBP maintains a bullish tone and the cross is holding on to the bulk of its recent gains. The 50-day EMA has been cleared highlighting a stronger short-term reversal and this signals potential for a continuation of the bull cycle. Sights are on 0.8716 next, a Fibonacci retracement point. On the downside, key support is unchanged at 0.8549, the Dec 11 low. Initial support lies at 0.8618, the Dec 20 low.
USDJPY TECHS: Clears Support
- RES 4: 147.32 High Dec 7
- RES 3: 146.59 High Dec 11 and key short-term resistance
- RES 2: 144.96 High Dec 19
- RES 1: 144.15 20-day EMA
- PRICE: 140.70 @ 10:13 GMT Dec 28
- SUP 1: 140.65 Intraday low
- SUP 2: 140.23 2.00 proj of the Nov 13 - 21 - 22 price swing
- SUP 3: 139.11 2.236 proj of the Nov 13 - 21 - 22 price swing
- SUP 4: 138.07 Low Jul 28
USDJPY is trading lower today and the pair remains below 144.96, the Dec 9 high. The recent recovery from 140.97, the Dec 14 low, has been a correction and the trend condition remains bearish. Support at 140.97, the Dec 14 low, has been cleared, confirming a resumption of the downtrend that started Nov 13. This opens 140.23, a Fibonacci projection point. Initial firm resistance is at 144.15, the 20-day EMA.
EURJPY TECHS: Trend Needle Points South
- RES 4: 161.78 High Dec 1
- RES 3: 159.93 High Dec 4
- RES 2: 158.67 High Dec 12 and key short-term resistance
- RES 1: 158.58 50-day EMA
- PRICE: 156.60 @ 07:26 GMT Dec 28
- SUP 1: 155.39/153.23 Low Dec 19 / 7 and the bear trigger
- SUP 2: 152.24 3.764 proj of the Nov 16 - 21 - 27 price swing
- SUP 3: 151.42 Low Jul 28 and a key support
- SUP 4: 150.92 Low Jun 14
A bearish theme in EURJPY remains intact. The cross remains below key short-term resistance at 158.67, the Dec 12 high. Clearance of this level would signal a short-term reversal. While 158.67 remains intact, recent gains appear to be a correction. A continuation lower and a break of 153.23, the Dec 7 low and bear trigger, would resume the downtrend. This would open 152.24, a Fibonacci projection.
AUDUSD TECHS: Approaching Key Resistance
- RES 4: 0.6961 1.236 proj of the Nov 10 - Dec 4 - Dec 7 price swing
- RES 3: 0.6921 High Feb 20
- RES 2: 0.6900 High Jun 16 and a key resistance
- RES 1: 0.6871 Intraday high
- PRICE: 0.6849 @ 07:53 GMT Dec 28
- SUP 1: 0.6773 Low Dec 22
- SUP 2: 0.6702 20-day EMA
- SUP 3: 0.6596 50-day EMA
- SUP 4: 0.6526 Low Dec 7 and key support
Bullish trend conditions in AUDUSD remain intact and this week’s continuation higher reinforces current conditions. The move higher maintains the bullish price sequence of higher highs and higher lows. Sights are on 0.6900, the Jun 16 and the next key key resistance. On the downside, key short-term support is unchanged at 0.6526, the Dec 7 low. Initial firm support is at 0.6702, the 20-day EMA.
USDCAD TECHS: Bears Remain In The Driver’s Seat
- RES 4: 1.3538 High Dec 26
- RES 3: 1.3408 20-day EMA
- RES 2: 1.3374 High Dec 20 / 21
- RES 1: 1.3295 High Dec 25
- PRICE: 1.3192 @ 07:58 GMT Dec 28
- SUP 1: 1.3177 Low Dec 27
- SUP 2: 1.3093 Low Jul 14 and key support
- SUP 3: 1.3044 2.0% 10-dma envelope
- SUP 4: 1.2992 50.0% retracement of the 2021 - 2022 bull phase
The USDCAD trend outlook remains bearish and price traded lower yesterday. The pair has recently cleared a bear trigger at 1.3480, the Dec 4 low. Furthermore, all key short-term retracement points have been breached. These developments reinforce a bearish theme and maintain the price sequence of lower lows and lower highs. Sights are on 1.3093, the Jul 14 low and a key support. Resistance to watch is 1.3408, the 20-day EMA.
FIXED INCOME
BUND TECHS: (H4) Bull Trend Extends
- RES 4: 140.30 High Mar 20 (cont)
- RES 3: 140.00 Psychological round number
- RES 2: 139.39 3.764 proj of the Nov of the 13 - 17 - 24 price swing
- RES 1: 138.84 High Dec 27
- PRICE: 138.64 @ 05:45 GMT Dec 28
- SUP 1: 137.33 Low Dec 20
- SUP 2: 135.75 20-day EMA
- SUP 3: 134.37 Low Dec 8 and a key support
- SUP 4: 133.42 Low Dec 4
The uptrend in Bund futures is intact and the contract traded higher once again yesterday, confirming a resumption of the trend and an extension of the recent break of resistance at 135.81, the Dec 7 high. The extension maintains the price sequence of higher highs and higher lows. Sights are on 139.39, a Fibonacci projection. Firm short-term support is seen at 135.75, the 20-day EMA.
BOBL TECHS: (H4) Fresh Trend High
- RES 4: 120.460 1.00 proj of the Nov 24 - Dec 7 - 8 price swing
- RES 3: 120.130 High Mar 24 (cont)
- RES 2: 120.000 Psychological round number
- RES 1: 119.832 0.764 proj of the Nov 24 - Dec 7 - 8 price swing
- PRICE: 119.720 @ 05:53 GMT Dec 28
- SUP 1: 119.040 Low Dec 20
- SUP 2: 118.399 20-day EMA
- SUP 3: 117.800 Low Dec 8 and a key support
- SUP 4: 117.510 Low Dec 4
A bull cycle in Bobl futures remains in play and the contract traded higher yesterday. The continued appreciation confirms, once again, a resumption of the uptrend and maintains the bullish price sequence of higher highs and higher lows. The focus is on 119.832, a Fibonacci projection point. On the downside, key short-term support is unchanged at 117.800, the Dec 8 low. A short-term pullback would be considered corrective.
SCHATZ TECHS: (H4) Bull Cycle Remains In Play
- RES 4: 106.774 1.618 proj of the Nov 24 - 30 minor price swing
- RES 3: 106.698 1.50 proj of the Nov 24 - 30 minor price swing
- RES 2: 106.621 1.382 proj of the Nov 24 - 30 minor price swing
- RES 1: 106.590 High Dec 27
- PRICE: 106.550 @ 05:58 GMT Dec 28
- SUP 1: 106.355/181 Low Dec 20 / 20-day EMA
- SUP 2: 106.160 Low Dec 15
- SUP 3: 105.955 Low Dec 13 and key short-term support
- SUP 4: 105.780 Low Dec 1
Trend conditions in Schatz futures remain bullish and this week’s gains reinforce current conditions. The contract has cleared 106.495, the Dec 14 high. This confirmed a resumption of the uptrend and maintains the positive price sequence of higher highs and higher lows. Sights are on 106.621, a Fibonacci projection. Key short-term support has been defined at 105.955, Dec 13 low. A pullback would be considered corrective.
GILT TECHS: (H4) Continues Its Ascent
- RES 4: 104.57 2.50 proj of the Nov 30 - Dec 6 - Dec 11 price swing
- RES 3: 104.23 2.382 proj of the Nov 30 - Dec 6 - Dec 11 price swing
- RES 2: 104.16 High Apr 12 (cont)
- RES 1: 104.00 Psychological round number
- PRICE: 103.77 @ Close Dec 27
- SUP 1: 102.05/100.93 High Dec 19 / Low Dec 18
- SUP 2: 100.50 20-day EMA
- SUP 3: 100.20 High Dec 13 and gap high
- SUP 4: 98.97 High Dec 6 and a recent breakout level
The current uptrend in Gilt futures remains intact. The contract traded to a fresh trend high yesterday, reinforcing bullish conditions. This confirms once again, a resumption of the underlying uptrend and maintains a bullish price sequence of higher highs and higher lows. The focus is on 104.00 next. Initial firm support lies at 100.20, the Dec 13 high. Short-term weakness would be considered corrective.
BTP TECHS: (H4) Bull Cycle Still In Play
- RES 4: 123.00 Round number resistance
- RES 3: 122.63 High Dec 7 2022 (cont)
- RES 2: 122.18 3.00 proj of the Nov 10 - 17 - 24 price swing
- RES 1: 121.43 2.764 proj of the Nov 10 - 17 - 24 price swing
- PRICE: 121.13 @ Close Dec 27
- SUP 1: 119.01/117.69 Low Dec 19 / 20-day EMA
- SUP 2: 115.70 Low Dec 8 and key short-term support
- SUP 3: 114.13 Low Nov 30
- SUP 4: 112.70 Low Nov 24
A bull cycle in BTP futures remains in play and the contract has traded higher this week. This reinforces bullish conditions and confirms a resumption of the uptrend. The contract has recently cleared resistance at 117.22, Dec 7 high and a bull trigger. The breach maintains the positive price sequence of higher highs and higher lows. Sights are on 122.18, a Fibonacci projection. On the downside, key short-term support has been defined at 115.70, the Dec 8 low.
US 10YR FUTURE TECHS: (H4) Trend Structure Remains Bullish
- RES 4: 114-06 2.00 proj of the Oct 19 - Nov 3 - Nov 13 price swing
- RES 3: 114-00 Round number resistance
- RES 2: 113-12+ 1.764 proj of the Oct 19 - Nov 3 - Nov 13 price swing
- RES 1: 113-04+ High Dec 21
- PRICE: 113-00+ @ 15:45 GMT Dec 27
- SUP 1: 111-31+/111-14 Low Dec 14 / 20-day EMA
- SUP 2: 111-09+ High Dec 7
- SUP 3: 109-31+Low Dec 11 and key short-term support
- SUP 4: 110-08 50-day EMA
Treasuries maintain a firmer tone and the contract is trading just below its latest highs. Recently, resistance at 111-09+, the Dec 7 high, was cleared. This confirmed a resumption of the uptrend and an extension of the price sequence of higher highs and higher lows. Sights are on 113-12+, a Fibonacci projection point. Key short-term support is at 109-31+, the Dec 11 low. Initial firm support is at 111-09+, the Dec 7 high.
EQUITIES
EUROSTOXX50 TECHS: (H4) Trend Needle Points North
- RES 4: 4697.50 1.382 projection of the Nov 8 - 24 - 28 price swing
- RES 3: 4662.90 1.236 projection of the Nov 8 - 24 - 28 price swing
- RES 2: 4636.70 76.4% retracement of the 2000 - 2009 downleg (cont)
- RES 1: 4634.00 High Dec 14 and the bull trigger
- PRICE: 4582.00 @ 06:22 GMT Dec 28
- SUP 1: 4530.00 Low Dec 20
- SUP 2: 4518.40 20-day EMA
- SUP 3: 4447.00 Low Dec 5
- SUP 4: 4370.00 Low Nov 28
A bullish theme in Eurostoxx 50 futures remains intact and recent weakness appears to be a correction. Moving average studies are in a bull-mode position, signalling a rising trend cycle. Furthermore, recent gains confirmed, once again, a resumption of the uptrend and this has maintained the bullish price sequence of higher highs and higher lows. The focus is on 4636.70, a L/T Fibonacci retracement. Support to watch is 4518.40, the 20-day EMA.
E-MINI S&P TECHS: (H4) Fresh Trend High
- RES 4: 4915.11 1.236 proj of Nov 10 - Dec 1 - 7 price swing
- RES 3: 4900.00 Round number resistance
- RES 2: 4854.75 1.00 proj of Nov 10 - Dec 1 - 7 price swing
- RES 1: 4841.50 Intraday high
- PRICE: 4840.00 @ 07:20 GMT Dec 28
- SUP 1: 4743.25 Low Dec 20
- SUP 2: 4726.28 20-day EMA
- SUP 3: 4617.58 50-day EMA
- SUP 4: 4594.00 Low Nov 30
A bullish theme in S&P e-minis remains intact and this week’s fresh trend highs reinforce current conditions. The move higher confirms once again a resumption of the uptrend that started Oct 27. The contract has also recently cleared resistance at 4738.50, the Jul 27 high, reinforcing current positive trend conditions. Sights are on 4854.75 next, a Fibonacci projection. On the downside, initial firm support lies at 4726.28, the 20-day EMA.
COMMODITIES
BRENT TECHS: (H4)Trades Through The 50-Day EMA
- RES 4: $86.50 - High Nov 3
- RES 3: $85.00 - Round number resistance
- RES 2: $84.22 - High Nov 30 and key short-term resistance
- RES 1: $81.45 - High Dec 26
- PRICE: $79.72 @ 07:01 GMT Dec 28
- SUP 1: $76.00 - Low Dec 18
- SUP 2: $72.67/71.21 - Low Dec 13 and the bear trigger / Low Jun 23
- SUP 3: $69.25 - Low Mar 20 and a key support
- SUP 4: $67.84 - 1.236 proj of the Oct 20 - Nov 16 - 30 price swing
Brent futures traded higher Tuesday, starting the week on a bullish note. The latest recovery is considered corrective, however, price has traded through both the 20- and 50-day EMAs. The breach of the 50-day average, signals scope for a continuation higher. This would open $84.22, the Nov 30 high and the next key resistance. On the downside, a strong reversal lower would refocus attention on $72.67, the Dec 13 low.
WTI TECHS: (G4) Watching Resistance At The 50-Day EMA
- RES 4: $84.18 - High Oct 24
- RES 3: $82.64 - High Nov 3
- RES 2: $79.67 - High Nov 30 and a key short-term resistance
- RES 1: $75.80/76.18 - 50-day EMA / High Dec 26
- PRICE: $74.18 @ 07:09 GMT Dec 28
- SUP 1: $70.99 - Low Dec 18
- SUP 2: $67.98/07 - Low Dec 13 and the bear trigger / Low Jun 23
- SUP 3: $65.24 - Low May 4 and a key support
- SUP 4: $63.79 - 2.236 proj of the Sep 28 - Oct 6 - Oct 20 price swing
Bearish conditions in WTI futures remain intact and recent gains still appear to be a correction. Resistance to watch is $75.80, the 50-day EMA. The average was pierced on Monday. A clear break of it would strengthen a bullish theme and highlight a stronger reversal. For bears, moving average studies are in a bear-mode position, highlighting a downtrend. The trigger for a resumption of the downtrend lies at $67.98, the Dec 13 low.
GOLD TECHS: Bullish Outlook
- RES 4: $2177.6 - 1.236 proj of the Oct 6 - 27 - Nov 13 price swing
- RES 3: $2135.4 - High Dec 4 and all-time high
- RES 2: $2097.1 - 76.4% retracement of the Dec 4 - 13 bear leg
- RES 1: $2088.5 - Intraday high
- PRICE: $2087.0 @ 07:16 GMT Dec 28
- SUP 1: $2031.3 - 20-day EMA
- SUP 2: $1973.2 - Low Dec 13
- SUP 3: $1931.7 - Low Nov 13 and key support
- SUP 4: $1908.3 - Low Oct 16
The Dec 13 reversal in Gold and the subsequent move higher points to the end of the Dec 4 - 13 corrective pullback. This week’s move highlights a bullish theme and note that moving average studies are in a bull-mode position too, reflecting an uptrend. A continuation higher has opened $2097.1, 76.4% of the Dec 4 - 13 bear leg, ahead of key resistance and the Dec 4 all-time high of $2135.4. Key support lies at $1973.2, the Dec 13 low.
SILVER TECHS: Bullish Engulfing Candle Remains In Play
- RES 4: $26.222 - High Apr 18 2022
- RES 3: $26.135 - High May 5 and a key resistance
- RES 2: $25.761 - High Dec 4 and key resistance
- RES 1: $24.606/994 - High Dec 22 / 76.4% of Dec 4 - 13 bear leg
- PRICE: $24.450 @ 08:01 GMT Dec 28
- SUP 1: $22.510 - Low Dec 13 and key short-term support
- SUP 2: $21.883 - Low Nov 13 and a key support
- SUP 3: $20.689 - Low Oct 3 and the bear trigger
- SUP 4: $19.904 - Low Mar 10 and a key support
Silver rallied on Dec 13, highlighting a reversal and last week’s push higher reinforces a developing bullish theme. The Dec 13 price pattern appears to be a bullish engulfing candle. If correct, the pattern signals potential for a continuation of the upleg. Sights are on $24.994, a Fibonacci retracement. Key resistance is at $25.761, the Dec 4 high. Key support lies at $22.510, the Dec 13 low.
Why MNI
MNI is the leading provider
of intelligence and analysis on the Global Fixed Income, Foreign Exchange and Energy markets. We use an innovative combination of real-time analysis, deep fundamental research and journalism to provide unique and actionable insights for traders and investors. Our "All signal, no noise" approach drives an intelligence service that is succinct and timely, which is highly regarded by our time constrained client base.Our Head Office is in London with offices in Chicago, Washington and Beijing, as well as an on the ground presence in other major financial centres across the world.