
Why MNI
MNI is the leading provider
of intelligence and analysis on the Global Fixed Income, Foreign Exchange and Energy markets. We use an innovative combination of real-time analysis, deep fundamental research and journalism to provide unique and actionable insights for traders and investors. Our "All signal, no noise" approach drives an intelligence service that is succinct and timely, which is highly regarded by our time constrained client base.Our Head Office is in London with offices in Chicago, Washington and Beijing, as well as an on the ground presence in other major financial centres across the world.
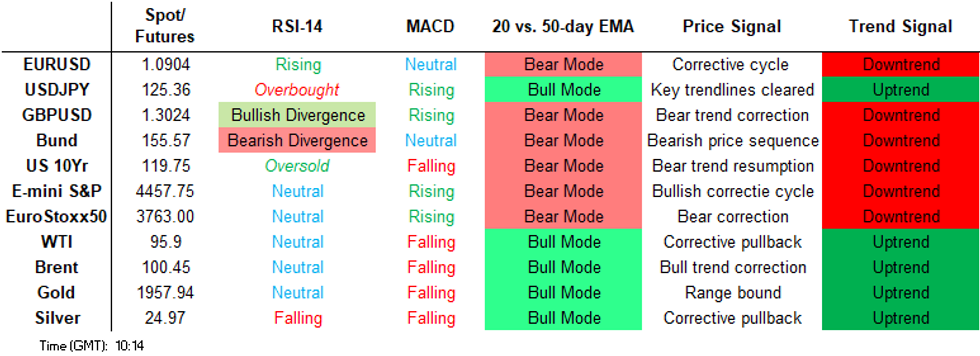
Price Signal Summary - USDJPY Climbs Delivers A Fresh Cycle High
- In the equity space, S&P E-Minis traded lower last week. The contract is testing a key area of support at the 50-day EMA. This average intersects at 4456.43 and marks a key pivot level. A clear break would strengthen a bearish case and allow for a deeper pullback that would open 4425.96 initially, 38.2% retracement of the Feb 24 - Mar 29 rally. Resistance is at 4588.75, the Apr 5 high. EUROSTOXX 50 futures also traded lower last week. Price has moved below the 20- and 50-day EMAs and probed support at 3735.00, the Mar 18 low. The move lower undermines the recent bull theme and highlights a developing bearish threat. An extension lower would open 3626.50, 50.0% of the Ma r 7 - 29 rally. Key short-term resistance has been defined at 3944.00, the Mar 29 high.
- In FX, EURUSD remains vulnerable The recent failure at 1.1185, Mar 31 high, highlights a bearish threat. Attention is on 1.0806, the Mar 7 low and a bear trigger. the GBPUSD outlook remains bearish and the pair has probed the key support at 1.3000, Mar 15 low and the near-term bear trigger. The focus is on 1.2954, 1.764 projection of the Jan 13 - 27 - Feb 10 price swing. Resistance is at 1.3136, the 20-day EMA. USDJPY has started the week on a firmer note and has breached 125.09, the Mar 28 high. The break confirms the end of the recent corrective cycle and more importantly, marks a resumption of the primary uptrend. This paves the way for strength towards 125.86 next, the Jun 5 2015 high and a major resistance.
- On the commodity front, Gold is firmer today but remains inside its range. The yellow metal recently found support at $1890.2, on Mar 29, and this level still represents the short-term bear trigger. Initial resistance is at $1966.1, Mar 24 high. In the Oil space, WTI futures traded lower last week, resulting in a breach of the 50-day EMA. The print below this average suggests scope for a continuation lower. the focus is on the next key support at $92.20, Mar 15 low. Initial firm resistance has been defined at $105.59, the Apr 5 high.
- In the FI space, Bund futures have traded to a fresh cycle low today, confirming a resumption of the primary downtrend. The next objective is 155.03, the Dec 4 2015 low (cont). Gilts continue to trade lower and recent weakness has confirmed a resumption of the primary downtrend. The focus is on 118.93, the Apr 26 2016 low (cont). Treasuries are weaker too as the downtrend extends. This has opened 119-04+ next, the Dec 3 2018 low (cont).
FOREIGN EXCHANGE
EURUSD TECHS: Eyeing The Bear Trigger
- RES 4: 1.1222 61.8% of Feb 10 - Mar 7 sell-off
- RES 3: 1.1185/1220 High Mar 31 / 3.0% Upper Bollinger Band
- RES 2: 1.1099 50-day EMA
- RES 1: 1.0996 20-day EMA
- PRICE: 1.0884 @ 06:12 BST Apr 11
- SUP 1: 1.0837 Low Mar 8
- SUP 2: 1.0806 Low Mar 7 and the bear trigger
- SUP 3: 1.0767 Low May 7 2020
- SUP 4: 1.0727 Low Apr 24, 2020
EURUSD traded lower Friday and, despite today’s initial gains, the outlook remains bearish. Sights are on the key support at 1.0806, Mar 7 low and the bear trigger. The recent failure at 1.1185, Mar 31 high highlights a bearish threat and last week’s move lower has reinforced this theme. A break of 1.0806 would confirm a resumption of the downtrend and open 1.0767, the May 7 2020 low. Clearance of 1.1185 is needed to reinstate a bull theme.
GBPUSD TECHS: Probes 1.3000
- RES 4: 1.3439 High Feb 25
- RES 3: 1.3398 61.8% retracement of the Feb 10 - Mar 15 downleg
- RES 2: 1.3252/98 50-day EMA / High Mar 23
- RES 1: 1.3136/83 20-day EMA / High Mar 30
- PRICE: 1.3015 @ 06:19 BST Apr 11
- SUP 1: 1.2983 Low Apr 8
- SUP 2: 1.2954 1.764 proj of the Jan 13 - 27 - Feb 10 price swing
- SUP 3: 1.2933 Low Nov 5 2020
- SUP 4: 1.2855 Low Nov 2 2020 and a key support
GBPUSD traded lower Friday, resulting in a print below key support at 1.3000, the Mar 15 low and a bear trigger. The move lower confirms a resumption of the primary downtrend and an extension of the recent pullback from 1.3298, the Mar 23 high. A continuation lower would open 1.2954, a Fibonacci projection level. Initial resistance is at 1.3136, the 20-day EMA ahead of the key 50-day EMA level at 1.3252.
EURGBP TECHS: Bearish Threat Present Despite A Firmer Open
- RES 4: 0.8624 High Oct 1 2021
- RES 3: 0.8600 High Dec 8 2022
- RES 2: 0.8512/59 High Mar 31 / 2.0% 10-dma envelope
- RES 1: 0.8405/8435 Intraday high / High Apr 4
- PRICE: 0.8364 @ 06:26 BST Apr 11
- SUP 1: 0.8296 Low Mar 23 and a key support
- SUP 2: 0.8276 76.4% retracement of the Mar 7 - 31 rally
- SUP 3: 0.8203 Low Mar 7 and the bear trigger
- SUP 4: 0.8117 High Apr 7 2016
EURGBP remains vulnerable despite today’s firmer opening price. This follows last week’s move lower that marked an extension of the reversal from the 0.8512 high on Mar 31. This signals scope for a continuation of the bear leg, with the focus on 0.8296, the Mar 23 low. A break of this support would open 0.8276, a Fibonacci retracement. On the upside, initial resistance is seen at 0.8405, today’s high ahead of 0.8435, the Apr 4 high.
USDJPY TECHS: Clears Resistance At 125.09
- RES 4: 128.15 High May 17 2002
- RES 3: 126.71 3.50 proj of the Dec 3 ‘21 - Jan 4 -24 price swing
- RES 2: 126.26 3.382 proj of the Dec 3 ‘21 - Jan 4 -24 price swing
- RES 1: 125.86 High Jun 5 2015 and a major resistance
- PRICE: 125.34 @ 08:05 BST Apr 11
- SUP 1: 123.47 Low Apr 6 and 7
- SUP 2: 122.38 Low Apr 5
- SUP 3: 121.28 Low Mar 31 and a bear trigger
- SUP 4: 120.00 Round number support
USDJPY has started the week on a firmer note and has breached key near term resistance 125.09, the Mar 28 high. The break higher confirms the end of the recent corrective cycle and more importantly, confirms a resumption of the primary uptrend. This paves the way for strength towards 125.86 next, the Jun 5 2015 high and a major resistance. On the downside, key trend support has been defined at 121.28, the Mar 31 low.
EURJPY TECHS: Corrective Cycle Still In Play
- RES 4: 139.00 High Aug 21 2015 and a key resistance
- RES 3: 138.62 High Aug 25 2015
- RES 2: 137.50/53 High Feb 2 ‘18 and major resistance / High Mar 28
- RES 1: 136.84 High Mar 31
- PRICE: 136.05 @ 06:42 BST Apr 11
- SUP 1: 134.30/33.94 Low Apr 5 / Low Mar 28
- SUP 2: 133.86 20-day EMA
- SUP 3: 131.88 50-day EMA
- SUP 4: 130.72 Low Mar 17
The recent EURJPY pullback from 137.53, Mar 28 high is still considered corrective and the move lower has allowed an overbought condition to unwind. Support to watch is 133.94, the Mar 28 low, where a break would open the 20-day EMA at 133.63. The primary trend remains up and the bull trigger is 137.50/53. Clearance of this hurdle would expose 138.62, the Aug 25, 2015 high.
AUDUSD TECHS: Shooting Star Reversal Still In Play
- RES 4: 0.7762 76.4% retracement of the Feb ‘21 - Jan ‘22 downleg
- RES 3: 0.7716 High Jun 16 2021
- RES 2: 0.7656/61 2.0% 10-dma envelope / High Apr 5
- RES 1: 0.7519 High Apr 7
- PRICE: 0.7447 @ 06:57 BST Apr 11
- SUP 1: 0.7418 Intraday low
- SUP 2: 0.7376 Low Mar 22
- SUP 3: 0.7355 50-day EMA
- SUP 4: 0.7283 Low Mar 17
AUDUSD has traded lower today. The pair recently found resistance at 0.7661, Apr 5 high. The reversal lower highlights a S/T bearish threat and suggests potential for a continued correction. Note that price activity on Apr 5 confirmed a bearish candle - a shooting star - and the subsequent move lower reinforces this pattern. The 20-day EMA at 0.7451, has been probed. This opens the 50-day EMA at 0.7355. Key resistance is at 0.7661.
USDCAD TECHS: Corrective Cycle Likely To Extend
- RES 4: 1.2711 76.4% retracement of the Mar 8 - Apr 5 bear leg
- RES 3: 1.2699 High Mar 17
- RES 2: 1.2631 50-day EMA
- RES 1: 1.2619/21 High Apr 8 / 200 DMA
- PRICE: 1.2593 @ 07:01 BST Apr 11
- SUP 1: 1.2479 Low Apr 6
- SUP 2: 1.2403/2386 Low Apr 5 / 1.0% 10-dma envelope
- SUP 3: 1.2387 Low Nov 10 2021
- SUP 4: 1.2328 Low Oct 29 2021
USDCAD recovered last week from its recent lows and maintains a firmer tone. Price action on Apr 5, in Japanese candlestick terms, is a long-legged doji. This is a short-term reversal signal and suggests scope for an extension of the current correction. Attention is on the 50-day EMA, at 1.2628 - a key resistance. The broader trend remains down though and a reversal lower would open key support and the bear trigger at 1.2403, Apr 5 low.
FIXED INCOME
BUND TECHS: (M2) Fresh Cycle Low
- RES 4: 161.81 High Mar 16
- RES 3: 160.31 High Mar 23
- RES 2: 159.79 High Apr 4 and key short-term resistance
- RES 1: 157.87/59.13 High Apr 7 / 20-day EMA
- PRICE: 155.72 @ 05:10 BST Apr 11
- SUP 1: 155.44 Intraday low
- SUP 2: 155.03 Low Dec 4 2015 (cont)
- SUP 3: 154.97 0.382 proj of the Mar 7 - 29 - Apr 4 price swing
- SUP 4: 153.48 0.50 proj of the Mar 7 - 29 - Apr 4 price swing
Bunds have started the week on a softer note and have traded to a fresh cycle low. The primary trend remains down. Moving average studies are in a bear mode and a broader bearish price sequence of lower lows and lower highs, that has unfolded since Aug / Sep 2019, remains intact. 156.00 has been cleared and this opens 155.03 next, the Dec 4 2015 low (cont). Firm resistance is at 159.79, the Apr 4 high.
BOBL TECHS: (M2) Heading South
- RES 4: 130.622 50-day EMA
- RES 3: 130.160 High Mar 23
- RES 2: 129.350 High Apr 4
- RES 1: 129.333 20-day EMA
- PRICE: 127.590 @ 05:15 BST Apr 11
- SUP 1: 127.470 Intraday low
- SUP 2: 127.280 Low Sep 18 2014 (cont)
- SUP 3: 126.940 0.382 proj of the Mar 7 - 29 - Apr 4 price swing
- SUP 4: 126.196 0.50 proj of the Mar 7 - 29 - Apr 4 price swing
Bobl futures have traded to a fresh cycle low today confirming a resumption of the primary downtrend. The move lower maintains the broader bearish price sequence of lower lows and lower highs and note that moving averages are also pointing south. The focus is on a move towards 127.280 next, the Sep 18 2014 low (cont). Key short-term resistance has been defined at 129.350, the Apr 4 high.
SCHATZ TECHS: (M2) Bearish Extension
- RES 4: 111.355 High Mar 21
- RES 3: 111.170 High Mar 23
- RES 2: 110.908 20-day EMA
- RES 1: 110.690/855 High Apr 8 / High Apr 4 and key resistance
- PRICE: 110.380 @ 07:28 BST Apr 11
- SUP 1: 110.325 Intraday low
- SUP 2: 110.188 0.382 proj of the Mar 7 - 30 - Apr 4 price swing
- SUP 3: 110.000 Round number support
- SUP 4: 109.983 0.50 proj of the Mar 7 - 30 - Apr 4 price swing
Schatz futures are weaker today and have traded to a fresh cycle low, breaking support at 110.465, the Mar 30 low. This confirms a resumption of the primary downtrend and an extension of the broader bearish price sequence of lower lows and lower highs. The move lower paves the way for weakness towards 110.188 next, a Fibonacci projection. On the upside, key short-term resistance has been defined at 110.855, the Apr 4 high.
GILT TECHS: (M2) Downtrend Remains Intact
- RES 4: 124.60 High Mar 8
- RES 3: 123.52 High Mar 9
- RES 2: 122.72 High Mar 18 and a key near-term resistance
- RES 1: 121.20/122.35 20-day EMA / High Apr 4
- PRICE: 119.38 @ 09:38 BST Apr 11
- SUP 1: 119.36 Low Oct 10 2018 (cont)
- SUP 2: 118.93 Low Apr 26 2016 (cont)
- SUP 3: 118.05 0.618 proj of the Mar 1 - 28 - Apr 4 price swing
- SUP 4: 117.04 0.764 proj of the Mar 1 - 28 - Apr 4 price swing
Gilt futures found resistance last week at 122.35, the Apr 4 high. The pullback means price failed to remain above the 20-day EMA, and that an important resistance at 122.72, the Mar 18 high, also remains intact. The broader trend direction is down and this was confirmed on Friday as prices traded to a fresh trend low of 119.55. The move confirms a resumption of the downtrend and opens 119.36/118.93 next. Clearance of 122.35 is required to signal a base.
BTP TECHS: (M2) Moving Averages Remain In A Bear Mode
- RES 4: 142.51 Low Mar 1
- RES 3: 140.71 High Mar 11
- RES 2: 139.23 High Mar 23
- RES 1: 137.75/38.68 20-day EMA / High Mar 31 and key resistance
- PRICE: 134.29 @ 09:32 BST Apr 11
- SUP 1: 133.85 Intraday low
- SUP 2: 133.15 0.50 proj of the Mar 1 - 29 - 31 price swing
- SUP 3: 132.61 Low Apr 22 2020 (cont)
- SUP 4: 131.85 0.618 proj of the Mar 1 - 29 - 31 price swing
BTP futures traded lower again Friday to extend last week’s breach of support at 135.69, the Mar 29 low. The move lower, confirms a resumption of the primary downtrend and highlights a continuation of the broader bearish price sequence of lower lows and lower highs. Moving averages are in a bear mode too. The focus is on 133.15 next, a Fibonacci projection. Firm resistance is seen at 138.68, the Mar 31 high, where a break is required to signal a short-term reversal.
EQUITIES
EUROSTOXX50 TECHS: (M2) Bearish Threat Still Present
- RES 4: 4132.00 High Feb 10
- RES 3: 4072.00 High Feb 16
- RES 2: 3944.00/3965.50 High Mar 29 / High Feb 23
- RES 1: 3888.00 High Apr 5
- PRICE: 3745.00 @ 05:34 BST Apr 11
- SUP 1: 3701.40 38.2% retracement of the Mar 7 - 29 rally
- SUP 2: 3626.50 50.0% retracement of the Mar 7 - 29 rally
- SUP 3: 3551.60 61.8% retracement of the Mar 7 - 29 rally
- SUP 4: 3523.00 Low Mar 11
EUROSTOXX 50 futures traded lower last week and in the process, price has moved below the 20- and 50-day EMAs and breached support at 3735.00, the Mar 18 low. The move lower undermines the recent bull theme and highlights a developing bearish threat. An extension would open 3626.50, a Fibonacci retracement. On the upside, key short-term resistance has been defined at 3944.00, the Mar 29 high.
E-MINI S&P (M2): 50-Day EMA Remains Exposed
- RES 4: 4730.50 High Jan 1
- RES 3: 4663.50 High Jan 18
- RES 2: 4633.44 76.4% retracement of the Jan 4 - Feb 24 downleg
- RES 1: 4588.75 High Apr 5
- PRICE: 4456.75 @ 06:55 BST Apr 11
- SUP 1: 4456.43/4444.50 50-day EMA / Low Apr 6/7
- SUP 2: 4425.96 38.2% retracement of the Feb 24 - Mar 29 rally
- SUP 3: 4400.00 Round number support
- SUP 4: 4362.63 50.0% retracement of the Feb 24 - Mar 29 rally
S&P E-Minis are trading closer to last week’s lows. The contract has tested its key support area at the 50-day EMA, which intersects at 4456.43 today. This EMA marks a key pivot level and has so far provided support. A clear break would strengthen a bearish case and allow for a deeper pullback towards 4425.96 initially, a Fibonacci retracement. For bulls, a recovery and an ability to remain above the 50-day EMA would be a bullish development.
COMMODITIES
BRENT TECHS: (M2) Testing The 50-Day EMA
- RES 4: $128.04 - High Mar 8
- RES 3: $125.40 - 76.4% retracement of the Mar 7 - 16 downleg
- RES 2: $112.28/119.74 - High Mar 30 / High Mar 24 and a bull trigger
- RES 1: $109.90 - High Apr 5
- PRICE: $100.98 @ 06:58 BST Apr 11
- SUP 1: $98.41 Low Apr 7
- SUP 2: $94.61 - Low Mar 16 and a key support
- SUP 3: $90.58 - Low Feb 25
- SUP 4: $84.74 - Low Feb 18
Brent futures remain vulnerable and the contract is trading closer to its recent lows. Price has breached $102.19, Mar 29 low is challenging a key support at the 50-day EMA, that intersects at $100.68 today. A clear break of this average would suggest scope for a deeper decline and pave the way for a move towards $94.61, the Mar 16 low. $119.74 remains the key short-term resistance.
WTI TECHS: (K2) Outlook Remains Bearish
- RES 4: $122.73 - High Mar 9
- RES 3: $116.64/118.34 - High Mar 24 / 76.4% of Mar 7 - 15 downleg
- RES 2: $108.75/112.93 -High Mar 30 / High Mar 28
- RES 1: $105.59 - High Apr 5
- PRICE: $96.44 @ 07:07 BST Apr 11
- SUP 1: $93.81 - Low Apr 6
- SUP 2: $92.20 - Low Mar 15 and a bear trigger
- SUP 3: $88.49 - Low Feb 25
- SUP 4: $85.81 - Low Feb 18
WTI futures have traded lower last week and this resulted in a breach of the 50-day EMA. The move lower marks an extension of the current bearish cycle and the print below the 50-day EMA suggests scope for a continuation lower near-term. The focus is on the next key support at $92.20, the Mar 15 low and an important bear trigger. Initial firm resistance has been defined at $105.59, Apr 5 high where a break would ease current bearish pressure.
GOLD TECHS: Firmer Inside Its Range
- RES 4: $2104.6 - 3.236 proj of the Dec 15 - Jan 25 - 28 price swing
- RES 3: $2075.5 - High Aug 7 2020 and the all-time high
- RES 2: $2009.2/2070.4 - High Mar 10 / High Mar 8
- RES 1: $1966.1 - High Mar 24
- PRICE: $1943.8 @ 07:13 BST Apr 11
- SUP 1: $1890.2 - Low Mar 29 and a bear trigger
- SUP 2: $1878.4 - Low Feb 24
- SUP 3: $1848.8 - 76.4% retracement of the Jan 28 - Mar 8 rally
- SUP 4: $1821.1 - Low Feb 11
Gold is slightly firmer but continues to trade inside its range, and above $1890.2, the Mar 29 low. The outlook is bearish following the recent pullback from $2070.4, the Mar 8 high. This has allowed a recent overbought condition to unwind. Key support at the 50-day EMA - today at $1911.3 - and the Mar 15 low of $1895.3 have recently been probed. A clear break lower would signal scope for a deeper pullback. Initial resistance is $1966.1.
SILVER TECHS: Still Looking For A Move Lower
- RES 4: $27.831 - High Jun 16 2021
- RES 3: $27.245 - High Jun 17 2021
- RES 2: $26.063/943 - High Mar 10 / High Mar 8 and the bull trigger
- RES 1: $25.847 - High Mar 24
- PRICE: $24.749 @ 07:21 BST Apr 11
- SUP 1: $23.974 - Low Mar 29 and the bear trigger
- SUP 2: $23.850 - Low Feb 24
- SUP 3: $23.173 76.4% retracement of the Feb 3 - Mar 8 rally
- SUP 4: $23.082 - Low Feb 15
Silver resistance is unchanged at $25.847, the Mar 24 high. A short-term bearish theme remains intact and potential is seen for a deeper retracement. Price continues to challenge support at the 50-day EMA, at $24.531. This EMA marks an important support and a clear break would signal scope for a deeper pullback. For bulls, a move above $26.00 would alter the picture and refocus attention on $26.943, the Mar 8 high.
Why MNI
MNI is the leading provider
of intelligence and analysis on the Global Fixed Income, Foreign Exchange and Energy markets. We use an innovative combination of real-time analysis, deep fundamental research and journalism to provide unique and actionable insights for traders and investors. Our "All signal, no noise" approach drives an intelligence service that is succinct and timely, which is highly regarded by our time constrained client base.Our Head Office is in London with offices in Chicago, Washington and Beijing, as well as an on the ground presence in other major financial centres across the world.