
Why MNI
MNI is the leading provider
of intelligence and analysis on the Global Fixed Income, Foreign Exchange and Energy markets. We use an innovative combination of real-time analysis, deep fundamental research and journalism to provide unique and actionable insights for traders and investors. Our "All signal, no noise" approach drives an intelligence service that is succinct and timely, which is highly regarded by our time constrained client base.Our Head Office is in London with offices in Chicago, Washington and Beijing, as well as an on the ground presence in other major financial centres across the world.

Price Signal Summary - USDJPY Makes Significant Technical Break
- S&P E-Minis are trading higher, extending the bull cycle that started Mar 15. Bullish conditions have also been reinforced by the recent break of both the 20- and 50-day EMAs. The breach of the latter EMA marks an important short-term bullish development. EUROSTOXX 50 futures continue to trade inside its current range and the recent consolidation still appears to be a bull flag - a continuation pattern that reinforces current bullish conditions.
- EURUSD continues to consolidate. The pair did trade lower Monday and breached support at 1.0961, the Mar 22 low. This reinforces short-term bearish conditions following the recent pullback from 1.1137, Mar 17 high. USDJPY rallied sharply higher Monday, cresting at a new cycle high and the best levels since 2015 at 125.09. This marks a considerable technical break for the pair, and extends the extremely overbought condition (the 14-day RSI hit its highest since 2001 on Monday). AUDUSD is trading below its recent YTD and multi-month highs. From a trend perspective, conditions remain bullish. Last week’s important technical break was the move above 0.7441, Mar 7 high, marking an extension of the strong reversal from 0.7165, Mar 15 low.
- WTI futures remain in an uptrend however yesterday’s move lower does highlight potential for a deeper retracement. The contract has traded below the 20-day EMA, at $104.82. A clear break would strengthen a bearish case and signal scope for a move towards the 50-day EMA at $96.44. Gold traded low Monday. The outlook remains bearish following the recent pullback from the Mar 8 high of $2070.4. The move lower is allowing a recent overbought condition to unwind.
- Bunds remain in a downtrend and the contract is trading near its recent lows. Futures last week, traded through the psychological 160.00 handle. The continuation lower confirmed an extension of the broader bearish price sequence of lower lows and lower highs that has unfolded since Aug / Sep 2019. Trend conditions in Gilt futures remain bearish. Futures traded to a fresh cycle low Monday but did rebound from the session low of 119.86. Gains are considered corrective.
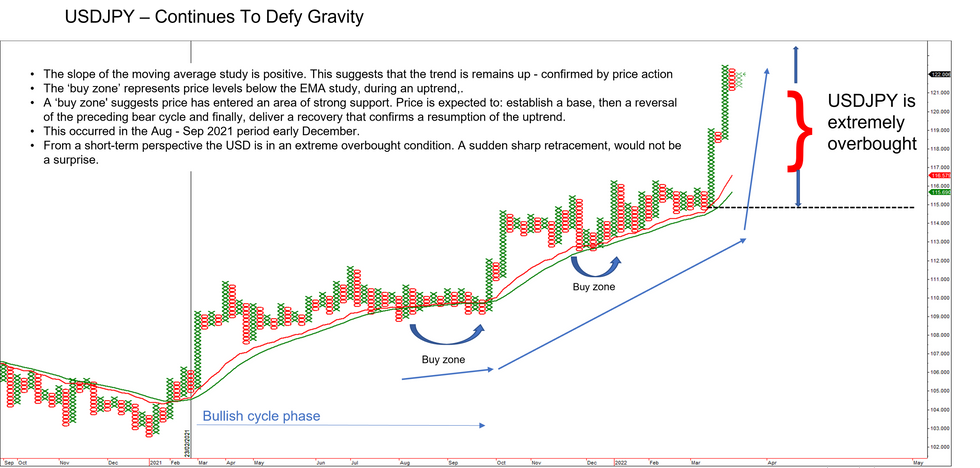
- The uptrend in USDJPY that started January 2021 when the pair reversed from a low of 102.59, remains intact
- Technical signals suggest that the pair is likely to continue to appreciate in Q2 and a clear break of 125.00 and 125.86 would strengthen the bullish condition.
- At current levels, USDJPY is extremely overbought and the most recent portion of the uptrend is very steep. A correction is overdue
- Full piece here: https://marketnews.com/usdjpy-continues-to-defy-gr...
EURUSD TECHS: Bearish Outlook
- RES 4: 1.1232/35 61.8% of Feb 10-Mar 7 sell-off / 2.0% 10-dma env
- RES 3: 1.1152 50-day EMA
- RES 2: 1.1137 High Mar 17 and key near-term resistance
- RES 1: 1.1043 20-day EMA
- PRICE: 1.0987 @ 06:05 GMT Mar 29
- SUP 1: 1.0926 Low Mar 15
- SUP 2: 1.0890/06 Low Mar 9 / Low Mar 7 and the bear trigger
- SUP 3: 1.0767 Low May 7 2020
- SUP 4: 1.0727 Low Apr 24, 2020
EURUSD continues to consolidate. The pair did trade lower Monday and breached support at 1.0961, the Mar 22 low. This reinforces short-term bearish conditions following the recent pullback from 1.1137, Mar 17 high. An extension lower would open 1.0890, the Mar 9 low and 1.0806, the Mar 7 low and bear trigger. Key short-term resistance is at 1.1137. Clearance of this level is required to reinstate a bullish theme.
GBPUSD TECHS: Break Lower Exposes 1.3000
- RES 4: 1.3492 76.4% retracement of the Feb 10 - Mar 15 downleg
- RES 3: 1.3439 High Feb 25
- RES 2: 1.3322 50-day EMA
- RES 1: 1.3225/98 High Mar 25 and 23
- PRICE: 1.3095 @ 06:12 GMT Mar 29
- SUP 1: 1.3068/3000 Low Mar 28 / Low Mar 15 and the bear trigger
- SUP 2: 1.2954 1.764 proj of the Jan 13 - 27 - Feb 10 price swing
- SUP 3: 1.2933 Low Nov 5 2020
- SUP 4: 1.2855 Low Nov 2 2020 and a key support
GBPUSD traded sharply lower Monday, extending the pullback from 1.3298, Mar 23 high. The pair has recently failed to hold above the 20-day EMA and the 1.0% 10-dma envelope (at 1.3257) - both were breached last week. The pullback also means a key resistance at 1.3322, the 50-day EMA, remains intact. Prices have breached 1.3120, the Mar 22 low and this opens 1.3000, Mar 15 low. Clearance of the 50-day EMA is required to signal a reversal.
EURGBP TECHS: Key Resistance Still Intact
- RES 4: 0.8498/8536 High Dec 23 / 2.0% 10-dma envelope
- RES 3: 0.8478 High Feb 7
- RES 2: 0.8458 High Mar 17 and a bull trigger
- RES 1: 0.8400 High Mar 28
- PRICE: 0.8388 @ 06:24 GMT Mar 29
- SUP 1: 0.8296 Low Mar 23
- SUP 2: 0.8278 Low Mar 7
- SUP 3: 0.8203 Low Mar 7 and the bear trigger
- SUP 4: 0.8131 Low Jun 27, 2016
EURGBP traded higher Monday, easing the current bearish threat. Key short-term resistance is at 0.8458, the Mar 17 high. The recent pullback from this level still highlights a negative outlook and has exposed support at 0.8278, Mar 7 low. A break of 0.8278 would suggest a stronger bearish reversal and open key short-term support at 0.8203, Mar 7 low. For bulls, a break of 0.8458, Mar 17 high, would be a positive development.
USDJPY TECHS: Volatile But Conditions Remain Bullish
- RES 4: 126.26 3.382 proj of the Dec 3 ‘21 - Jan 4 -24 price swing
- RES 3: 125.86 High Jun 5 2015 and a major resistance
- RES 2: 125.28 High Aug 12 2015
- RES 1: 125.09 High Mar 28
- PRICE: 123.44 @ 06:18 GMT Mar 29
- SUP 1: 121.97 Low Mar 28
- SUP 2: 120.95 Low Mar 24
- SUP 3: 120.00 Round number support
- SUP 4: 119.04/06 Low Mar 21 / 20-day EMA
USDJPY rallied sharply higher Monday, cresting at a new cycle high and the best levels since 2015 at 125.09. This marks a considerable technical break for the pair, and extends the extremely overbought condition (the 14-day RSI hit its highest since 2001 on Monday). Current momentum however suggests the USD still has the potential to extend this bull cycle, which would open 125.28 ahead of major resistance at 125.86. Initial support is at 121.97.
EURJPY TECHS: Trend Needle Still Points North
- RES 4: 140.03 High Jun 23 2015
- RES 3: 139.00 High Aug 21 2015 and a key resistance
- RES 2: 138.62 High Aug 25 2015
- RES 1: 137.50/53 High Feb 2 ‘18 and major resistance / High Mar 28
- PRICE: 135.60 @ 06:31 GMT Mar 29
- SUP 1: 133.94 Low Mar 28
- SUP 2: 132.95/33 Low Mar 24 / 23
- SUP 3: 131.46 20-day EMA
- SUP 4: 130.46 50-day EMA
EURJPY traded to a fresh trend high Monday as the recent strong impulsive bull run accelerated. The cross cleared a key resistance last week at 134.13, Jun 1 2021 high. This strengthened bullish conditions and Monday’s gains reinforce current conditions. It is worth noting that the trend has entered overbought territory as it steepens - a possible risk for short-term bulls. The focus is on 137.50 (probed), the Feb 2 2018 high and a major resistance.
AUDUSD TECHS: Trend Conditions Still Bullish
- RES 4: 0.7617 High Jun 25
- RES 3: 0.7599 High Jul 6 2021
- RES 2: 0.7556 High Oct 28 and a key resistance
- RES 1: 0.7540/65 High Mar 28 / 2.0% 10-dma envelope
- PRICE: 0.7490 @ 06:36 GMT Mar 29
- SUP 1: 0.7450/7376 Low Mar 23 / Low Mar 22
- SUP 2: 0.7372 20-day EMA
- SUP 3: 0.7289 50-day EMA
- SUP 4: 0.7165 Low Mar 15 and a key support
AUDUSD is trading below its recent YTD and multi-month highs. From a trend perspective, conditions remain bullish. Last week’s important technical break was the move above 0.7441, Mar 7 high, marking an extension of the strong reversal from 0.7165, Mar 15 low. This reinforces the current bull cycle that began Jan 28. The break of 0.7441 signals scope for a climb towards 0.7556, the Oct 28 high. Initial firm support is seen at 0.7376.
USDCAD TECHS: Key Support Remains Exposed
- RES 4: 1.2924 High Dec 22
- RES 3: 1.2871/2901 High Mar 15 / High Mar 8 and a key resistance
- RES 2: 1.2778 High Mar 16
- RES 1: 1.2593/2638 High Mar 28 / 20-day EMA
- PRICE: 1.2519 @ 06:41 GMT Mar 29
- SUP 1: 1.2466 Low Mar 25
- SUP 2: 1.2454 Low Jan 19 and a key support
- SUP 3: 1.2387 Low Nov 10 2021
- SUP 4: 1.2328 Low Oct 29 2021
Trend conditions in USDCAD still appear bearish. The pair traded to a new cycle low on Mar 25. The move lower and most recently, a break of 1.2552, 76.4% of the Jan 19 - Feb 24 rally, reinforces a bearish theme and signals scope for a continuation lower. The focus is on the next key support at 1.2451, Jan 19 low. On the upside, initial firm resistance is seen at 1.2635, the 20-day EMA. A break of this average would ease bearish pressure.
FIXED INCOME
BUND TECHS: (M2) Downtrend Intact
- RES 4: 163.20 High Mar 11
- RES 3: 164.43 High Mar 10
- RES 2: 162.73 High Mar 14
- RES 1: 160.31/161.41High Mar 23 / 20-day EMA
- PRICE: 157.99 @ 04:54 GMT Mar 29
- SUP 1: 157.65 Low Mar 28
- SUP 2: 157.33 Low Oct 10 2018 (cont)
- SUP 3: 156.88 Low Mar 8 2018 (cont)
- SUP 4: 156.55 Low Dec 8 2015 (cont)
Bunds remain in a downtrend and the contract is trading near its recent lows. Futures last week, traded through the psychological 160.00 handle. The continuation lower confirmed an extension of the broader bearish price sequence of lower lows and lower highs that has unfolded since Aug / Sep 2019. With bearish momentum conditions dominating, the focus is on 157.33 next, Oct 10 2018 low (cont). Firm resistance is at 160.31.
BOBL TECHS: (M2) Trend Needle Still Points South
- RES 4: 131.550 High Mar 11
- RES 3: 130.870 High Mar 18
- RES 2: 130.604 20-day EMA
- RES 1: 129.770 High Mar 25
- PRICE: 128.800 @ 05:00 GMT Mar 29
- SUP 1: 128.580 Low Mar 28
- SUP 2: 128.340 Low Sep 17 2015 (cont)
- SUP 3: 128.000 Round number support
- SUP 4: 127.750 Low Jun 5 2015 (cont)
Bobl futures traded lower again Monday with bearish momentum conditions continuing to dominate. The move lower has again confirmed a resumption of the underlying downtrend and maintains the broader bearish price sequence of lower lows and lower highs. The break lower paves the way for a move towards 128.340 next, the Sep 14 2015 low (cont). The 20-day EMA at 130.604 is seen as a firm resistance.
SCHATZ TECHS: (M2) Bearish Trend Conditions
- RES 4: 111.430 High Mar 18
- RES 3: 111.280 20-day EMA
- RES 2: 111.170 High Mar 23
- RES 1: 110.915 High Mar 28
- PRICE: 110.790 @ 05:08 GMT Mar 29
- SUP 1: 110.725 Low Mar 28
- SUP 2: 110.602 38.2% retracement of the 2011 - 2020 bull cycle
- SUP 3: 110.590 Low Jun 10/11 2014 (cont)
- SUP 4: 110.475 Low May 12 2014 (cont)
Schatz futures remain vulnerable and yesterday resumed their downtrend. The continued move lower strengthens bearish conditions and confirms a resumption of the underlying downtrend plus, it marks an extension of the broader bearish price sequence of lower lows and lower highs. 111.00 has been cleared and this paves the way for a move towards 110.602, a Fibonacci retracement. Initial firm resistance is seen at 111.170.
GILT TECHS: (M2) Gains Considered Corrective
- RES 4: 124.60 High Mar 8
- RES 3: 123.52 High Mar 9
- RES 2: 122.72 High Mar 18 and a key near-term resistance
- RES 1: 121.94 20-day EMA
- PRICE: 121.28 @ Close Mar 28
- SUP 1: 119.86 Low Mar 28
- SUP 2: 119.75 123.6% retracement of the Feb 15 - Mar 1 climb
- SUP 3: 119.36 Low Oct 10 2018 (cont)
- SUP 4: 118.92 138.2% retracement of the Feb 15 - Mar 1 climb
Trend conditions in Gilt futures remain bearish. Futures traded to a fresh cycle low Monday but did rebound from the session low of 119.86. Gains are considered corrective. The break of 120.26, Mar 24 low, marks a resumption of the broader downtrend and this has resulted in a test of the 120.00 handle. Further weakness would open 119.75, a Fibonacci retracement. Key short-term resistance is seen at 122.72, Mar 18 high.
BTP TECHS: (M2) Heading South
- RES 4: 145.06 High Mar 8
- RES 3: 143.85 High Mar 10
- RES 2: 140.71/42.51 High Mar 11 / Low Mar 1
- RES 1: 139.97 20-day EMA
- PRICE: 137.65 @ Close Mar 28
- SUP 1: 136.83 Low Mar 28
- SUP 2: 136.13 61.8% retracement of the Mar ‘19 - Aug ‘21 bull cycle
- SUP 3: 135.43 Low May 7 2020 (cont)
- SUP 4: 134.61 Low Apr 24 2020 (cont)
BTP futures remain vulnerable and the trend remains bearish - futures traded to a fresh cycle low Monday. The move lower marks an extension of last week’s break lower, through support at 138.60, Feb 16 low. This confirms a resumption of the downtrend and highlights an extension of the broader bearish price sequence of lower lows and lower highs. The focus is on 136.13, a Fibonacci retracement. Firm resistance is seen at 139.97.
EQUITIES
EUROSTOXX50 TECHS: (M2) Eyeing The 50-Day EMA
- RES 4: 4132.00 High Feb 10
- RES 3: 4072.00 High Feb 16
- RES 2: 3965.50 High Feb 23
- RES 1: 3861.40/3866.00 50-day EMA / High Mar 23
- PRICE: 3845.00 @ 05:39 GMT Mar 29
- SUP 1: 3555.50 Low Mar 15 and a key near-term support
- SUP 2: 3455.00 Low Mar 9
- SUP 3: 3441.50 Low Mar 7 and the bear trigger
- SUP 4: 3379.00 Low Dec 21 2020 (cont)
EUROSTOXX 50 futures continue to trade inside its current range and the recent consolidation still appears to be a bull flag - a continuation pattern that reinforces current bullish conditions. Attention remains on the 50-day EMA at 3861.40. This average represents an important resistance. If cleared, it would further strengthen a bullish short-term theme and open 3965.50. Support to watch is at 3555.50 Mar 15 low. A break would be a bearish development.
E-MINI S&P (M2): Bull Cycle Extends
- RES 4: 4730.50 High Jan 1
- RES 3: 4663.50 High Jan 18
- RES 2: 4578.50 High Feb 9 and a key resistance
- RES 1: 4633.44 76.4% retracement of the Jan 4 - Feb 24 downleg
- PRICE: 4576.75 @ 06:39 GMT Mar 29
- SUP 1: 4407.82 20-day EMA
- SUP 2: 4129.50/4094.25 Low Mar 15 / Low Feb 24 and a bear trigger
- SUP 3: 4055.60 Low May 19 2021 (cont)
- SUP 4: 4029.25 Low May 13 2021 (cont)
S&P E-Minis are trading higher, extending the bull cycle that started Mar 15. Bullish conditions have also been reinforced by the recent break of both the 20- and 50-day EMAs. The breach of the latter EMA marks an important short-term bullish development. Resistance at 4578.50, Feb 9 high has been probed. A clear break would open 4663.50, the Jan 18 high. Initial support is at 4407.82, the 20-day EMA. A break would be a bearish development.
COMMODITIES
BRENT TECHS: (K2) Probes The 20-Day EMA
- RES 4: $139.13 - High Mar 7 and key resistance
- RES 3: $133.15 - High Mar 8
- RES 2: $129.17 - 76.4% retracement of the Mar 7 - 16 downleg
- RES 1: $123.74 - High Mar 24
- PRICE: $111.98 @ 06:56 GMT Mar 29
- SUP 1: $109.06 - Low Mar 28
- SUP 2: $101.35/96.93 - 50-day EMA / Low Mar 16
- SUP 3: $92.75 - Low Feb 25
- SUP 4: $88.25 - Low Feb 18
Brent futures traded lower Monday, extending the pullback from last week’s high of $123.74 on Mar 24. The contract has probed support at the 20-day EMA, at 110.57. A clear break of this EMA would suggest scope for a deeper short-term retracement and open the 50-day EMA that intersects at $101.35. The 50-day average marks a key pivot support. On the upside, clearance of $123.74 would instead confirm a resumption of bullish activity.
WTI TECHS: (K2) Scope For A Deeper Retracement
- RES 4: $126.42 - High Mar 7 and the bull trigger
- RES 3: $122.73 - High Mar 9
- RES 2: $118.34 - 76.4% retracement of the Mar 7 - 15 downleg
- RES 1: $116.64 - High Mar 24
- PRICE: $105.44 @ 07:03 GMT Mar 29
- SUP 1: $102.83 - Low Mar 28
- SUP 2: $96.44/92.20 - 50-day EMA / Low Mar 15
- SUP 3: $88.49 - Low Feb 25
- SUP 4: $85.81 - Low Feb 18
WTI futures remain in an uptrend however yesterday’s move lower does highlight potential for a deeper retracement. The contract has traded below the 20-day EMA, at $104.82. A clear break would strengthen a bearish case and signal scope for a move towards the 50-day EMA at $96.44. This EMA represents an important pivot level. On the upside, clearance of $116.64 would reinstate recent bullish conditions.
GOLD TECHS: 50-Day EMA Remains Exposed
- RES 4: $2104.6 - 3.236 proj of the Dec 15 - Jan 25 - 28 price swing
- RES 3: $2075.5 - High Aug 7 2020 and the all-time high
- RES 2: $2009.2/2070.4 - High Mar 10 / High Mar 8
- RES 1: $1966.1 - High Mar 24
- PRICE: $1923.7 @ 07:19 GMT Mar 29
- SUP 1: $1902.7/1895.3 - 50-day EMA / Low Mar 16
- SUP 2: $1878.4 - Low Feb 24 and key short-term support
- SUP 3: $1848.8 - 76.4% retracement of the Jan 28 - Mar 8 rally
- SUP 4: $1821.1 - Low Feb 11
Gold traded low Monday. The outlook remains bearish following the recent pullback from the Mar 8 high of $2070.4. The move lower is allowing a recent overbought condition to unwind. Key support is seen at the 50-day EMA that intersects at $1902.7 - just ahead of the Mar 15 low of $1895.3. A break of the 50-day average would signal scope for a deeper pullback. Firm short-term resistance is seen at $2009.2, Mar 10 high. Initial resistance is at $1966.1.
SILVER TECHS: Bearish Threat Remains Present
- RES 4: $27.831 - High Jun 16 2021
- RES 3: $27.245 - High Jun 17 2021
- RES 2: $27.000 - Round number resistance
- RES 1: $26.063/943 - High Mar 10 / High Mar 8 and the bull trigger
- PRICE: $24.918 @ 07:23 GMT Mar 29
- SUP 1: $24.487/473/487 - 50-day EMA / Low Mar 16
- SUP 2: $23.850 - Low Feb 24
- SUP 3: $22.863 - Low Feb 11
- SUP 4: $22.008 - Low Feb 3 and a key support
Silver gains last week stalled at $24.847, the Mar 24 high. A short-term bearish theme remains intact and potential is seen for a deeper retracement. Attention is on the 50-day EMA at $24.487. This EMA marks an important support and a break would signal scope for an extension lower. For bulls, a move above $26.00 would refocus attention on the key resistance at 26.943, the Mar 8 high.
Why MNI
MNI is the leading provider
of intelligence and analysis on the Global Fixed Income, Foreign Exchange and Energy markets. We use an innovative combination of real-time analysis, deep fundamental research and journalism to provide unique and actionable insights for traders and investors. Our "All signal, no noise" approach drives an intelligence service that is succinct and timely, which is highly regarded by our time constrained client base.Our Head Office is in London with offices in Chicago, Washington and Beijing, as well as an on the ground presence in other major financial centres across the world.