
Why MNI
MNI is the leading provider
of intelligence and analysis on the Global Fixed Income, Foreign Exchange and Energy markets. We use an innovative combination of real-time analysis, deep fundamental research and journalism to provide unique and actionable insights for traders and investors. Our "All signal, no noise" approach drives an intelligence service that is succinct and timely, which is highly regarded by our time constrained client base.Our Head Office is in London with offices in Chicago, Washington and Beijing, as well as an on the ground presence in other major financial centres across the world.
Executive Summary:
- The uptrend in USDJPY that started January 2021 when the pair reversed from a low of 102.59, remains intact
- Technical signals suggest that the pair is likely to continue to appreciate in Q2 and a clear break of 125.00 and 125.86 would strengthen the bullish condition.
- At current levels, USDJPY is extremely overbought and the most recent portion of the uptrend is very steep. A correction is overdue
On Jan 17 we discussed the uptrend in USDJPY that started January 2021 when the pair reversed from a low of 102.59. The USD has continued to strengthen this year and technical signals suggest the bull trend remains intact and that Q2 is also likely to deliver an appreciation in price. 120.00 has been cleared and attention has turned to 125.00. Note that the trend has accelerated today and this has resulted in a test of 125.00.
A recap of the benefits a point and figure chart provides and what it tells us about USDJPY
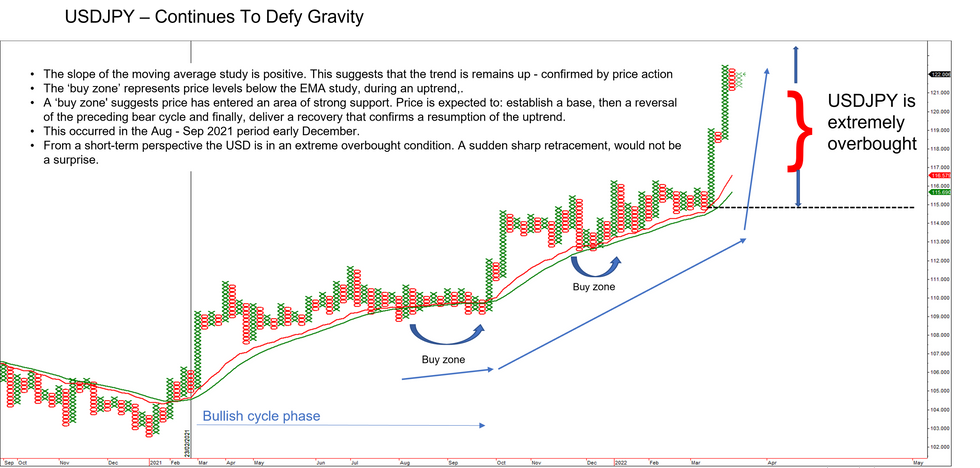
A point and figure (P&F) chart provides a clear overview of the current uptrend. We apply a moving average study to determine the slope of the average. The slope highlights the trend direction and assists in identifying areas of support - a buy zone - where demand is likely to confirm a resumption of the primary uptrend.
In the P&F chart above:
- The slope of the moving average study remains positive.
- This suggests that the trend is up. Note that this condition has been in place since February 2021.
- The - buy zone - represents price levels below the EMA study, in an uptrend, where strong support is likely to be present. Once price enters this zone, it is expected to:
- Establish a base.
- Highlight a reversal of the preceding corrective bear cycle.
- Deliver a recovery that confirms a resumption of the uptrend.
- This occurred in the Aug - Sep 2021 period and more in early December 2021.
- As long as this positive set-up; bullish price activity, a positive sloping MA condition and a buy-zone that delivers a resumption of the uptrend, remains intact, the indications are that USDJPY will likely continue to appreciate in Q2.
- Finally, a key support on the P&F chart has been defined at 114.80, lows in early March. A break of this level is needed to signal a more significant reversal. As long as it remains in place, the medium-term outlook appears bullish.
Long-term trendlines have been breached
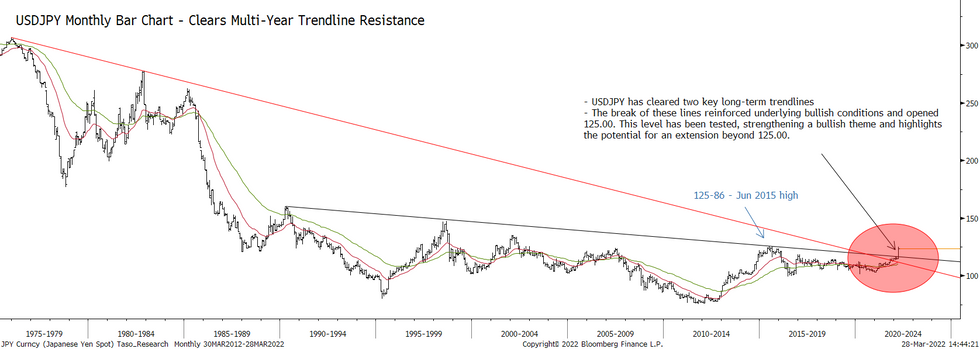
The monthly chart above highlights the break of some key chart points:
- A long-term trendline resistance drawn from the Dec 1975 highs that was breached in Oct last year.
- This exposed a second flatter line, drawn from the Apr 1990 high. The line intersects at 116.72 this month and has clearly been breached, reinforcing the current bullish set-up.
- Clearance of these lines has resulted in a climb above the 120.00 psychological handle.
- This opens the Jun 2015 high of 125.86. This is a key resistance and if cleared, would highlight a broader bullish price sequence of higher highs and higher lows on the monthly chart that would reinforce the medium-term bullish argument. Would this signal a move towards 130.00?
The current short-term picture in USDJPY
- It is fair to say that USDJPY is extremely overbought at current levels -today's impulsive rally has touched a high of 125.09.
- The overbought reading is clearly highlighted by the position by the deviation in price on the P&F chart from the moving averages in the study - today's 125.09 high from the P&F 20-day EMA of 115.60 - see P&F chart above.
- Trends tend to retrace / correct back to moving average values - the rational area of a trend - before starting the next phase of the dominant trend.
- Note too that the most recent portion of the uptrend, since Mar 11, is very steep. This, together with overbought conditions, suggest that a sudden correction would not be a surprise. Indeed, this would be seen as a healthy trend development.
Why MNI
MNI is the leading provider
of intelligence and analysis on the Global Fixed Income, Foreign Exchange and Energy markets. We use an innovative combination of real-time analysis, deep fundamental research and journalism to provide unique and actionable insights for traders and investors. Our "All signal, no noise" approach drives an intelligence service that is succinct and timely, which is highly regarded by our time constrained client base.Our Head Office is in London with offices in Chicago, Washington and Beijing, as well as an on the ground presence in other major financial centres across the world.