
Why MNI
MNI is the leading provider
of intelligence and analysis on the Global Fixed Income, Foreign Exchange and Energy markets. We use an innovative combination of real-time analysis, deep fundamental research and journalism to provide unique and actionable insights for traders and investors. Our "All signal, no noise" approach drives an intelligence service that is succinct and timely, which is highly regarded by our time constrained client base.Our Head Office is in London with offices in Chicago, Washington and Beijing, as well as an on the ground presence in other major financial centres across the world.
USD Nosedive Drives FX In Asia
USD was the big mover overnight, as it started the week with a nosedive.
Sino-U.S. tit-for-tat consulate closures inspired JPY demand early on, which
sent USD/JPY to fresh cycle lows. The spot continued to slide, even
as broader JPY strength waned, while a surge in gold and concerns over
U.S. fiscal matters kept denting DXY, pushing it to a 22-month low.
- USD sales helped USD/CNH probe the water below the CNH7.0 mark, in spite
of a softer than expected PBoC fix and persistent Sino-U.S. jitters. A jump in
Chinese industrial profits may have helped the redback. - The Antipodeans recouped initial losses, with AUD looking through comments
from RBA Asst Gov Kent. The official stuck to a familiar script, expressing
preference for a weaker AUD, but noted that the currency trades in line
with fundamentals. - NOK led gains in G10 FX space, even as its oil-tied peer CAD landed
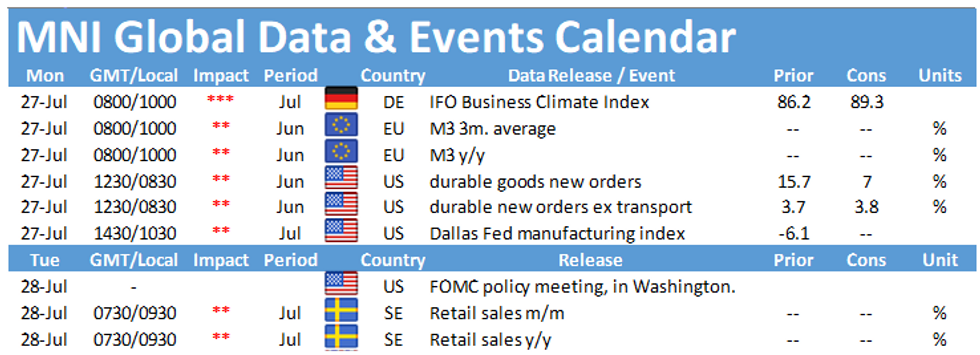
towards the lower end of the pile. - Focus turns to German Ifo Survey and flash U.S. durable goods orders.
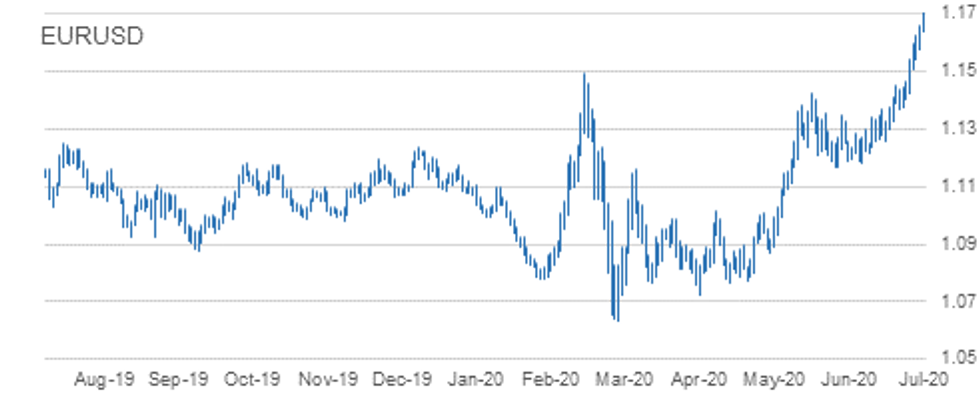
EURUSD: Fresh High Print
- RES 4: 1.1815 High Sep 2018
- RES 3: 1.1800 Round number resistance
- RES 2: 1.1781 2.000 proj of Apr Mar 23 - 30 rally from Apr 24 low
- RES 1: 1.1725 Intraday high
- PRICE: 1.1708 @ 05:52 BST Jul 27
- SUP 1: 1.1639/1581 Intraday low / Low Jul 24
- SUP 2: 1.1507 Low Jul 22
- SUP 3: 1.1423 Low Jul 21
- SUP 4: 1.1371 Low Jul 16 and key near-term support
EURUSD is holding onto last week gains and has started this week on a firm note rallying to fresh highs in Asia. Bulls remain in control. A positive theme follows last week's breach of 1.1495, Mar 9 high registering fresh 2020 highs. This also confirmed a strong resumption of the broader uptrend that has been in place since the reversal on Mar 20. The focus is on 1.1815 next, the September 2018 high. Initial support is at 1.1639.
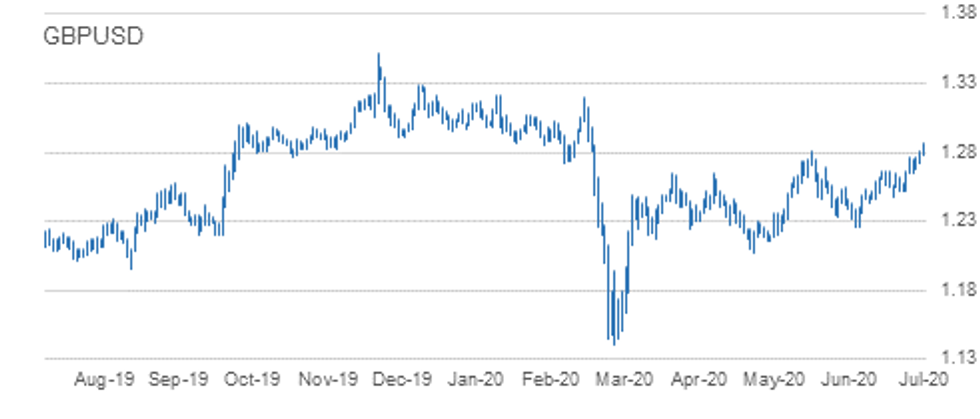
GBPUSD: Bullish Focus Intact
- RES 4: 1.3130 High Mar 10
- RES 3: 1.3020 0.764 proj of the Mar 20 - Apr 14 rally from May 18 low
- RES 2: 1.2977 High Mar 11
- RES 1: 1.2859 Intraday high
- PRICE: 1.2831 @ 06:07 BST Jul 27
- SUP 1: 1.2717 Low Jul 24
- SUP 2: 1.2644 Low Jul 22
- SUP 3: 1.2611 20-day EMA
- SUP 4: 1.2535/2480 50-day EMA / Low Jul 14
GBPUSD maintains a bullish tone and has started the week on a firm note. The pair has today cleared resistance at 1.2813 Jun 10 high, confirming a resumption of the broader uptrend that has been in place since the reversal on Mar 20. Attention turns to 1.2977, Mar 11 high and 1.3020, a Fibonacci projection. On the downside, firm near-term support has been defined at 1.2644, Jul 22 low. Bullish!
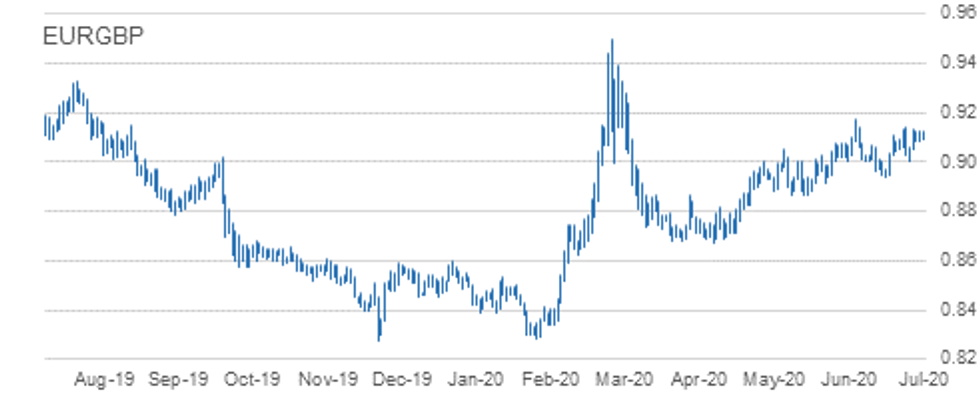
EURGBP: Looking For A Break Higher
- RES 4: 0.9184 61.8% Fibonacci retracement of the Mar - Apr decline
- RES 3: 0.9176 High Jun 29 and the bull trigger
- RES 2: 0.9145 High Jun 30
- RES 1: 0.9138 High Jul 20
- PRICE: 0.9118 @ 06:14 BST Jul 27
- SUP 1: 0.9049 20-Day EMA
- SUP 2: 0.9001 Low Jul 21 and key near-term support
- SUP 3: 0.8991 50-day EMA
- SUP 4: 0.8938 Low Jul 10 and the key near-term support
EURGBP found support Jul 21 and has defined a S/T base at 0.9001The outlook remains bullish. Recent Japanese candle patterns highlighted a reversal. Activity Jun 13, was a bullish engulfing and followed a doji candle on Jun 10. Together they signalled a reversal off 0.8938, Jun 10 low. The focus is on 0.9145, Jun 30 high and 0.9176, Jun 29 high. A break of 0.9001 would concern bulls.
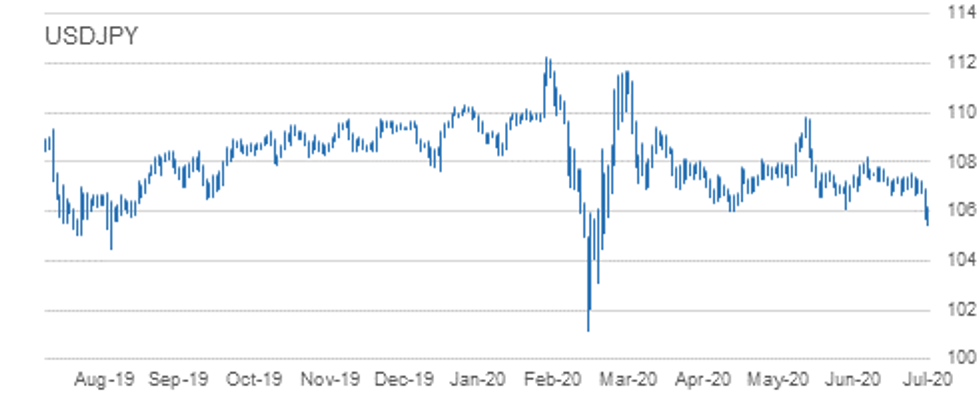
USDJPY: Confirms Break Of Key Support Zone
- RES 4: 107.79 High Jul 7 and key resistance
- RES 3: 107.53 High Jul 20
- RES 2: 106.90 High Jul 24
- RES 1: 106.16 Intraday high
- PRICE: 105.61 @ 06:23 BST Jul 27
- SUP 1: 105.46 Intraday low
- SUP 2: 105.21 61.8% retracement of the Mar 9 - 24 rally
- SUP 3: 104.86 2.0% 10-dma envelope
- SUP 4: 104.51 Low Mar 13
USDJPY remains under pressure trading lower in Asia. Bearish pressure is likely to continue dominating near-term. Friday's bearish session saw the pair breach key supports at 106.07, Jun 23 low and 105.99, the May 6 and 7 low. Today's move lower has confirmed a clear break of this support zone. This paves the way for a move towards 105.21 next, a Fibonacci retracement level. Initial resistance is at today's intraday high of 106.16.
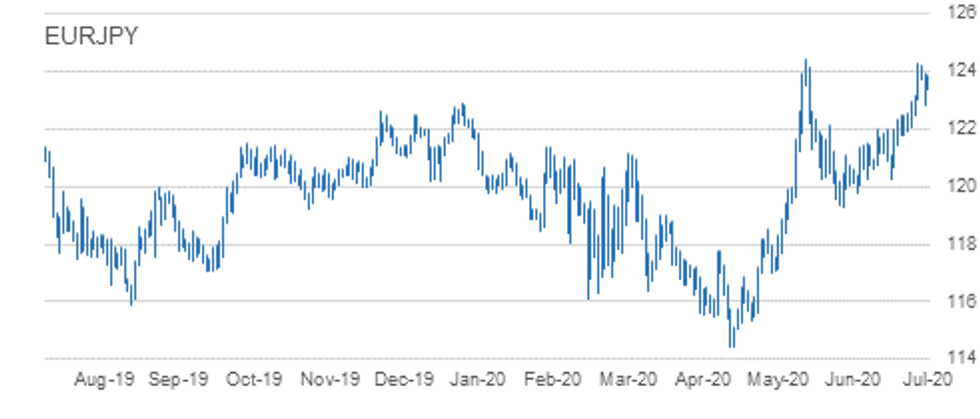
EURJPY: Trading Below Last Weeks High
- RES 4: 125.49 0.618 projection of the May 6 - Jun 5 from Jun 22 low
- RES 3: 125.23 High May 1, 2019
- RES 2: 124.96 2.0% 10-dma envelope
- RES 1: 124.29/43 High Jul 22 / Jun 5 and key resistance
- PRICE: 123.58 @ 06:29 BST Jul 27
- SUP 1: 122.84 Low Jul 24
- SUP 2: 122.47 Low Jul 21
- SUP 3: 122.20 20-day EMA
- SUP 4: 121.82 Low Jul 15 and 16
EURJPY last week found resistance at 124.29, Jul 22 high just ahead of the primary resistance at 124.43, Jun 5 high. Friday saw key support at 123.06 probed before the cross found strong support at the day low of 122.84. A close below 123.06 would signal a top and highlight the potential for a deeper correction. For now, the current uptrend remains intact. Clearance of 124.43 would trigger an extension higher.
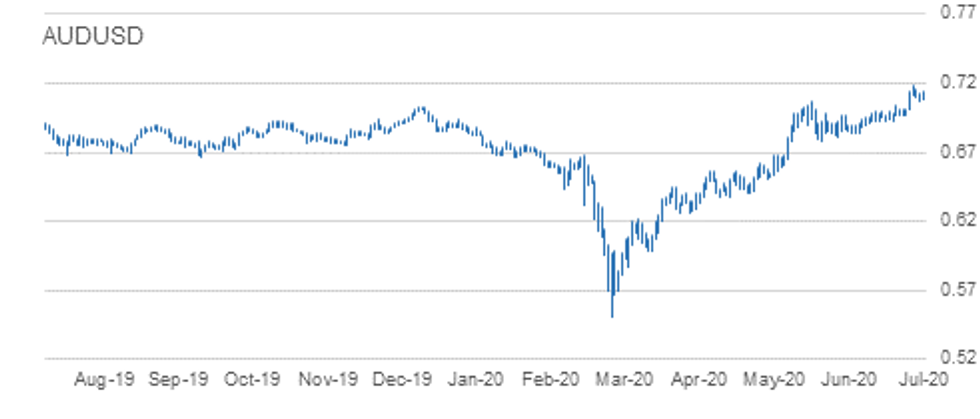
AUDUSD: Remains In An Uptrend
- RES 4: 0.7246 High Feb 6, 2019
- RES 3: 0.7222 1.764 projection of the Mar 19 - 31 rally from Apr 3 low
- RES 2: 0.7206 High Apr 17, 2019
- RES 1: 0.7182/99 High Jul 22 / High Apr 18, 2019
- PRICE: 0.7130 @ 06:34 BST Jul 27
- SUP 1: 0.7063 High Jun 10 and former breakout level
- SUP 2: 0.7010 Low Jul 21
- SUP 3: 0.6963 Low Jul 16
- SUP 4: 0.6922/21 Low Jul 7 / Low Jul 14
AUDUSD remains in an uptrend. Last week the pair cleared former resistance at 0.7063, Jun 10 high. The breach confirmed a resumption of the uptrend that has been in place since Mar 19. Price also traded above the recent objective of 0.7119, a Fibonacci projection and the focus is on 0.7222. On the downside, the key near-term support remains 0.6922/21, Jul 7 and 14 low. Initial support is at 0.7063.
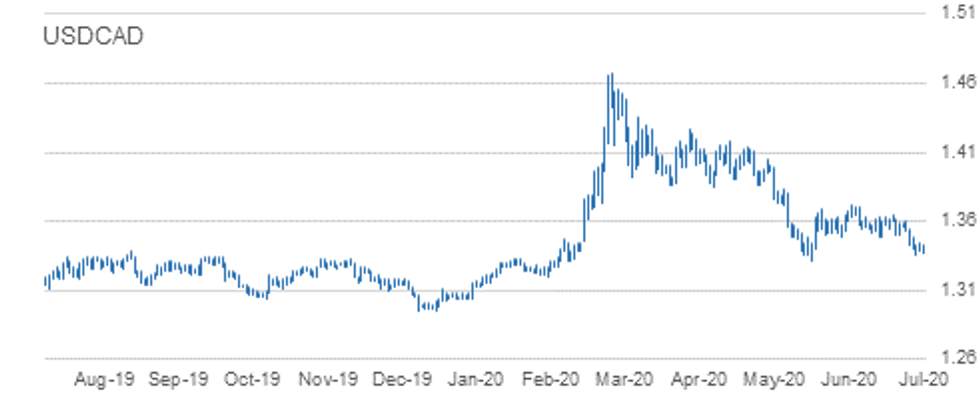
USDCAD: Remains Vulnerable
- RES 4: 1.3618/46 50-day EMA / High Jul 14 and key S/T resistance
- RES 3: 1.3600 High Jul 20
- RES 2: 1.3537 High Jul 21
- RES 1: 1.3491 Low Jul 9
- PRICE: 1.3386 @ 06:37 BST Jul 27
- SUP 1: 1.3351 Low Jul 23
- SUP 2: 1.3316 Low Jun 10 and bear trigger
- SUP 3: 1.3235 Low Feb 24
- SUP 4: 1.3267 Low Feb 25
USDCAD remains vulnerable. Price action last week cleared key support at 1.3486, Jun 23 low. This confirmed the end of the broad sideways move that had dominated since mid-June. The former support at 1.3398 Jun 11 low has also been cleared, reinforcing the bearish threat. The break lower opens the primary support at 1.3316, Jun 10 low where clearance would expose 1.3202, Feb 21 low. Resistance is at 1.3491, Jul 9 low.
LEVELS:
EUR/USD: MNI KEY LEVELS
*$1.1938 May15-2018 high*$1.1884 100-mma
*$1.1857 Upper 3.0% 10-dma envelope*$1.1851 Jun14-2018 high
*$1.1830 Upper Bollinger Band (3%)
*$1.1815 Sep24-2018 high*$1.1757 Sep27-2018 high
*$1.1742 Upper 2.0% 10-dma envelope
*$1.1736 Fibo 38.2% 1.3993-1.0341
*$1.1725 Intraday high, YTD Jul27 high
*$1.1700 ***CURRENT MARKET PRICE 06:23BST MONDAY***
*$1.1686 Upper Bollinger Band (2%)
*$1.1651 Sep28-2018 high*$1.1639 Intraday low
*$1.1627 Jul23 high, Upper 1.0% 10-dma env
*$1.1579 100-hma*$1.1541 Jul23 low
*$1.1507 Jul22 low
*$1.1499/95 200-hma/Mar09 high
*$1.1468 Jul20 high*$1.1423 Jul21 low
GBP/USD: MNI KEY LEVELS
*$1.3056 Upper 3.0% 10-dma envelope
*$1.3018/19 Feb25 high/Mar09 low
*$1.2977/81 Mar11 high/Feb21 high
*$1.2969/70 Mar05 high/Feb24 high
*$1.2954 50-mma
*$1.2947/51 Mar06 low/Upper Boll Band (3%)
*$1.2929 Upper 2.0% 10-dma envelope
*$1.2906 200-wma
*$1.2859/61 Intraday high/Mar05 low
*$1.2834 Upper Bollinger Band (2%)
*$1.2832 ***CURRENT MARKET PRICE 06:22BST MONDAY***
*$1.2813 Jun10 high
*$1.2802 Upper 1.0% 10-dma envelope
*$1.2781 Intraday low
*$1.2746/42 100-wma/100-hma
*$1.2717 Jul24 low
*$1.2701 200-dma
*$1.2673 Jul23 low
*$1.2663 200-hma
*$1.2644 Jul22 low
*$1.2625 Jul16 high
EUR/GBP: MNI KEY LEVELS
*Gbp0.9339 Mar20 high
*Gbp0.9326 Mar24 high
*Gbp0.9276 Mar25 high
*Gbp0.9263 Upper 2.0% 10-dma envelope
*Gbp0.9240 Mar26 high
*Gbp0.9192 Upper Bollinger Band (3%)
*Gbp0.9173/76 Upper 1.0% 10-dma env/Jun29 high
*Gbp0.9143/45 Upper Boll Band (2%)/Jun30 high
*Gbp0.9137/38 Jul22 high/Jul20 high
*Gbp0.9124/25 Intraday high/Jul23 high, Jul24 high
*Gbp0.9118 ***CURRENT MARKET PRICE 06:21BST MONDAY***
*Gbp0.9092 Intraday low
*Gbp0.9087/84/82 100-hma/Jul24 low/Jul23 low
*Gbp0.9081 200-hma
*Gbp0.9052/49 Jul22 low/21-dma
*Gbp0.9003/01 50-dma/Jul21 low
*Gbp0.8992/91 55-dma/Lower 1.0% 10-dma env
*Gbp0.8960 Cloud top
*Gbp0.8946 Jul13 low, Jul09 low, Lower Boll Band (2%)
*Gbp0.8938/34 Jul10 low/100-dma
*Gbp0.8912 Jun16 low
USD/JPY: MNI KEY LEVELS
*Y106.81 Cloud Kijun Sen
*Y106.70 100-hma
*Y106.67 100-mma
*Y106.50 Cloud Tenkan Sen
*Y106.22 May08 low
*Y106.16 Intraday high
*Y106.10 Lower Bollinger Band (2%)
*Y106.07 Jun23 low
*Y105.99 May06 low
*Y105.76 Lower 1.0% 10-dma envelope
*Y105.61 ***CURRENT MARKET PRICE 06:21BST MONDAY***
*Y105.59 Lower Bollinger Band (3%)
*Y105.46 Intraday low
*Y105.15 Mar16 low
*Y104.69 Lower 2.0% 10-dma envelope
*Y103.97 200-mma
*Y103.63 Lower 3.0% 10-dma envelope
*Y103.09 Mar12 low
*Y102.02 Mar10 low
*Y101.20 Nov09-2016 low
*Y101.19 YTD low
EUR/JPY: MNI KEY LEVELS
*Y124.80 200-wma
*Y124.43 YTD Jun05 high
*Y124.29 Jul22 high
*Y124.26 Upper Bollinger Band (2%
)*Y124.24 Jul23 high
*Y124.21 Upper 1.0% 10-dma envelope
*Y124.17 50-mma
*Y123.97 Jul24 high
*Y123.87 Intraday high
*Y123.55 100-hma
*Y123.54 ***CURRENT MARKET PRICE 06:20BST MONDAY***
*Y123.36 Intraday low
*Y123.06 Jul22 low, Cloud Tenkan Sen
*Y122.94 200-hma
*Y122.84 Jul24 low
*Y122.49 100-wma
*Y122.47 Jul21 low
*Y122.06 Jul20 low
*Y122.02 21-dma
*Y121.93 Jul17 low
*Y121.82 Jul15 low, Jul16 low
AUD/USD: MNI KEY LEVELS
*$0.7280 50-mma
*$0.7268 Upper 3.0% 10-dma envelope
*$0.7261 200-wma
*$0.7231 Upper Bollinger Band (3%)
*$0.7206/07 Apr17-2019 high/Feb21-2019 high
*$0.7198 Upper 2.0% 10-dma envelope
*$0.7182 YTD Jul22 high
*$0.7162 Jul23 high
*$0.7154 Upper Bollinger Band (2%)
*$0.7146 Intraday high
*$0.7131 ***CURRENT MARKET PRICE 06:18BST MONDAY***
*$0.7127 Upper 1.0% 10-dma envelope
*$0.7117 100-hma*$0.7087 Intraday low
*$0.7064/63 Jul24 low/Jun10 high
*$0.7056 200-hma
*$0.7038 Jul15 high
*$0.7010 Jul21 low
*$0.6994 21-dma
*$0.6986 Lower 1.0% 10-dma envelope
*$0.6973 Jul20 low
USD/CAD: MNI KEY LEVELS
*C$1.3625 Upper 1.0% 10-dma envelope
*C$1.3609 Cloud base
*C$1.3600 50-dma, Jul20 high
*C$1.3537 21-dma, Jul21 high
*C$1.3518 200-dma
*C$1.3489 200-hma
*C$1.3483 Jul22 high
*C$1.3445 Jul24 high
*C$1.3435 Intraday high
*C$1.3423/27 100-hma/Jul23 high
*C$1.3385 ***CURRENT MARKET PRICE 06:18BST MONDAY***
*C$1.3383 Lower Bollinger Band (2%)
*C$1.3371 Intraday low
*C$1.3360 100-wma
*C$1.3355/51 Lower 1.0% 10-dma env/Jul23 low
*C$1.3319/16/15 Mar03 low/Jun10 low/Mar02 low
*C$1.3309/08 Lower Boll Band (3%)/Feb24 high
*C$1.3272/67 Feb26 low/Feb25 low
*C$1.3235 Feb24 low
*C$1.3220 Lower 2.0% 10-dma envelope
*C$1.3212 Feb20 low
Why MNI
MNI is the leading provider
of intelligence and analysis on the Global Fixed Income, Foreign Exchange and Energy markets. We use an innovative combination of real-time analysis, deep fundamental research and journalism to provide unique and actionable insights for traders and investors. Our "All signal, no noise" approach drives an intelligence service that is succinct and timely, which is highly regarded by our time constrained client base.Our Head Office is in London with offices in Chicago, Washington and Beijing, as well as an on the ground presence in other major financial centres across the world.