
Why MNI
MNI is the leading provider
of intelligence and analysis on the Global Fixed Income, Foreign Exchange and Energy markets. We use an innovative combination of real-time analysis, deep fundamental research and journalism to provide unique and actionable insights for traders and investors. Our "All signal, no noise" approach drives an intelligence service that is succinct and timely, which is highly regarded by our time constrained client base.Our Head Office is in London with offices in Chicago, Washington and Beijing, as well as an on the ground presence in other major financial centres across the world.
Antipodeans Register Gains During A Limited Asia Session
It wasn't the most eventful session, with the opening remarks of a much awaited speech from Chinese Pres Xi proving rather unimpressive. Xi touched on several familiar talking points, tipping hat to China's "dual circulation" strategy, stressing Beijing's willingness to promote Hong Kong's & Macau's integration with mainland China and pledging to advance the reform and opening up of the Greater Bay area. USD/CNH stuck to a very tight range, with an in-line PBoC fix offering no material impetus, and the rate heads for the London session biased marginally lower.
- The Antipodeans were the best performers in G10 space, albeit NZD got some brief hiccups when RBNZ Asst Gov Hawkesby said that New Zealand's central bank wants to "go hard, go early" on policy. His comments revealed little new, basically echoing the message from RBNZ Chief Economist Ha from a few days back, and NZD didn't take much time to recover. AUD may have been supported by a continued surge in Westpac Consumer Confidence, attributed to the optimistic reception of the Federal Budget.
- Spot USD/KRW popped higher at the re-open, but more than erased early gains and slid into negative territory, printing its worst levels since Apr 2019. The BoK left its policy settings unchanged, as expected by virtually all analysts, while Gov Lee said that it's not the time to adopt QE and reiterated the central bank's readiness to intervene in FX markets if needed.
- Under the microscope today we have U.S. PPI, EZ industrial production, as well as comments from numerous speakers from the Fed, ECB, BoC, BoE & Riksbank.
EUR/USD: Sharp Reversal Lower Exposes Support
- RES 4: 1.2011 High Sep 1 and major resistance
- RES 3: 1.1917 High Sep 10 and 76.4% of the Sep 1 - 25 sell-off
- RES 2: 1.1859 61.8% retracement of the Sep 1 - 25 sell-off
- RES 1: 1.1817/31 High Oct 13 / High Oct 10 and the bull trigger
- PRICE: 1.1745 @ 05:44 BST Oct 14
- SUP 1: 1.1725 Low Oct 7 and key near-term support
- SUP 2: 1.1685 Low Sep 30
- SUP 3: 1.1612/1581 Low Sep 25 and the bear trigger / Low Jul 24
- SUP 4: 1.1584 100-dma
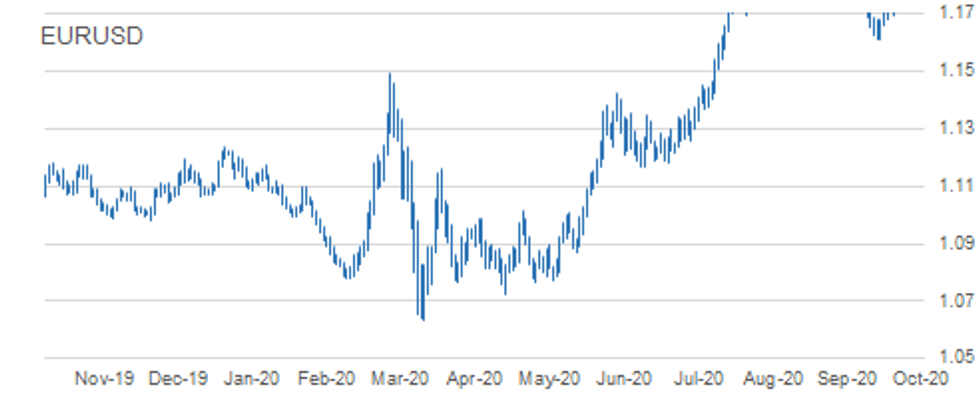
EURUSD reversed course Tuesday selling off sharply. Attention is on the near-term key support that lies at 1.1725, Oct 7 low. A break of this level would negate recent bullish signals and signal scope for deeper pullback, exposing support at 1.1612, Sep 25 low and the key bear trigger. If 1.1725 holds, the focus will once again turn to key resistance at 1.1831, Oct 10 high. A break resumes recent bullish pressure.
GBP/USD: Finds Resistance Ahead Of Former Trendline Support
- RES 4: 1.2280 High Sep 7
- RES 3: 1.3174 61.8% retracement of the Sep 1 - 23 sell-off
- RES 2: 1.3151 Former trendline support drawn off the Mar 20 low
- RES 1: 1.3083 High Oct 12
- PRICE: 1.2922 @ 05:52 BST Oct 14
- SUP 1: 1.2915 Intraday low
- SUP 2: 1.2846 Low Oct 7 and key near-term support
- SUP 3: 1.2806 Low Sep 30
- SUP 4: 1.2745 Low Sep 28
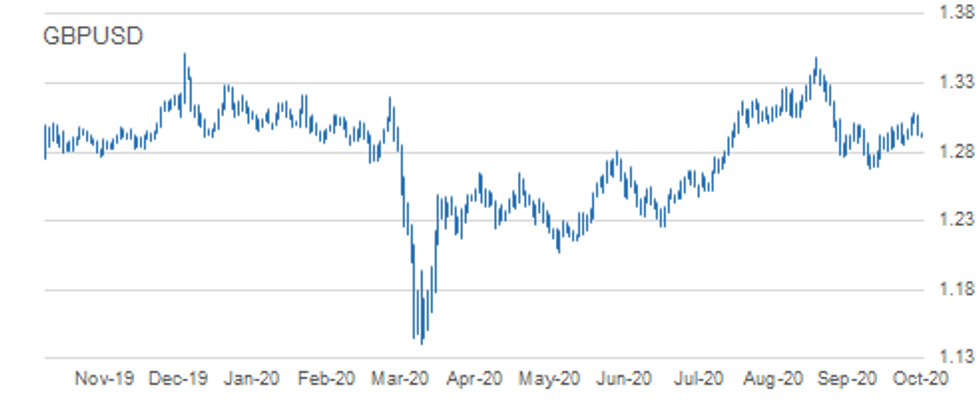
GBPUSD faced resistance Tuesday at 1.3083, Oct 12 high. Cable initially traded close to a key resistance at 1.3139 Tuesday. This marks the former trendline support that was breached on Sep 10 and intersects at 1.3151 today While this resistance remains intact, recent gains are likely a correction. A clear breach of 1.3151 would strengthen a bullish argument. The key support to watch to signal a reversal lower is 1.2846, Oct 7 low.
EUR/GBP: Probes The Bear Trigger At 0.9025
- RES 4: 0.9190 61.8% retracement of the Sep 11 - 28 sell-off
- RES 3: 0.9162 High Oct 7 and the bull trigger
- RES 2: 0.9132 High Oct 10
- RES 1: 0.9093 20-day EMA
- PRICE: 0.9087 @ 05:57 BST Oct 14
- SUP 1: 0.9020 Low Oct 13
- SUP 2: 0.9000 Round number support
- SUP 3: 0.8967 76.4% retracement of the Sep 3 - 11 rally
- SUP 4: 0.8808 Low May 13
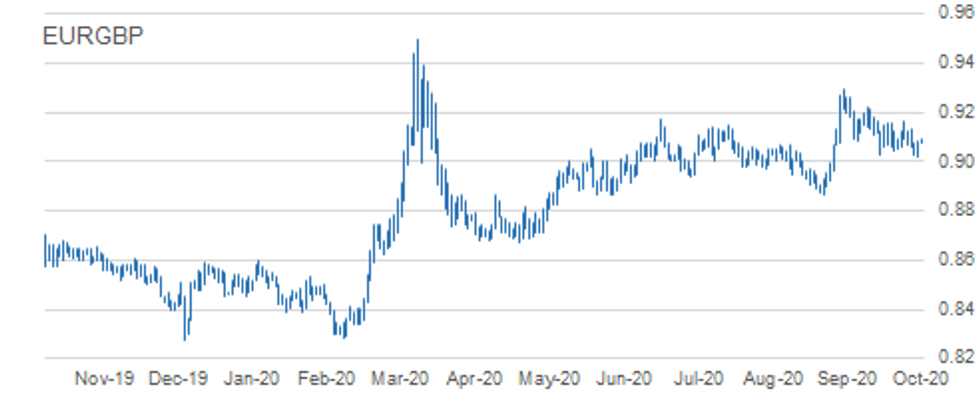
EURGBP traded lower Tuesday but did find support at the day low. Despite the bounce, the outlook remains bearish. The recent inability to hold above trendline resistance drawn off the Sep 11 high weighs on the cross. Key support at 0.9025, Sep 28 low has been probed this week. A clear break would confirm a resumption of bearish trending conditions and open 0.8967, a retracement level. On the upside, firm resistance is at 0.9162, Oct 7 high.
USD/JPY: Pullbacks Considered A Correction
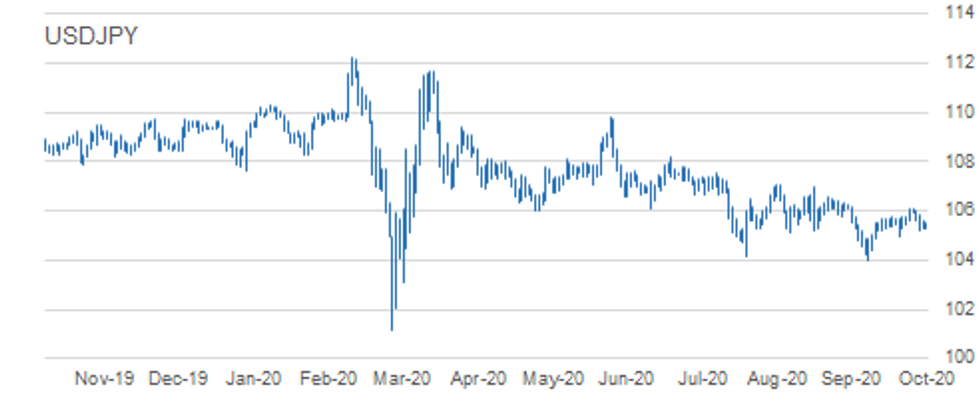
- RES 4: 106.62 Bear channel resistance drawn off the Mar 24 high
- RES 3: 106.55 High Sep 3
- RES 2: 106.11/38 High Oct 7 and the bull trigger / High Sep 8
- RES 1: 105.85 High Oct 12
- PRICE: 105.44 @ 06:00 BST Oct 14
- SUP 1: 105.24 Low Oct 12
- SUP 2: 104.94 Low Oct 2 and key near-term support
- SUP 3: 104.41 Low Sep 22
- SUP 4: 104.00 Low Sep 21 and the bear trigger
USDJPY started this week on a softer note having found resistance last week at 106.11, Oct 7 low. Short-term weakness however is considered a correction following recent gains. Intraday momentum studies still point south however to strengthen a bearish theme price needs to trade below key support at 104.94, Oct 2 low. This would open 104.00, Sep 21 low. The bull trigger is at 106.11. A break resumes the recent uptrend.
EUR/JPY: Extends This Week's Sell-Off
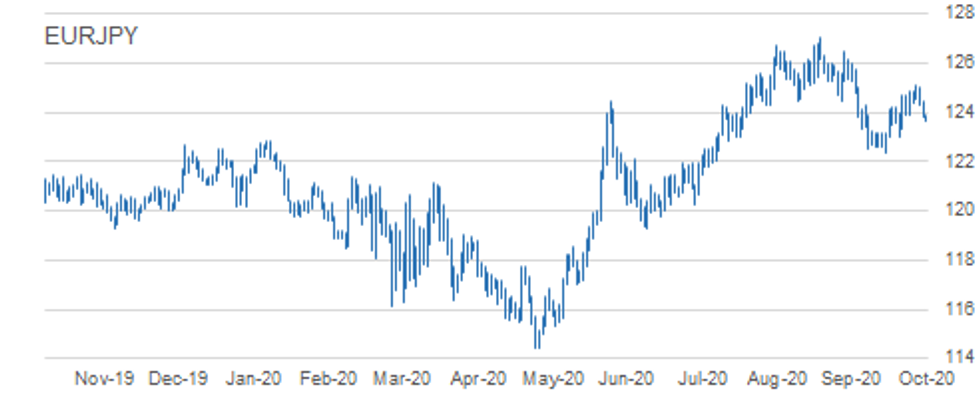
- RES 4: 126.46 High Sep 10 and a key resistance
- RES 3: 125.77 High Sep 15
- RES 2: 125.09/28 High Oct 9 / 61.8% of the Sep 1 - 28 sell-off
- RES 1: 124.48 High Oct 13
- PRICE: 123.79 @ 06:08 BST Oct 14
- SUP 1: 123.31 Low Oct 5
- SUP 2: 123.03 Low Sep 29 and Oct 2 and key near-term support
- SUP 3: 122.38/28 Low Sep 28 / 61.8% of the Jun 22 - Sep 1 rally
- SUP 4: 122.25 38.2% retracement of the May - Sep rally
EURJPY is off recent highs and traded lower again Tuesday. While near term weakness is considered a correction, attention turns to support at 123.03, Oct 6 low with the former support at 123.86, Oct 6 low breached. The move below 123.86 strengthens the intraday bearish tone and clearance of 123.03 would highlight scope for a deeper pullback. Resistance has been defined at 125.09, Oct 9 high. A break is required to resume recent bullish pressure.
AUD/USD: Pulls Away From Trendline Resistance
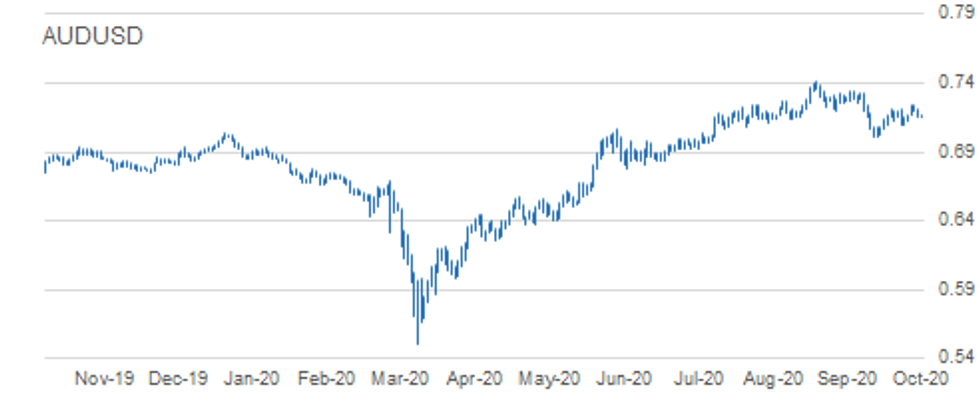
- RES 4: 0.7318 High Sep 21
- RES 3: 0.7258 61.8% retracement September Sell-Off
- RES 2: 0.7243 High Oct 10 and the intraday bull trigger
- RES 1: 0.7220 Trendline resistance drawn off the Sep 1 high
- PRICE: 0.7168 @ 06:13 BST Oct 14
- SUP 1: 0.7150 Low Oct 13
- SUP 2: 0.7096 Low Oct 7 and the near-term bear trigger
- SUP 3: 0.7070 Low Sep 29
- SUP 4: 0.7006 Low Sep 25 and the bear trigger
AUDUSD rallied Friday clearing resistance at 0.7209, Oct 1 and 6 high. This brought the pair into contact with trendline resistance drawn off the Sep 1 high. The line intersects at 0.7220 today. A move above Friday's high of 0.7243 would confirm a breach of the line and reinforce S/T bullish conditions, opening 0.7258, a Fibonacci retracement. Tuesday's print below support at 0.7161, Sep 9 low however signals a failure at the trendline.
USD/CAD: Outlook Still Bearish
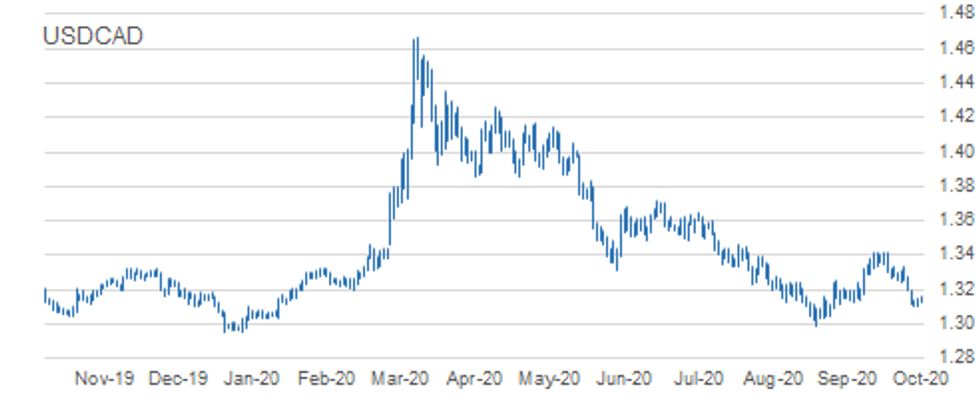
- RES 4: 1.3341 High Oct 7 and a reversal trigger
- RES 3: 1.3273 High Oct 7 and 50-day EMA
- RES 2: 1.3233 20-day EMA
- RES 1: 1.3202 Oct 9 high
- PRICE: 1.3140 @ 06:18 BST Oct 14
- SUP 1: 1.3099 Low Oct 13
- SUP 2: 1.3095 76.4% retracement of the Sep 1 - 30 rally
- SUP 3: 1.3038 Low Sep 2
- SUP 4: 1.2994 Low Sep 1
USDCAD edged lower again Tuesday, extending the pullback that started on Sep 30. The pair did however find support at the day low. Despite the bounce, the outlook remains bearish. Recent weakness follows the clear break on Oct 8 of trendline support drawn off the Sep 1 low. 1.3157, a Fibonacci retracement has been cleared paving the way for a move towards 1.3095. Initial resistance is at Friday's high of 1.3202. Heavy!
EUR/USD: MNI Key Levels
- *$1.1882 Sep16 high
- *$1.1872/74/81 Sep21 high/Cloud top/Upper 1.0% 10-dma env
- *$1.1856/65 100-mma/Upper Boll Band (2%)
- *$1.1817/27/31 Oct13 high/Oct12 high/Oct09 high
- *$1.1785/99/00 100-hma/50-dma/55-dma
- *$1.1769 200-hma
- *$1.1748/51/56 21-dma/Intraday high/Oct09 low
- *$1.1746 ***CURRENT MARKET PRICE 05:16BST WEDNESDAY***
- *$1.1735/31 Intraday low/Oct13 low
- *$1.1725/22 Oct07 low/50% 1.1612-1.1831
- *$1.1696/85 Oct02 low, 61.8% 1.1612-1.1831/Sep30 low, Sep25 high
- *$1.1664/61/46 76.4% 1.1612-1.1831/Sep29 low/Lower 1.0% 10-dma env
- *$1.1625/12 Lower Boll Band (2%)/Sep25 low
- *$1.1598/91 Cloud base/100-dma
- *$1.1581/65 Jul24 low/Lower Boll Band (3%)
GBP/USD: MNI Key Levels
- *$1.3084 Upper Bollinger Band (2%)
- *$1.3072/81/83 Oct13 high/Upper 1.0% 10-dma env/Oct12 high
- *$1.3023/29 50-dma/55-dma
- *$1.3007 Oct06 high, Sep16 high
- *$1.2992/06 100-hma/Oct12 low
- *$1.2962 200-hma
- *$1.2940/44/50 200-wma/Intraday high/50-mma
- *$1.2937 ***CURRENT MARKET PRICE 05:29BST WEDNESDAY***
- *$1.2921 Intraday low
- *$1.2893/92 21-dma/Oct08 low
- *$1.2880/67 50% 1.2676-1.3083/Cloud base
- *$1.2846/38/31 Oct07 low/Oct02 low/61.8% 1.2676-1.3083
- *$1.2824/22/20 100-dma/Lower 1.0% 10-dma env/Oct01 low
- *$1.2806 Sep30 low*$1.2781/72 Sep24 high/76.4% 1.2676-1.3083
EUR/GBP: MNI Key Levels
- *Gbp0.9220 Sep22 high
- *Gbp0.9200 Upper Bollinger Band (2%)
- *Gbp0.9173/81 Upper 1.0% 10-dma env/Sep24 high
- *Gbp0.9156/57/62 Oct01 high/Sep30 high/Oct07 high
- *Gbp0.9132 Oct09 high
- *Gbp0.9112/23 21-dma/Oct08 high
- *Gbp0.9081/83/85 200-hma/Intraday high/Oct13 high
- *Gbp0.9078 ***CURRENT MARKET PRICE 05:36BST WEDNESDAY***
- *Gbp0.9074/72/61 Intraday low/100-hma/50-dma
- *Gbp0.9058 55-dma
- *Gbp0.9038/24 100-dma/Lower Boll Band (2%)
- *Gbp0.9021/20 Cloud top/Oct13 low
- *Gbp0.8991/80 Lower 1.0% 10-dma env/Lower Boll Band (3%)
- *Gbp0.8969/67 Cloud base/Sep08 low
- *Gbp0.8925 Sep07 low
USD/JPY: MNI Key Levels
- *Y106.04 Oct09 high
- *Y105.85 Oct12 high
- *Y105.78 50-dma
- *Y105.76 55-dma
- *Y105.64 100-hma, 200-hma
- *Y105.63 Oct13 high
- *Y105.52/53 Intraday high/Cloud Tenkan Sen
- *Y105.43 ***CURRENT MARKET PRICE 05:42BST WEDNESDAY***
- *Y105.38/31/28 21-dma/Intraday low/Oct13 low
- *Y105.24 Oct12 low
- *Y105.20 Aug28 low
- *Y105.15 Cloud Kijun Sen
- *Y105.10 Aug19 low
- *Y105.08 Sep22 high
- *Y104.94 Oct02 low
EUR/JPY: MNI Key Levels
- *Y124.80 55-dma
- *Y124.79 50-mma
- *Y124.50 100-hma
- *Y124.48 Oct13 high
- *Y124.42 Cloud Kijun Sen
- *Y124.33 200-hma
- *Y123.94/06 Intraday high/Cloud Tenkan Sen
- *Y123.84 ***CURRENT MARKET PRICE 05:55BST WEDNESDAY***
- *Y123.81 21-dma
- *Y123.64 Intraday low
- *Y123.57 Cloud base
- *Y123.35 100-dma
- *Y123.31 Oct05 low
- *Y123.03 Oct02 low, Sep29 low
- *Y122.99 Lower 1.0% 10-dma envelope
AUD/USD: MNI Key Levels
- *$0.7286 Cloud top
- *$0.7263 50-mma
- *$0.7245/54 200-wma/Sep17 low
- *$0.7235/43 Sep22 high, Oct12 high/Upper 1.0% 10-dma env, Oct09 high
- *$0.7209/18 50-dma/Oct13 high
- *$0.7191/05 100-hma/55-dma
- *$0.7173/74 200-hma/Intraday high
- *$0.7169 ***CURRENT MARKET PRICE 06:01BST WEDNESDAY***
- *$0.7168/53 21-dma/Intraday low
- *$0.7150 Oct13 low
- *$0.7124/23 Cloud base/Oct08 low
- *$0.7099/96/89 Lower 1.0% 10-dma env/Oct07 low/100-dma
- *$0.7070 Sep29 low
- *$0.7029/28 Sep28 low/Lower 2.0% 10-dma env
- *$0.7013/06 Lower Boll Band (2%)/Sep25 low
USD/CAD: MNI Key Levels
- *C$1.3341/46/50 Oct07 high/Upper 1.0% 10-dma env/Cloud top
- *C$1.3262/73 21-dma/Oct08 high
- *C$1.3242 Oct06 low
- *C$1.3217/18/31 50-dma/200-hma/55-dma
- *C$1.3202 Oct09 high
- *C$1.3163/75 200-wma/50-mma
- *C$1.3151/58/62 100-hma/Intraday high/Cloud base
- *C$1.3140 ***CURRENT MARKET PRICE 06:04BST WEDNESDAY***
- *C$1.3132 Intraday low
- *C$1.3099/87 Oct13 low/Sep08 low
- *C$1.3082/78 Lower 1.0% 10-dma env/Lower Boll Band (2%)
- *C$1.3038 Sep02 low
- *C$1.2994/84 Sep01 low/Lower Boll Band (3%)
- *C$1.2976 YTD low
- *C$1.2952/50 Dec31-2019 low/Lower 2.0% 10-dma env
Why MNI
MNI is the leading provider
of intelligence and analysis on the Global Fixed Income, Foreign Exchange and Energy markets. We use an innovative combination of real-time analysis, deep fundamental research and journalism to provide unique and actionable insights for traders and investors. Our "All signal, no noise" approach drives an intelligence service that is succinct and timely, which is highly regarded by our time constrained client base.Our Head Office is in London with offices in Chicago, Washington and Beijing, as well as an on the ground presence in other major financial centres across the world.