
Why MNI
MNI is the leading provider
of intelligence and analysis on the Global Fixed Income, Foreign Exchange and Energy markets. We use an innovative combination of real-time analysis, deep fundamental research and journalism to provide unique and actionable insights for traders and investors. Our "All signal, no noise" approach drives an intelligence service that is succinct and timely, which is highly regarded by our time constrained client base.Our Head Office is in London with offices in Chicago, Washington and Beijing, as well as an on the ground presence in other major financial centres across the world.
FOREX: AUD Climbs, Ignores RBA Comments
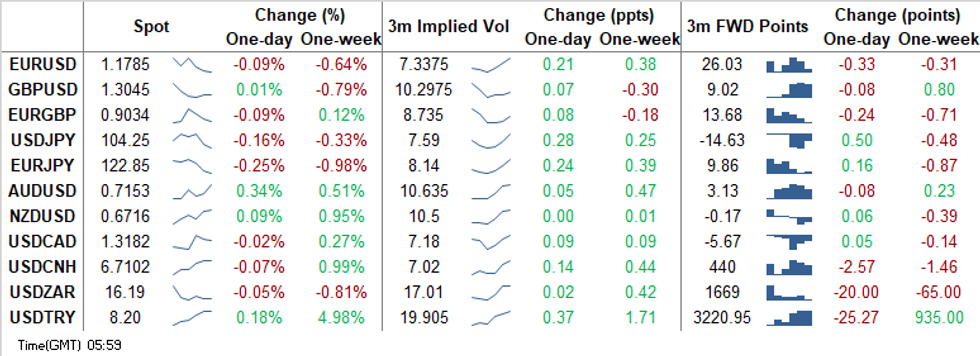
AUD climbed at a steady pace, with neither in-line to marginally above-forecast Australian CPI figures nor comments from RBA's Harper altering its trajectory in any meaningful way. Harper told the WSJ that the RBA has firepower to add monetary stimulus if needed, but his comments didn't really move the needle. Cross-flows may have bolstered broader AUD strength, as decent demand for AUD/NZD allowed it to return above the support area from 38.2% Fibo retracement of YtD range/200-DMA breached yesterday.
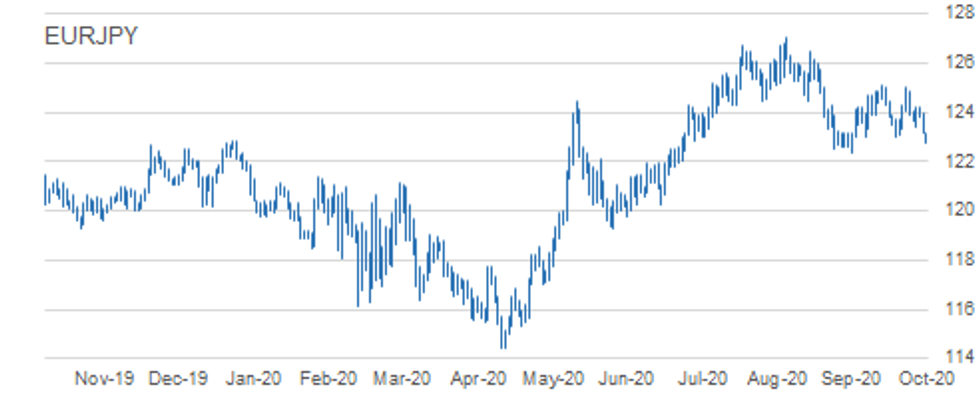
- JPY rallied amid lingering concerns over spiralling coronavirus case counts in Europe and upcoming security briefing from the FBI & U.S. DoJ. The Eurozone's shared currency was dented by regional Covid-19 situation and landed at the bottom of the G10 pile. EUR/JPY sank through key support zone at Y123.03/02, charting a double top pattern.
- NOK was among the worst performers in G10 FX space, as oil extended yesterday's losses registered after the release of the latest API report, which revealed a larger than expected increase in U.S. crude stockpiles.
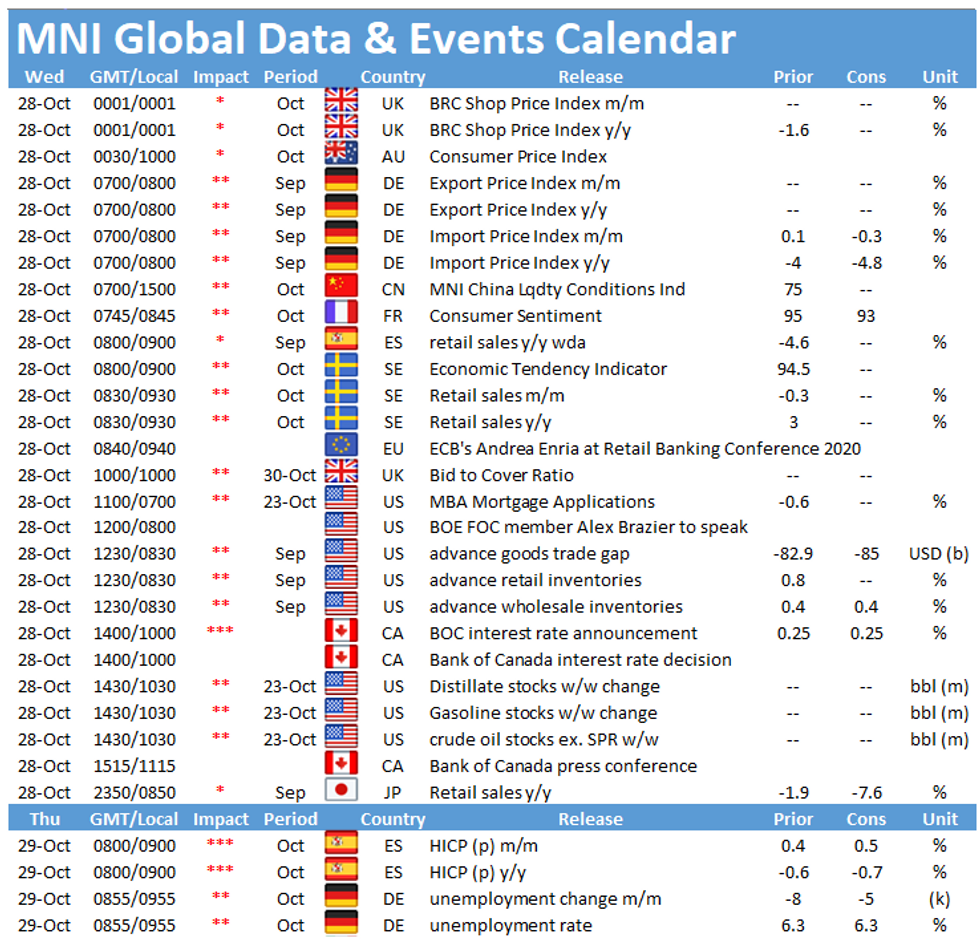
- Focus turns to BoC MonPol decision, French consumer confidence, Spanish & Swedish retail sales, flash U.S. wholesale inventories as well as comments from Fed's Kaplan, BoC's Macklem & ECB's de Cos.
MNI FX TECHNICALS
EUR/USD: Attention Turns To Trendline Support
- RES 4: 1.1917 Sep 10 high / 76.4% of the Sep 1 - 25 sell-off
- RES 3: 1.1909 1.0% 10-dma envelope
- RES 2: 1.1881 High Oct 21 and the bull trigger
- RES 1: 1.1839 High Oct 27
- PRICE: 1.1782 @ 05:49 GMT Oct 28
- SUP 1: 1.1770 Intraday low
- SUP 2: 1.1751 50-day EMA
- SUP 3: 1.1740 Trendline support drawn off the Sep 28 low
- SUP 4: 1.1689 Low Oct 15 and a key support
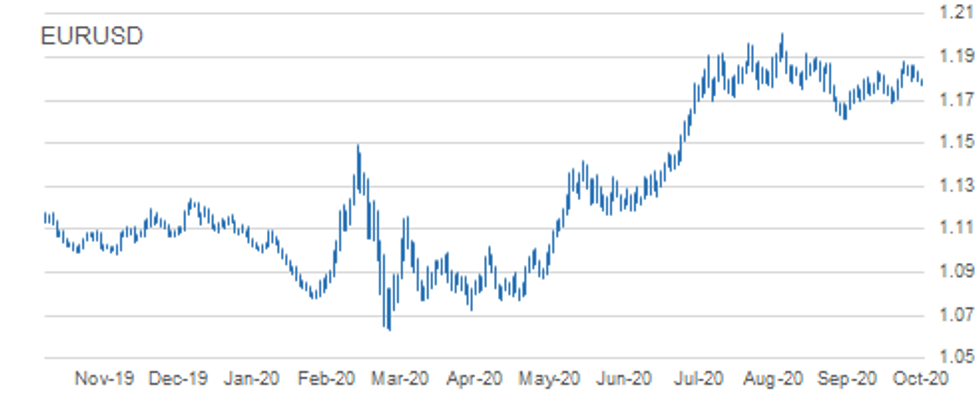
EURUSD is still trading below last week's high of 1.1881 and has again extended the pullback from this level, with price lower overnight. Attention turns to the key near-term trendline support drawn off the Sep 28 low that today intersects at 1.1740. While the trendline holds, the uptrend since 1.1612, Sep 25 low remains intact. A break would undermine the bullish tone and expose 1.1689, Oct 15 low. The near-term bull trigger is at 1.1911.
GBP/USD: Holding Above Monday's Low
- RES 4: 1.3267 2.0% 10-dma envelope
- RES 3: 1.3257 Former trendline support drawn off the Mar 20 low
- RES 2: 1.3177 High Oct 21 and the bull trigger
- RES 1: 1.3122 High Oct 23
- PRICE: 1.3042 @ 06:00 GMT Oct 28
- SUP 1: 1.2993/89 Low Oct 26 / 20-day EMA
- SUP 2: 1.2940 Low Oct 21
- SUP 3: 1.2863 Low Oct 14 and key near-term support
- SUP 4: 1.2806 Low Sep 30
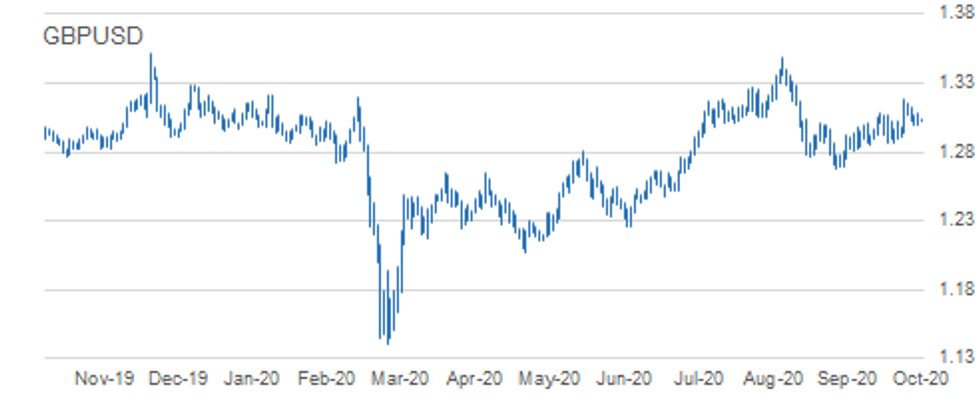
GBP/USD is holding above Monday's low of 1.2993, a key intraday support. An extension higher would suggest the recent corrective pullback is over. S/T bullish conditions still dominate. The Oct 21 rally reinforced a bullish theme, confirming a resumption of the upleg since Sep 23. A break of 1.3177, Oct 21 high would open 1.3269, former trendline support drawn off the Mar 20 low. Sub 1.2993 levels though would resume the recent corrective pullback.
EUR/GBP: Eyeing Key Support
- RES 4: 0.9220 High Sep 22
- RES 3: 0.9160/62 1.0% 10-dma envelope / High Oct 7
- RES 2: 0.9149 Oct 20 high
- RES 1: 0.9107 High Oct 23
- PRICE: 0.9032 @ 06:03 GMT Oct 28
- SUP 1: 0.9012 Low Oct 21
- SUP 2: 0.9007 Low Oct 14 and the bear trigger
- SUP 3: 0.8967 76.4% retracement of the Sep 3 - 11 rally
- SUP 4: 0.8925 Low Sep 7
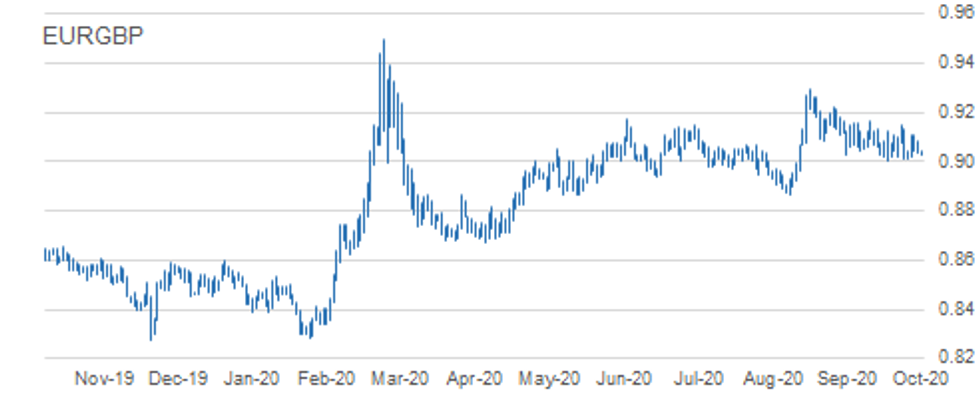
EURGBP maintains a choppy tone. The outlook remains bearish though following the sharp sell-off on Oct 21. Attention is on support at 0.9007, Oct 14 low and the near-term bear trigger. A break of 0.9007 would confirm a resumption of the downtrend that started Sep 11 and expose 0.8967, a retracement point. Key S/T resistance has been defined at 0.9149, Oct 20 high. Clearance of this level would undermine bearish conditions.
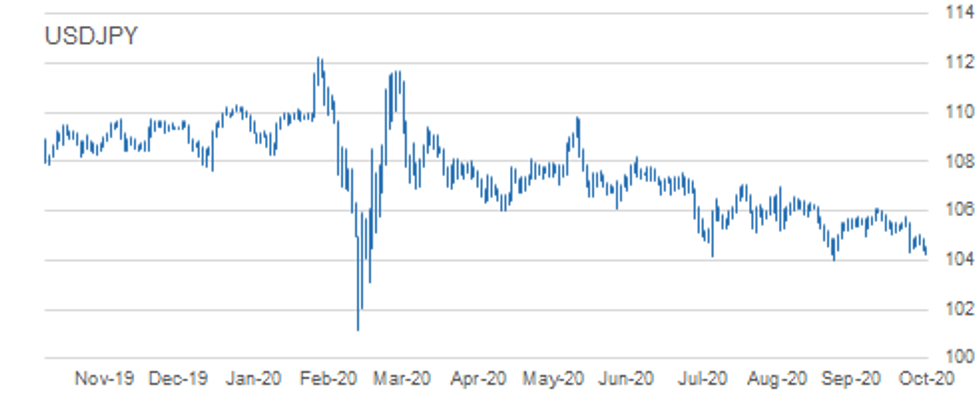
USD/JPY: Approaching Key Support
- RES 4: 105.75 High Oct 20
- RES 3: 105.53/60 High Oct 21 / 50-dma
- RES 2: 105.06 High Oct 26 and key near-term resistance
- RES 1: 104.56 Intraday high
- PRICE: 104.24 @ 06:11 GMT Oct 28
- SUP 1: 104.00 Low Sep 21 and the bear trigger
- SUP 2: 103.67 76.4% retracement of the Mar 9 - 24 rally
- SUP 3: 103.09 Low Mar 12
- SUP 4: 102.02 Low Mar 10
USDJPY has started today's session on a softer note, extending the recent decline overnight. The outlook is bearish following the Oct 21 sell-off marking a resumption of the downleg from 106.11, Oct 7 high. A number of important supports have been cleared exposing the key 104.00 handle, Sep 21 low. A break of 104.00 would suggest scope for a deeper USD depreciation within the bear channel drawn off the Mar 24 high. Firm resistance is at 105.06.
EUR/JPY: Through Key Near-Term Support
- RES 4: 125.28 61.8% of the Sep 1 - 28 sell-off
- RES 3: 125.00/09 High Oct 20 and Oct 9
- RES 2: 124.23 High Oct 23 and 26
- RES 1: 123.98 20-day EMA
- PRICE: 122.83 @ 06:20 GMT Oct 28
- SUP 1: 122.74 Intraday low
- SUP 2: 122.38/28 Low Sep 28 / 61.8% of the Jun 22 - Sep 1 rally
- SUP 3: 122.25 38.2% retracement of the May - Sep rally
- SUP 4: 121.82 Low Jul 15 / 16
EURJPY has cleared support at 123.03/02, low prints between Sep 29 and Oct 15. The break of this support undermines the recent bullish outlook and instead signals scope for a deeper sell-off towards 122.38, Sep 28 low and the bear trigger. The recent failure at 125.09 and 125.00, Oct 9 and 20 highs respectively, weigh on the pair. To strengthen a bullish argument, price needs to clear key resistance at 124.23, Oct 23 / 26 high.
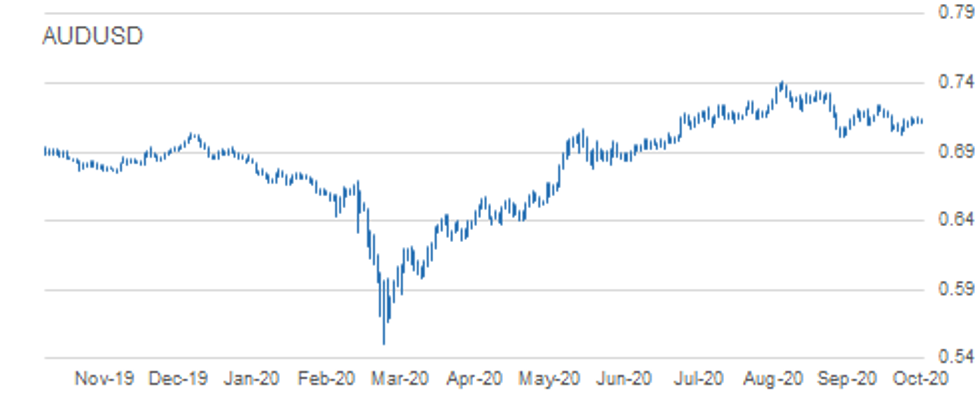
AUD/USD: Facing Its Trendline Resistance
- RES 4: 0.7324 High Sep 21
- RES 3: 0.7258 61.8% retracement of the Sep 1 - 25 decline
- RES 2: 0.7243 High Oct 10 and a key resistance
- RES 1: 0.7157/58 Trendline drawn off the Sep 1 high / High Oct 23
- PRICE: 0.7154 @ 06:29 GMT Oct 28
- SUP 1: 0.7085 Low Oct 22
- SUP 2: 0.7021 Low Oct 20
- SUP 3: 0.7006 Low Sep 25 and the bear trigger
- SUP 4: 0.6965 23.6% retracement of the Mar - Sep rally
AUDUSD outlook is bearish although the pair is holding onto recent gains and has traded higher overnight. The Aussie continues to trade below trendline resistance drawn off the Sep 1 high. The line intersects at 0.7157 and represents a key resistance. A break would signal a trend reversal and open 0.7243, Oct 10 high. While the trendline holds, a bearish theme remains intact with attention on key support and bear trigger at 0.7006, Sep 25 low.
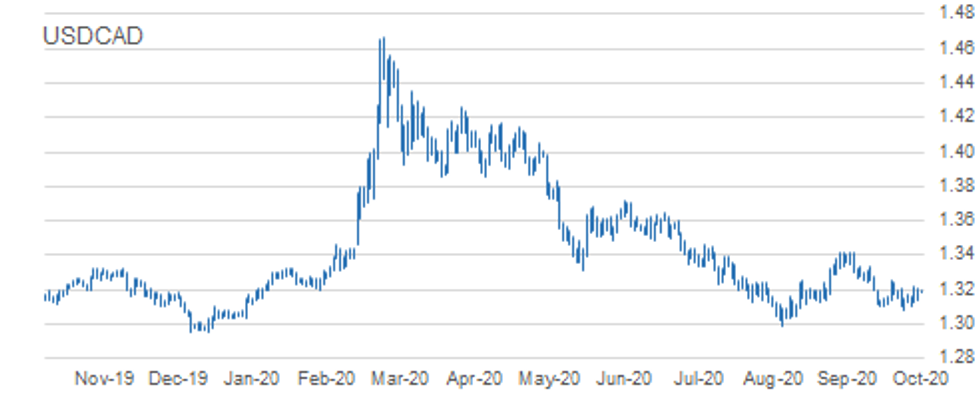
USD/CAD: Trading Below Key Near-Term Resistance
- RES 4: 1.3421 High Sep 30 and primary resistance
- RES 3: 1.3341 High Oct 7
- RES 2: 1.3238/59 50-day EMA / High Oct 15 and the bull trigger
- RES 1: 1.3225 High Oct 26
- PRICE: 1.3185 @ 06:32 GMT Oct 28
- SUP 1: 1.3109/3081 Low Oct 23 / Low Oct 21 and the bear trigger
- SUP 2: 1.3047 Low Sep 7
- SUP 3: 1.3038 Low Sep 2
- SUP 4: 1.2994 Low Sep 1 and the major support
USDCAD started the week on a firm note, rallying Monday. Despite recent gains, the outlook remains bearish though. The pair last week breached key support at 1.3099, Oct 13 low. The move lower confirmed a resumption of the current downtrend that started Sep 30. Moving average studies are bearish too, reinforcing current conditions. Scope exists for weakness towards the major support at 1.2994, Sep 1 low. Key resistance is at 1.3259, Oct 15 high.
MNI KEY LEVELS
EUR/USD: MNI Key Levels
- $1.1900/12 Sep15 high/Upper 1.0% 10-dma env
- $1.1870/81/82 Upper Boll Band (2%)/Oct21 high/Sep16 high
- $1.1856/61/67 100-mma/Oct26 high/Oct22 high
- $1.1839 Oct27 high
- $1.1822/28 100-hma/Cloud top
- $1.1805 200-hma(Expiries 1.1800-05 E1.8bln)
- $1.1793/98/99 50-dma/Intraday high/55-dma
- $1.1778 ***CURRENT MARKET PRICE 05:18BST WEDNESDAY***
- $1.1776/70 21-dma/Intraday low
- $1.1762/60 61.8% 1.1689-1.1881/Oct20 low
- $1.1738/34 Rising trend Sep25/76.4% 1.1689-1.1881
- $1.1689/87/85 Oct15 low/Lower Boll Band (2%)/Sep30 low, Sep25 high
- $1.1676 Lower 1.0% 10-dma envelope
- $1.1661/55/47 Sep29 low/Cloud base/100-dma
- $1.1641 Lower Bollinger Band (3%)
GBP/USD: MNI Key Levels
- $1.3204 Upper Bollinger Band (3%)
- $1.3177 Oct21 high
- $1.3153 Oct22 high
- $1.3140 Upper 1.0% 10-dma envelope
- $1.3122/31 Oct23 high/Upper Boll Band (2%)
- $1.3080 Oct27 high
- $1.3045/52 Intraday high/100-hma
- $1.3043 ***CURRENT MARKET PRICE 05:24BST WEDNESDAY***
- $1.3021/19/17 Intraday low/200-hma/55-dma
- $1.3007/01 50-dma/Oct27 low
- $1.2993/85 Oct26 low/Cloud top
- $1.2982/81/79 21-dma/Cloud base/Oct20 high
- $1.2952/47 50-mma/200-wma
- $1.2940 Oct21 low
- $1.2911 Oct20 low
EUR/GBP: MNI Key Levels
- Gbp0.9162/67 Oct07 high/Upper Boll Band (3%)
- Gbp0.9149/56/57 Oct20 high/Upper 1.0% 10-dma env/Sep30 high
- Gbp0.9131/35/37 Cloud top/Upper Boll Band (2%)/Oct21 high
- Gbp0.9106/07 Oct26 high/Oct23 high
- Gbp0.9079/85 Cloud base/Oct27 high
- Gbp0.9065/67/72 55-dma/200-hma, 50-dma/21-dma
- Gbp0.9047/51/58 Intraday high/100-dma/100-hma
- Gbp0.9029 ***CURRENT MARKET PRICE 05:30BST WEDNESDAY***
- Gbp0.9028/21 Intraday low/Oct23 low
- Gbp0.9012/08/07 Oct21 low/Lower Boll Band (2%)/Oct14 low
- Gbp0.8976/75 Lower Boll Band (3%)/Lower 1.0% 10-dma env
- Gbp0.8967 Sep08 low
- Gbp0.8925 Sep07 low
- Gbp0.8900/99 Sep04 low/200-dma
- Gbp0.8884 Lower 2.0% 10-dma envelope
USD/JPY: MNI Key Levels
- Y105.16 Cloud Kijun Sen
- Y105.06 Oct26 high
- Y104.98 200-hma, Cloud Tenkan Sen
- Y104.89 Oct27 high
- Y104.71 100-hma
- Y104.56 Intraday high
- Y104.27 Lower Bollinger Band (2%)
- Y104.27 ***CURRENT MARKET PRICE 05:37BST WEDNESDAY***
- Y104.21 Intraday low
- Y104.00 YTD low
- Y103.94 200-mma
- Y103.90 Lower 1.0% 10-dma envelope
- Y103.78 Lower Bollinger Band (3%)
- Y103.09 Mar12 low
- Y102.85 Lower 2.0% 10-dma envelope
EUR/JPY: MNI Key Levels
- Y123.87 Cloud Tenkan Sen
- Y123.80 100-hma
- Y123.74 Cloud Kijun Sen
- Y123.56 100-dma
- Y123.41 Oct23 low
- Y123.19 Intraday high
- Y122.86 Lower Bollinger Band (2%)
- Y122.85 ***CURRENT MARKET PRICE 05:47BST WEDNESDAY***
- Y122.74 Intraday low
- Y122.54 Lower 1.0% 10-dma envelope
- Y122.38 Sep28 low
- Y122.29 Lower Bollinger Band (3%)
- Y122.06 Jul20 low
- Y121.85 100-wma
- Y121.82 Jul15 low, Jul16 low
AUD/USD: MNI Key Levels
- $0.7254/63 Sep17 low/50-mma, Cloud top
- $0.7243/44/50 Oct09 high/200-wma/Upper 2.0% 10-dma env
- $0.7233/35 Upper Boll Band (2%)/Sep22 high, Oct12 high
- $0.7218 Oct13 high
- $0.7191/94 Oct14 high/50-dma, 55-dma
- $0.7168/70/79 Cloud base/Oct15 high/Upper 1.0% 10-dma env
- $0.7157/58 Intraday high/Oct23 high/61.8%0.7243-0.7021
- $0.7157 ***CURRENT MARKET PRICE 05:51BST WEDNESDAY***
- $0.7146/40 Oct26 high/21-dma
- $0.7125/13/11 100-hma/Intraday low/100-dma
- $0.7103/02 Oct26 low/200-hma
- $0.7085 Oct22 low
- $0.7047/45/37 Oct21 low/Lower Boll Band (2%)/Lower 1.0% 10-dma env
- $0.7021/06 Oct20 low/Sep25 low
- $0.6998 Lower Bollinger Band (3%)
USD/CAD: MNI Key Levels
- C$1.3341/52 Oct07 high/Sep29 low
- C$1.3320/21/35 Cloud top/Upper Boll Band (2%)/100-dma
- C$1.3304 Upper 1.0% 10-dma envelope
- C$1.3259/73 Oct15 high/Oct08 high
- C$1.3225/38 Oct26 high/Oct16 high
- C$1.3201/12 Cloud base/Oct27 high
- C$1.3198/99/00 50-dma/21-dma/Intraday high, 55-dma
- C$1.3183 ***CURRENT MARKET PRICE 05:56BST WEDNESDAY***
- C$1.3180/76 Intraday low/50-mma
- C$1.3164/60 200-hma, 100-hma/200-wma
- C$1.3142 Oct27 low
- C$1.3126/24 Oct26 low/Oct22 low
- C$1.3109 Oct23 low
- C$1.3081 Oct21 low
- C$1.3065 Lower Bollinger Band (2%)
OPTIONS: Expiries for Oct28 NY cut 1000ET (Source DTCC)
- EUR/USD: $1.1650-55(E521mln), $1.1675-78(E516mln), $1.1745-60(E1.3bln), $1.1780-85(E703mln),
$1.1800-05(E1.8bln), $1.1830(E555mln), $1.1850-65(E832mln), $1.1870-75(E553mln), $1.1900(E958mln), $1.1950(E806mln) - USD/JPY: Y103.00($764mln), Y103.50($519mln), Y103.90-00($607mln), Y104.50($822mln), Y104.70-80($771mln), Y104.85-00($3.0bln), Y105.10-15($541mln), Y105.25-30($1.2bln), Y105.40($810mln)
- GBP/USD: $1.3100(Gbp779mln)
- EUR/GBP: Gbp0.9085-00(E1.1bln)
- EUR/JPY: Y122.85(E843mln)
- AUD/NZD: N$1.0800(A$685mln)
- USD/CAD: C$1.3550($500mln)
- USD/CNY: Cny6.68($550mln-USD puts)
Larger Options Pipeline
- EUR/USD: Oct30 $1.1750-54(E1.2bln), $1.1800(E2.0bln), $1.1850(E1.6bln), $1.1950(E1.7bln-EUR calls), $1.2000(E1.3bln); Nov03 $1.1900-05(E1.4bln)
- USD/JPY: Oct29 Y103.20-25($1.6bln-USD puts), Y104.00($1.6bln-USD puts), Y105.25($1.3bln), Y105.55-65($2.4bln), Y106.00($1.2bln); Oct30 Y104.00($1.2bln), Y104.50($2.3bln), Y104.80-85($1.4bln), Y104.95-105.00($1.1bln), Y106.00-05($2.2bln); Nov03 Y105.45-49($1.3bln); Nov04 Y105.00($1.1bln); Nov05 Y106.06-09($1.6bln)
- EUR/JPY: Nov05 Y124.50(E1.1bln)
- GBP/USD: Nov02 $1.3100(Gbp1.1bln), $1.3150(Gbp911mln)
- EUR/GBP: Nov02 Gbp0.8900(E1.8bln-EUR puts), Gbp0.9000(E1.1bln)
- AUD/USD: Oct30 $0.7180-00(A$1.4bln); Nov02 $0.7140-45(A$1.8bln)
- AUD/JPY: Oct29 Y73.20(A$1.0bln-AUD puts), Y76.35-40(A$2.4bln-AUD calls); Oct30 Y77.45(A$1.2bln)
- AUD/NZD: Oct30 N$1.0750(A$1.2bln)
- USD/CAD: Oct30 C$1.3025($1.1bln), C$1.3150($1.3bln)
- USD/CNY: Nov03 Cny6.5334($1.2bln); Nov05 Cny6.75($1.0bln), Cny6.80($1.9bln), Cny6.85($1.3bln)
Why MNI
MNI is the leading provider
of intelligence and analysis on the Global Fixed Income, Foreign Exchange and Energy markets. We use an innovative combination of real-time analysis, deep fundamental research and journalism to provide unique and actionable insights for traders and investors. Our "All signal, no noise" approach drives an intelligence service that is succinct and timely, which is highly regarded by our time constrained client base.Our Head Office is in London with offices in Chicago, Washington and Beijing, as well as an on the ground presence in other major financial centres across the world.