
Why MNI
MNI is the leading provider
of intelligence and analysis on the Global Fixed Income, Foreign Exchange and Energy markets. We use an innovative combination of real-time analysis, deep fundamental research and journalism to provide unique and actionable insights for traders and investors. Our "All signal, no noise" approach drives an intelligence service that is succinct and timely, which is highly regarded by our time constrained client base.Our Head Office is in London with offices in Chicago, Washington and Beijing, as well as an on the ground presence in other major financial centres across the world.
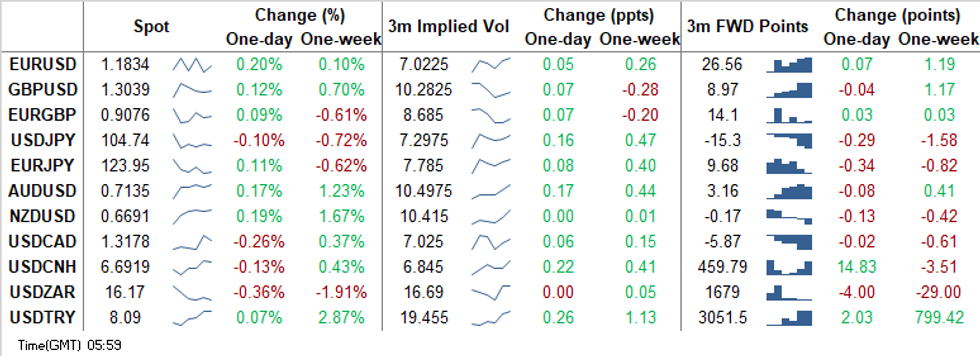
Greenback Slips In Asia. Regional FX Watch Data
The greenback went offered and landed at the bottom of G10 pile, as e-mini contracts ground higher, with little to change the broader state of play overnight. Commodity-tied FX garnered some modest strength, as the space seemed happy to slightly unwind yesterday's risk-off moves. Addresses from RBA's Debelle & Bullock provided nothing of real note.
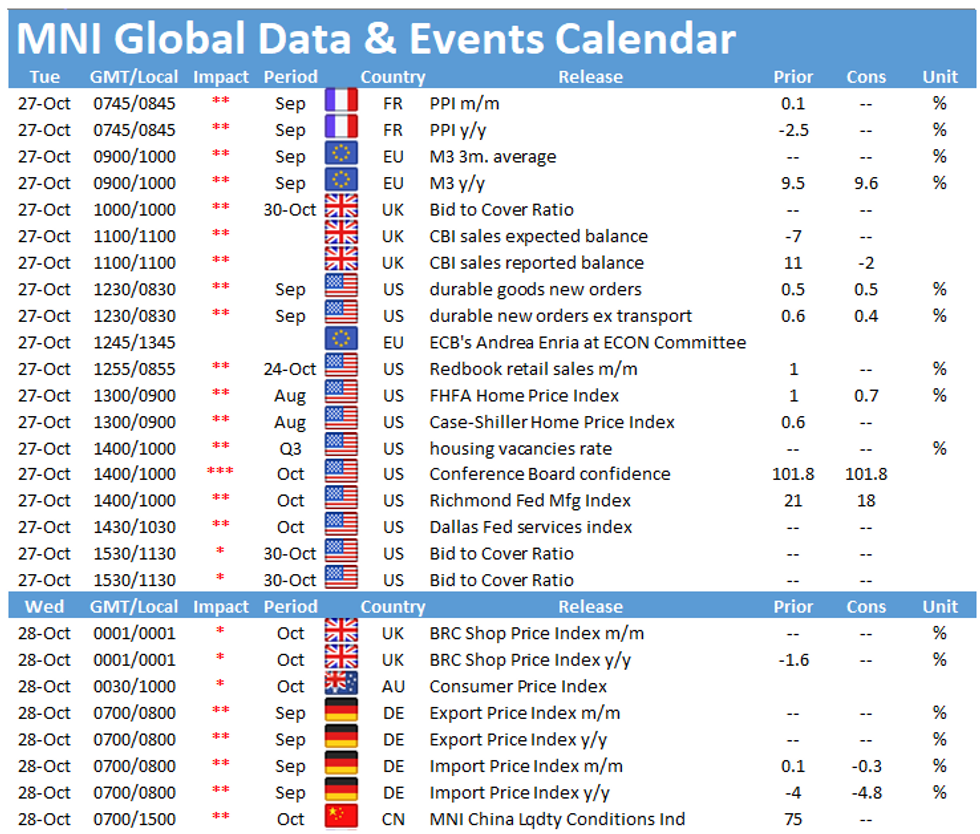
- USD/CNH popped higher as onshore markets re-opened, while China reported September industrial profits, which grew slower than in August, in Y/Y terms. The rate faded the move later in the session.
- USD/KRW re-opened on the front foot as South Korean Vice FinMin Kim warned that the gov't monitors FX markets and is ready to take stabilisation measures if needed. That being said, the pair gradually erased gains as local GDP data for Q3 showed that South Korean economy has returned into expansion at a higher rate than forecast.
- Coming up today we have U.S. Conf. Board Consumer Confidence & flash durable goods orders as well as comments from ECB's de Cos.
MNI FX Technicals:
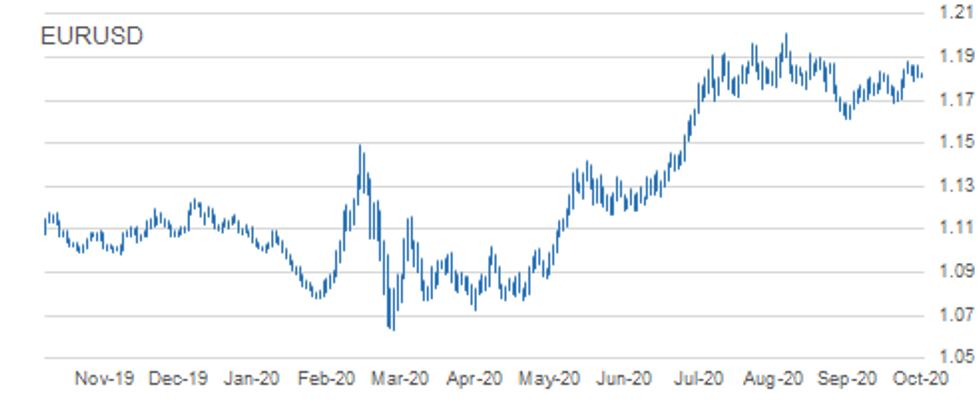
EUR/USD: Bullish Trend Structure Intact
- RES 4: 1.2011 High Sep and key resistance
- RES 3: 1.1917 Sep 10 high / 76.4% of the Sep 1 - 25 sell-off
- RES 2: 1.1904 1.0% 10-dma envelope
- RES 1: 1.1881 High Oct 21 and the bull trigger
- PRICE: 1.1831 @ 05:37 GMT Oct 27
- SUP 1: 1.1787/60 Low Oct 23 / Oct 20
- SUP 2: 1.1749 50-day EMA
- SUP 3: 1.1735 Trendline support drawn off the Sep 28 low
- SUP 4: 1.1689 Low Oct 15 and a key support
EURUSD is still trading below last week's high of 1.1881. Despite the recent shallow pullback, the outlook remains positive and the move lower is considered corrective. The recent breach of 1.1831, Oct 9 high reinforced the current bullish price structure and signals scope for 1.1917 next, a retracement level with the major resistance and hurdle for bulls at 1.2011, Sep 1 high. Key short-term trendline support is at 1.1735.
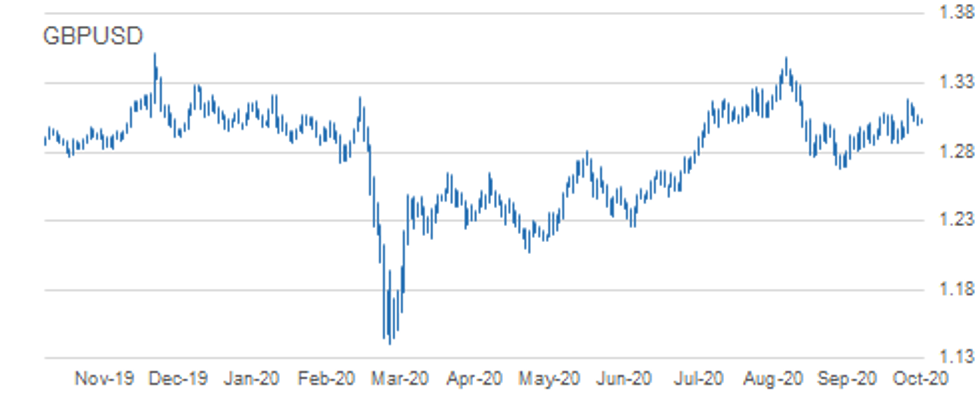
GBP/USD: Pullback Considered A Correction
- RES 4: 1.3292 76.4% retracement of the Sep 1 - 23 sell-off
- RES 3: 1.3256 2.0% 10-dma envelope
- RES 2: 1.3257 Former trendline support drawn off the Mar 20 low
- RES 1: 1.3177 High Oct 21
- PRICE: 1.3037 @ 05:43 GMT Oct 27
- SUP 1: 1.2983 20-day EMA
- SUP 2: 1.2940 Low Oct 21
- SUP 3: 1.2863 Low Oct 14 and key near-term support
- SUP 4: 1.2806 Low Sep 30
GBPUSD continued to retrace the Oct 21 rally yesterday. The move lower is likely a correction though with the S/T bullish structure intact. The Oct 21 climb reinforced a bullish theme, confirming a resumption of the upleg that started Sep 23. Attention is on 1.3257, the former trendline support drawn off the Mar 20 low. The trendline was breached on Sep 9. Firm support is at 1.2940, Oct 21 low. The reversal trigger lies at 1.2863, Oct 14 low.
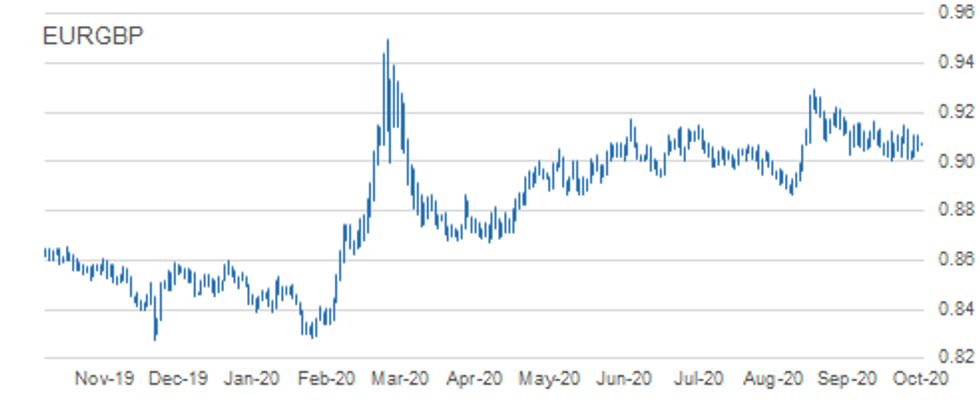
EUR/GBP: Choppy And Trading Above Support
- RES 4: 0.9220 High Sep 22
- RES 3: 0.9160/62 1.0% 10-dma envelope / High Oct 7
- RES 2: 0.9149 Oct 20 high
- RES 1: 0.9107 High Oct 23
- PRICE: 0.9076 @ 05:50 GMT Oct 27
- SUP 1: 0.9012 Low Oct 21
- SUP 2: 0.9007 Low Oct 14 and the bear trigger
- SUP 3: 0.8967 76.4% retracement of the Sep 3 - 11 rally
- SUP 4: 0.8925 Low Sep 7
EURGBP maintains a choppy tone. The outlook is still bearish though following the sharp sell-off on Oct 21. Attention is on support at 0.9007, Oct 14 low and the near-term bear trigger. A break of 0.9007 would confirm a resumption of the downtrend that started Sep 11 and expose 0.8967, a retracement point. Key S/T resistance has been defined at 0.9149, Oct 20 high. Clearance of this level would undermine bearish conditions.
USD/JPY: Consolidating But Outlook Remains Bearish
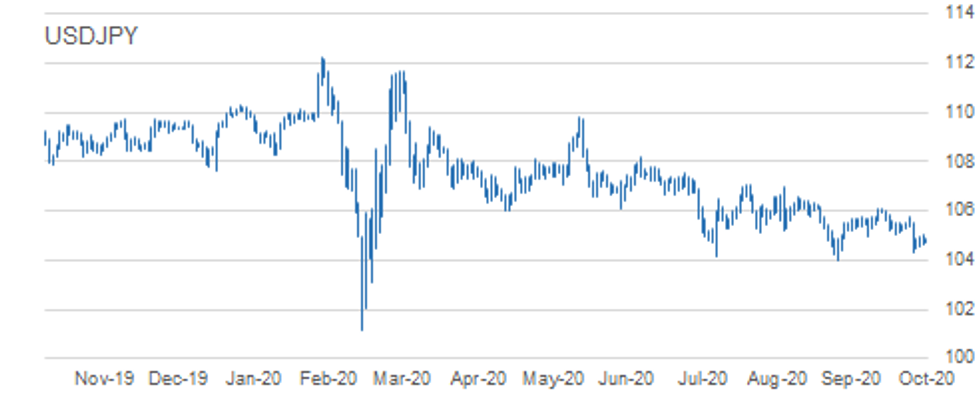
- RES 4: 106.11 High Oct 7 and key resistance
- RES 3: 105.75 High Oct 20
- RES 2: 105.53/60 High Oct 21 / 50-dma
- RES 1: 105.06 Yesterday's high
- PRICE: 104.73 @ 05:58 GMT Oct 27
- SUP 1: 104.34 Low Oct 21
- SUP 2: 104.00 Low Sep 21 and the bear trigger
- SUP 3: 103.67 76.4% retracement of the Mar 9 - 24 rally
- SUP 4: 103.09 Low Mar 12
USDJPY is unchanged and consolidating. The outlook remains bearish though following the Oct 21 sell-off and the resumption of the downleg from 106.11, Oct 7 high. A number of important supports have been cleared exposing the key 104.00 handle, Sep 21 low. A break of 104.00 would suggest scope for a deeper USD depreciation within the bear channel drawn off the Mar 24 high. Initial resistance is at 105.04.
EUR/JPY: Key near-Term Supports Remain Intact
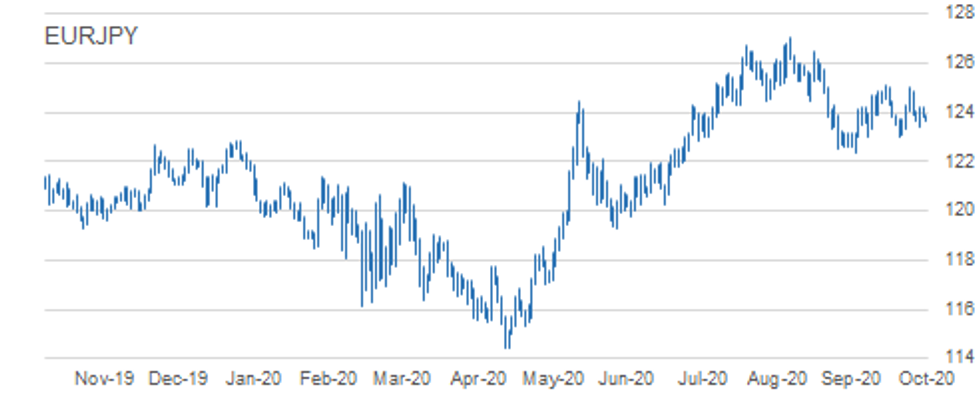
- RES 4: 125.97 76.4% retracement of the Sep 1 - 28 sell-off
- RES 3: 125.28 61.8% of the Sep 1 - 28 sell-off
- RES 2: 125.00/09 High Oct 20 and Oct 9
- RES 1: 124.23 High Oct 23 and 26
- PRICE: 123.94 @ 06:02 GMT Oct 27
- SUP 1: 123.41 Low Oct 23
- SUP 2: 123.03/02 Low Sep 29 and Oct 2 / Low Oct 15
- SUP 3: 122.38/28 Low Sep 28 / 61.8% of the Jun 22 - Sep 1 rally
- SUP 4: 122.25 38.2% retracement of the May - Sep rally
EURJPY is still trading below recent highs. Attention is on support at 123.03/02, low prints between Sep 29 and Oct 15. A break of this level would undermine the recent bullish outlook and instead signal scope for a deeper sell-off towards 122.38, Sep 28 low and the bear trigger. Moving average studies are in a neutral position. To strengthen a bullish argument, price needs to clear key resistance at 125.09, Oct 9 high.
AUD/USD: Focus Is On Trendline Resistance
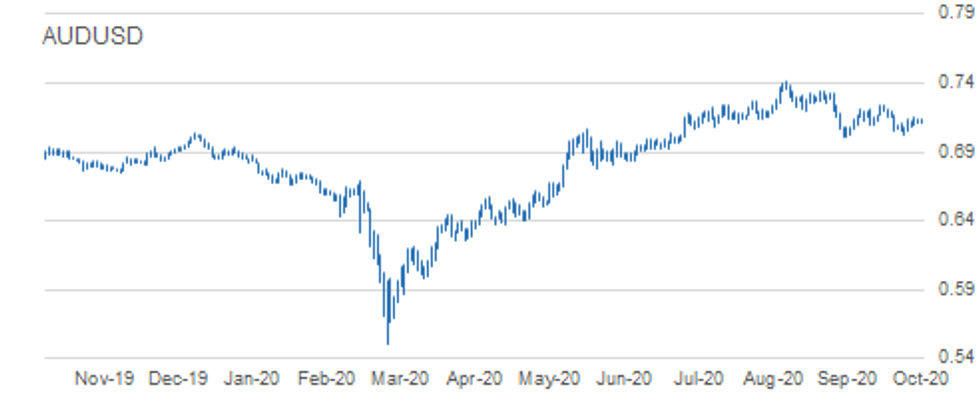
- RES 4: 0.7324 High Sep 21
- RES 3: 0.7243 High Oct 10 and the intraday bull trigger
- RES 2: 0.7163/70 Trendline drawn off the Sep 1 high / High Oct 15
- RES 1: 0.7158 High Oct 23
- PRICE: 0.7135 @ 06:09 GMT Oct 27
- SUP 1: 0.7085 Low Oct 22
- SUP 2: 0.7021 Low Oct 20
- SUP 3: 0.7006 Low Sep 25 and the bear trigger
- SUP 4: 0.6965 23.6% retracement of the Mar - Sep rally
AUDUSD outlook remains bearish although the pair is holding onto recent gains. The Aussie continues to trade below trendline resistance drawn off the Sep 1 high. The line intersects at 0.7163 and the recent failure at the trendline highlights a bearish risk. Attention is on the primary support and bear trigger at 0.7006, Sep 25 low. A trendline break however would alter the picture and signal a stronger reversal. This would open 0.7243, Oct 10 high.
USD/CAD: Corrective Bounce
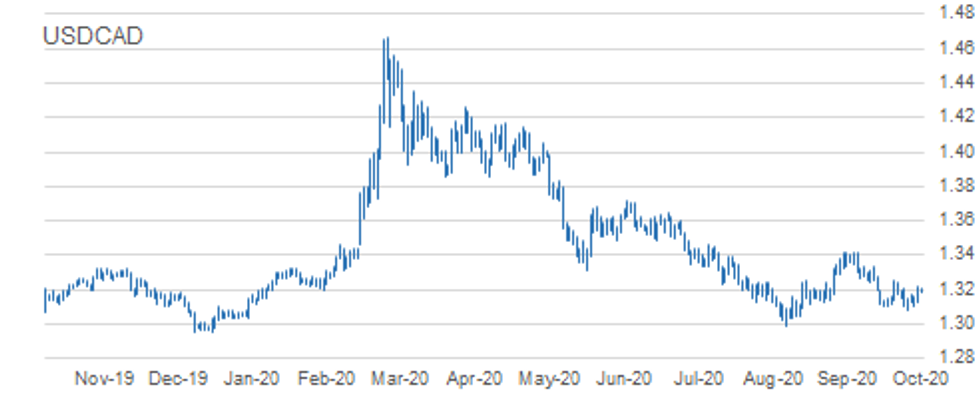
- RES 4: 1.3421 High Sep 30 and primary resistance
- RES 3: 1.3341 High Oct 7
- RES 2: 1.3240/59 50-day EMA / High Oct 15 and the bull trigger
- RES 1: 1.3219 High Oct 26
- PRICE: 1.3173 @ 06:15 GMT Oct 27
- SUP 1: 1.3109/3081 Low Oct 23 / Low Oct 21 and the bear trigger
- SUP 2: 1.3047 Low Sep 7
- SUP 3: 1.3038 Low Sep 2
- SUP 4: 1.2994 Low Sep 1 and the major support
USDCAD started the week on a firm note, rallying yesterday. Despite recent gains, the outlook remains bearish though. The pair last week breached key support at 1.3099, Oct 13 low. The move lower confirms a resumption of the current downtrend that started Sep 30. Moving average studies are bearish too, reinforcing current conditions. Scope exists for a move towards the major support at 1.2994, Sep 1 low. Key resistance is at 1.3259, Oct 15 high.
MNI Key Levels
EUR/USD: MNI Key Levels
- $1.1966 Aug18 high
- $1.1917/24/29 Sep10 high/Upper Boll Band (3%)/Sep02 high
- $1.1900/12 Sep15 high/Upper 1.0% 10-dma env
- $1.1882 Sep16 high
- $1.1867/75/81 Oct22 high/Upper Boll Band (2%)/Oct21 high
- $1.1848/57/61 Cloud top/100-mma/Oct26 high
- $1.1829/35 Intraday high/100-hma
- $1.1829 ***CURRENT MARKET PRICE 05:13BST TUESDAY***
- $1.1807/03/00 Intraday low/Oct26 low/55-dma
- $1.1795/94/87 50-dma/200-hma/Oct23 low
- $1.1776 21-dma
- $1.1760 Oct20 low
- $1.1736 Fibo 38.2% 1.3993-1.0341
- $1.1689/85/80 Oct15 low/Sep30 low, Sep25 high/Lower Boll Band (2%)
- $1.1676 Lower 1.0% 10-dma envelope
GBP/USD: MNI Key Levels
- $1.3197 Upper Bollinger Band (3%)
- $1.3177 Oct21 high
- $1.3153 Oct22 high
- $1.3136 Upper 1.0% 10-dma envelope
- $1.3122/24 Oct23 high/Upper Boll Band (2%)
- $1.3069/75 100-hma/Oct26 high
- $1.3040 Intraday high
- $1.3036 ***CURRENT MARKET PRICE 05:20BST TUESDAY***
- $1.3017/11/10 55-dma/Cloud top/Intraday low
- $1.3008/05 50-dma/200-hma
- $1.2993 Oct26 low
- $1.2981/79/73 Cloud base/Oct20 high/21-dma
- $1.2952/47 50-mma/200-wma
- $1.2940 Oct21 low
- $1.2911 Oct20 low
EUR/GBP: MNI Key Levels
- Gbp0.9220 Sep22 high
- Gbp0.9181 Sep24 high
- Gbp0.9162/63 Oct07 high/Upper Boll Band (3%)
- Gbp0.9149/57/59 Oct20 high/Sep30 high/Upper 1.0% 10-dma env
- Gbp0.9129/34/37 Cloud top/Upper Boll Band (2%)/Oct21 high
- Gbp0.9106/07 Oct26 high/Oct23 high
- Gbp0.9078/79/80 21-dma/Cloud base/Intraday high
- Gbp0.9073 ***CURRENT MARKET PRICE 05:27BST TUESDAY***
- Gbp0.9068/66 50-dma, 200-hma/Intraday low, 55-dma
- Gbp0.9056/50/41 100-hma/100-dma/Oct26 low
- Gbp0.9016/12/07 Lower Boll Band (2%)/Oct21 low/Oct14 low
- Gbp0.8987/78 Lower Boll Band (3%)/Lower 1.0% 10-dma env
- Gbp0.8967 Sep08 low
- Gbp0.8925 Sep07 low
- Gbp0.8900/96/87 Sep04 low/200-dma/Lower 2.0% 10-dma env
USD/JPY: MNI Key Levels
- Y105.36 21-dma
- Y105.31 Cloud base
- Y105.23 Cloud Kijun Sen
- Y105.08 200-hma
- Y105.06 Oct26 high
- Y105.05 Cloud Tenkan Sen
- Y104.76/89 100-hma/Intraday high
- Y104.75 ***CURRENT MARKET PRICE 05:34BST TUESDAY***
- Y104.68/66/55 Intraday low/Oct26 low/Oct23 low
- Y104.53 Lower Bollinger Band (2%)
- Y104.48 Oct22 low
- Y104.34 Oct21 low
- Y104.12 Lower Bollinger Band (3%)
- Y104.02 Lower 1.0% 10-dma envelope
- Y104.00 YTD low
EUR/JPY: MNI Key Levels
- Y124.79 50-mma
- Y124.66 55-dma
- Y124.65 Cloud top
- Y124.52 50-dma
- Y124.23 Oct26 high
- Y124.07 21-dma
- Y123.94/99/01 Intraday high/100-hma/Cloud Tenkan Sen
- Y123.94 ***CURRENT MARKET PRICE 05:40BST TUESDAY***
- Y123.93 200-hma
- Y123.74 Cloud Kijun Sen
- Y123.69 Intraday low
- Y123.68 Cloud base
- Y123.56 100-dma
- Y123.41 Oct23 low
- Y123.37 Oct19 low
AUD/USD: MNI Key Levels
- $0.7243/44/51 Oct09 high/200-wma/Upper 2.0% 10-dma env
- $0.7234/35 Upper Boll Band (2%)/Sep22 high, Oct12 high
- $0.7218 Oct13 high
- $0.7195 50-dma
- $0.7180/91/94 Upper 1.0% 10-dma env/Oct14 high/55-dma
- $0.7158/68/70 Oct23 high/Cloud base/Oct15 high
- $0.7138/39/46 Intraday high/21-dma/Oct26 high
- $0.7134 ***CURRENT MARKET PRICE 05:45BST TUESDAY***
- $0.7118/16/10 100-hma/Intraday low/100-dma
- $0.7103/97 Oct26 low/200-hma
- $0.7085 Oct22 low
- $0.7047/46/38 Oct21 low/Lower Boll Band (2%)/Lower 1.0% 10-dma env
- $0.7021/06 Oct20 low/Sep25 low
- $0.6998 Lower Bollinger Band (3%)
- $0.6973/67/63 Jul20 low/Lower 2.0% 10-dma env/Jul16 low
USD/CAD: MNI Key Levels
- C$1.3337/39/41 100-dma/Upper Boll Band (2%)/Oct07 high
- C$1.3320 Cloud top
- C$1.3299 Upper 1.0% 10-dma envelope
- C$1.3259/73 Oct15 high/Oct08 high
- C$1.3225/38 Oct26 high/Oct16 high
- C$1.3208/12 21-dma/Intraday high
- C$1.3188/99/01 Cloud base/50-dma/55-dma
- C$1.3177 ***CURRENT MARKET PRICE 05:49BST TUESDAY***
- C$1.3176/73/68 50-mma/Intraday low/200-hma
- C$1.3160/53 200-wma/100-hma
- C$1.3126/24 Oct26 low/Oct22 low
- C$1.3109 Oct23 low
- C$1.3081 Oct21 low
- C$1.3060 Lower Bollinger Band (2%)
- C$1.3038/36 Sep02 low/Lower 1.0% 10-dma env
OPTIONS: Expiries for Oct27 NY cut 1000ET (Source DTCC)
- EUR/USD: $1.1775-85(E765mln), $1.1800-05(E1.2bln), $1.1850(E469mln)
- USD/JPY: Y104.25-30($1.1bln-USD puts), Y105.00($1.8bln), Y105.25($1.2bln), Y106.00-05($1.2bln)
- EUR/GBP: Gbp0.9135-45(E910mln)
- AUD/USD: $0.6680(A$1.1bln)
- AUD/NZD: N$1.0809-20(A$2.5bln)
Larger Option Pipeline
- EUR/USD: Oct28 $1.1745-60(E1.3bln), $1.1800-05(E1.6bln), $1.2000(E2.7bln); Oct30 $1.1800(E1.7bln), $1.1850(E1.4bln), $1.1950(E1.7bln-EUR calls), $1.2000(E1.3bln); Nov03 $1.1900-05(E1.3bln)
- USD/JPY: Oct28 Y104.85-00($2.9bln), Y105.30-40($1.8bln); Oct29 Y103.20-25($1.6bln), Y104.00($1.6bln), Y105.25($1.3bln), Y105.55-65($2.4bln), Y106.00($1.2bln); Oct30 Y104.00($1.2bln), Y104.50($2.2bln), Y104.80-85($1.4bln), Y104.95-105.00($1.0bln), Y106.00-05($2.2bln); Nov03 Y105.45-49($1.3bln); Nov04 Y105.00($1.1bln); Nov05 Y106.06-09($1.6bln)
- EUR/JPY: Nov05 Y124.50(E1.0bln)
- GBP/USD: Nov02 $1.3100(Gbp1.1bln), $1.3150(Gbp842mln)
- EUR/GBP: Nov02 Gbp0.8900(E1.8bln-EUR puts), Gbp0.9000(E1.0bln)
- AUD/USD: Oct30 $0.7180-00(A$1.4bln); Nov02 $0.7140-45(A$1.7bln)
- AUD/JPY: Oct29 Y73.20(A$1.0bln-AUD puts), Y76.35-40(A$2.4bln-AUD calls); Oct30 Y77.45(A$1.2bln)
- AUD/NZD: Oct30 N$1.0750(A$1.2bln)
- USD/CAD: Oct30 C$1.3025($1.1bln), C$1.3150($1.2bln)
- USD/CNY: Nov03 Cny6.5334($1.2bln); Nov05 Cny6.75($1.0bln), Cny6.80($1.9bln), Cny6.85($1.3bln)
Why MNI
MNI is the leading provider
of intelligence and analysis on the Global Fixed Income, Foreign Exchange and Energy markets. We use an innovative combination of real-time analysis, deep fundamental research and journalism to provide unique and actionable insights for traders and investors. Our "All signal, no noise" approach drives an intelligence service that is succinct and timely, which is highly regarded by our time constrained client base.Our Head Office is in London with offices in Chicago, Washington and Beijing, as well as an on the ground presence in other major financial centres across the world.