-
Policy
Policy
Exclusive interviews with leading policymakers that convey the true policy message that impacts markets.
LATEST FROM POLICY: -
EM Policy
EM Policy
Exclusive interviews with leading policymakers that convey the true policy message that impacts markets.
LATEST FROM EM POLICY: -
G10 Markets
G10 Markets
Real-time insight on key fixed income and fx markets.
Launch MNI PodcastsFixed IncomeFI Markets AnalysisCentral Bank PreviewsFI PiFixed Income Technical AnalysisUS$ Credit Supply PipelineGilt Week AheadGlobal IssuanceEurozoneUKUSDeep DiveGlobal Issuance CalendarsEZ/UK Bond Auction CalendarEZ/UK T-bill Auction CalendarUS Treasury Auction CalendarPolitical RiskMNI Political Risk AnalysisMNI Political Risk - US Daily BriefMNI Political Risk - The week AheadElection Previews -
Emerging Markets
Emerging Markets
Real-time insight of emerging markets in CEMEA, Asia and LatAm region
-
Commodities
-
Credit
Credit
Real time insight of credit markets
-
Data
-
Global Macro
Global Macro
Actionable insight on monetary policy, balance sheet and inflation with focus on global issuance. Analysis on key political risk impacting the global markets.
Global MacroDM Central Bank PreviewsDM Central Bank ReviewsEM Central Bank PreviewsEM Central Bank ReviewsBalance Sheet AnalysisData AnalysisEurozone DataUK DataUS DataAPAC DataInflation InsightEmployment InsightGlobal IssuanceEurozoneUKUSDeep DiveGlobal Issuance Calendars EZ/UK Bond Auction Calendar EZ/UK T-bill Auction Calendar US Treasury Auction Calendar Global Macro Weekly -
About Us
To read the full story
Sign up now for free trial access to this content.
Please enter your details below.
Why MNI
MNI is the leading provider
of intelligence and analysis on the Global Fixed Income, Foreign Exchange and Energy markets. We use an innovative combination of real-time analysis, deep fundamental research and journalism to provide unique and actionable insights for traders and investors. Our "All signal, no noise" approach drives an intelligence service that is succinct and timely, which is highly regarded by our time constrained client base.Our Head Office is in London with offices in Chicago, Washington and Beijing, as well as an on the ground presence in other major financial centres across the world.
Real-time Actionable Insight
Get the latest on Central Bank Policy and FX & FI Markets to help inform both your strategic and tactical decision-making.
Free AccessMNI BRIEF: Canada Commits To Just One Of Three Fiscal Anchors
MNI POLITICAL RISK - Thune Eyes 'Deficit-Negative' Legislation
MNI Europe Morning FX Analysis: JPY Pares Monday Losses as Positive Risk Outlook Fades
| Spot | Change (%) | 3m Implied Vol | Change (ppts) | 3m FWD Points | Change (points) | |||||||
| One-day | One-week | One-day | One-week | One-day | One-week | |||||||
| EURUSD | 1.1834 | 0.18% | 1.02% | 6.555 | -0.03 | -0.71 | 26.3 | 0.05 | -0.12 | |||
| GBPUSD | 1.3185 | 0.14% | 0.96% | 9.495 | 0.06 | -0.86 | 8.57 | 0.02 | -0.44 | |||
| EURGBP | 0.8975 | 0.01% | 0.04% | 8.275 | 0.02 | -0.62 | 14.08 | 0.00 | 0.06 | |||
| USDJPY | 104.97 | -0.39% | 0.46% | 6.5975 | 0.00 | -0.65 | -13.97 | -0.10 | 0.66 | |||
| EURJPY | 124.22 | -0.20% | 1.48% | 7.14 | 0.01 | -0.91 | 11.03 | -0.15 | 0.60 | |||
| AUDUSD | 0.7284 | 0.00% | 1.68% | 9.69 | 0.01 | -1.04 | 4.29 | -0.07 | 0.29 | |||
| NZDUSD | 0.6834 | 0.23% | 2.21% | 9.5425 | 0.00 | 0.01 | 0.38 | 0.18 | 0.06 | |||
| USDCAD | 1.3006 | -0.01% | -1.05% | 6.89 | 0.05 | -0.73 | -5.18 | 0.06 | 0.08 | |||
| USDCNH | 6.6042 | -0.18% | -1.18% | 6.1475 | 0.19 | -0.91 | 478.75 | -4.02 | 62.44 | |||
| USDZAR | 15.41 | 0.21% | -4.08% | 15.885 | -0.07 | -0.85 | 1665 | 6.00 | -112.00 | |||
| USDTRY | 8.22 | 1.91% | -2.07% | 21.145 | -0.06 | -1.07 | 2826.8 | 57.12 | -612.60 | |||
| Time(GMT) | 06:09 |
FOREX: JPY Pares Monday Losses as Positive Risk Outlook Fades
Asia witnessed a degree of reversal of yesterday's risk rally driven by optimistic news on the Covid-19 vaccine front. Regional players were happy to take profit in the wake of yesterday's price swings. Meanwhile, focus started moving back to uncertainty around U.S. presidential transition and concerns over the dragged-out U.S. stimulus talks, with questions re: longevity and distribution of a potential Covid-19 jab providing another thing to worry about. JPY easily outperformed all of its G10 peers, correcting its spectacular plunge seen yesterday. USD/JPY sank through its 50-DMA and established itself just below the Y105.00 mark.
- AUD, CAD & NOK traded on a softer footing as e-minis ground lower, signalling that yesterday's risk-on impetus is losing steam. NZD defied its commodity-tied peers and became the second-best performer in the G10 basket, with participants preparing for tomorrow's RBNZ MonPol decision.
- The greenback sat near the bottom of the G10 pile, with the DXY extending its pullback from Monday highs.
- Despite the initial uptick, USD/CNH swung to a loss and continued to lose altitude, paying little attention to the in-line PBoC fix & worse than expected Chinese inflation data.
- Focus turns to German ZEW Survey, UK labour market report, French & Italian industrial outputs and Norwegian CPI, as well as comments from Fed's Kaplan, Rosengren, Bostic, Quarles & Barainard and ECB's Knot.
EUR/USD: Bullish Theme Intact
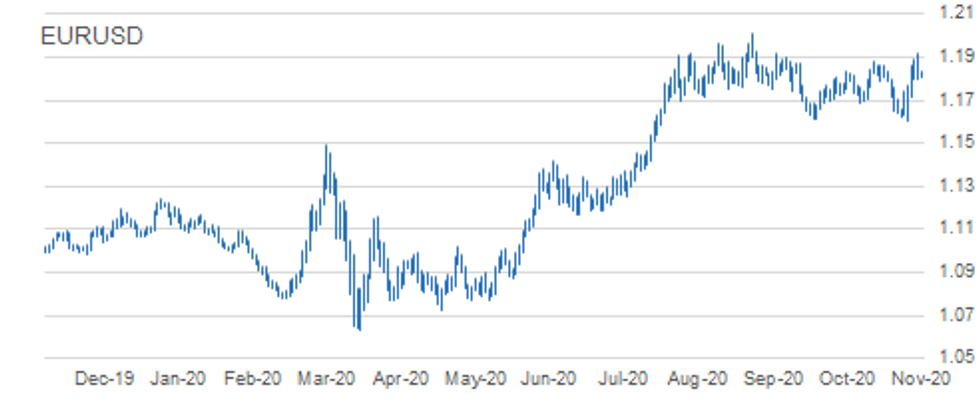
- RES 4: 1.2011 High Sep 1 and major resistance
- RES 3: 1.1981 2.0% 10-dma envelope
- RES 2: 1.1971 3.0% Upper Bollinger Band
- RES 1: 1.1920 High Nov 9
- PRICE: 1.1836 @ 05:25 GMT Nov 10
- SUP 1: 1.1795 Low Nov 9
- SUP 2: 1.1750 50-day EMA
- SUP 3: 1.1711 Low Nov 5
- SUP 4: 1.1603 Low Nov 4 and the bear trigger
EURUSD retraced yesterday however this is likely a correction with the pair maintaining a bullish tone following last week's gains and most recently, the breach of key resistance at 1.1881, Oct 21 high. The break of this level paves the way for a climb towards 1.2011, Sep 1 high. Today's bull trigger is 1.1920, yesterday's high. On the downside, key support has been defined at 1.1603. A move below this support is required to reinstate a bearish threat.
GBP/USD: Needle Points North
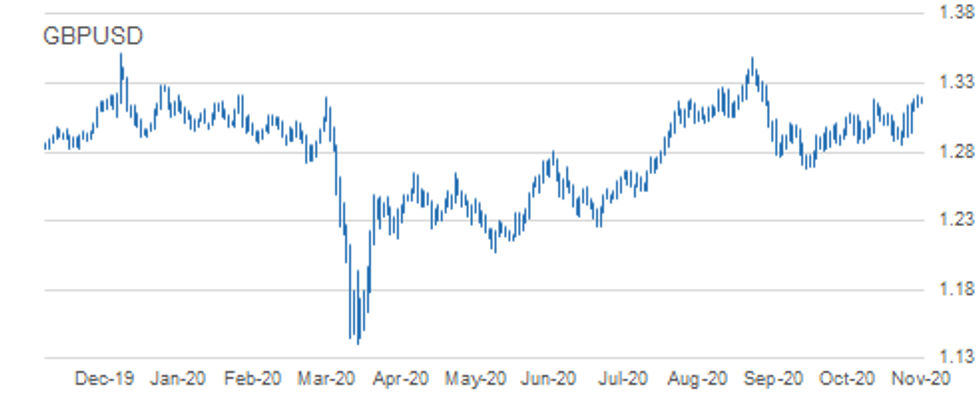
- RES 4: 1.3319 High Sep 4
- RES 3: 1.3292 76.4% retracement of the Sep 1 - 23 sell-off
- RES 2: 1.3294 2.0% 10-dma envelope
- RES 1: 1.3208 High Nov 9
- PRICE: 1.3189 @ 05:33 GMT Nov 10
- SUP 1: 1.3093 Low Nov 6
- SUP 2: 1.3028 20-day EMA
- SUP 3: 1.2911 Low Nov 3
- SUP 4: 1.2855 Low Nov 2 and a key support
GBPUSD started the week on a firmer note following last week's gains. Importantly, the pair pushed higher gains resulted in a move above key resistance at 1.3177, Oct 21 and Nov 6 high. The break above this level signals scope for further strength with attention turning to 1.3292 next, 76.4% of the Sep 1 - 23 sell-off. Note that price has traded above the 61.8% retracement at 1.3174. Initial support lies at Friday's 1.3093 low.
EUR/GBP: Key Support Lies At 0.8946
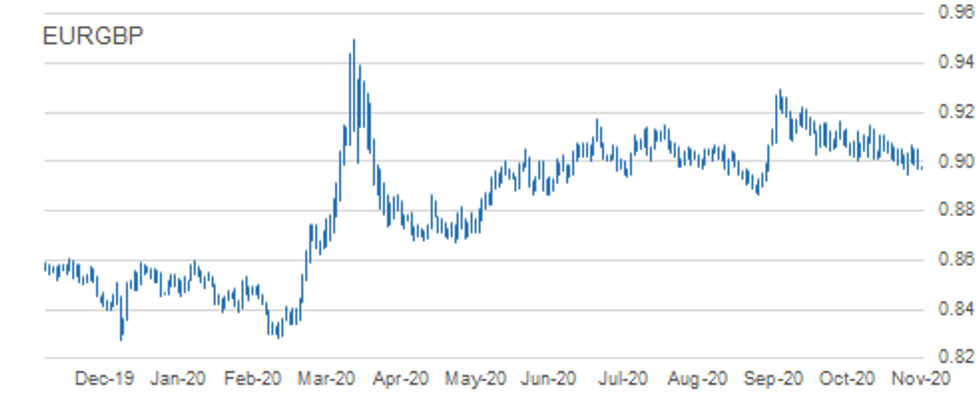
- RES 4: 0.9162 High Oct 7
- RES 3: 0.9149 Oct 20 high
- RES 2: 0.9107 High Oct 23
- RES 1: 0.9069 High Nov 5 / Trendline drawn off the Sep 11 high
- PRICE: 0.8974 @ 05:40 GMT Nov 10
- SUP 1: 0.8968 Intraday low
- SUP 2: 0.8946 Low Nov 4 and the key near-term support
- SUP 3: 0.8924 Low Sep 7
- SUP 4: 0.8900 Low Sep 4
EURGBP traded lower yesterday. Despite the sell-off, the cross maintains a potential positive tone following the Nov 4 recovery. In pattern terms a bullish engulfing reversal marks the Nov 4 session. If correct, it signals a floor at 0.8946, NOv 4 low. Further gains would open 0.9107, Oct 23 high. Note there is a trendline resistance at 0.9069, drawn off the Sep 11 high and represents a key S/T hurdle for bulls. Sub 0.8946 levels would resume the downtrend.
USD/JPY: Bullish Engulfing Candle
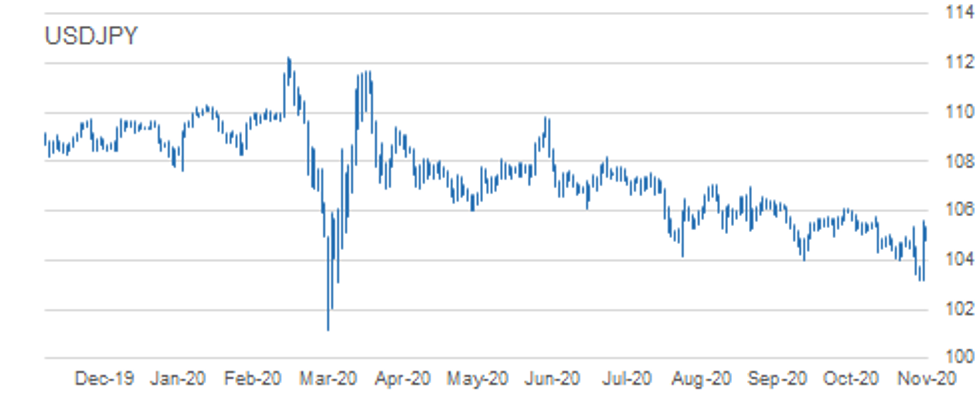
- RES 4: 106.55 High Sep 3
- RES 3: 106.11 High Oct 8
- RES 2: 105.89 100 dma
- RES 1: 105.65 High Nov 9
- PRICE: 104.96 @ 05:53 GMT Nov 10
- SUP 1: 104.42 50.0% retracement of yesterday's range
- SUP 2: 103.18/09 Low Nov 6 / Low Mar 12 and key support
- SUP 3: 102.02 Low Mar 10
- SUP 4: 101.29 Bear channel base drawn off the Mar 24 high
USDJPY rallied sharply higher Monday defining a key short-term support at 103.18, Nov 6 low. In candle terms, yesterday's price pattern is a bullish engulfing line and highlights a potential reversal in sentiment. A break of 105.65, the Monday high would reinforce this set-up and signal scope for a climb towards the 100-dma at 105.89 and the early October highs of 106.11. Initial support is seen at 104.42, 50.0% of yesterday's trading range.
EUR/JPY: Bear Channel Breakout
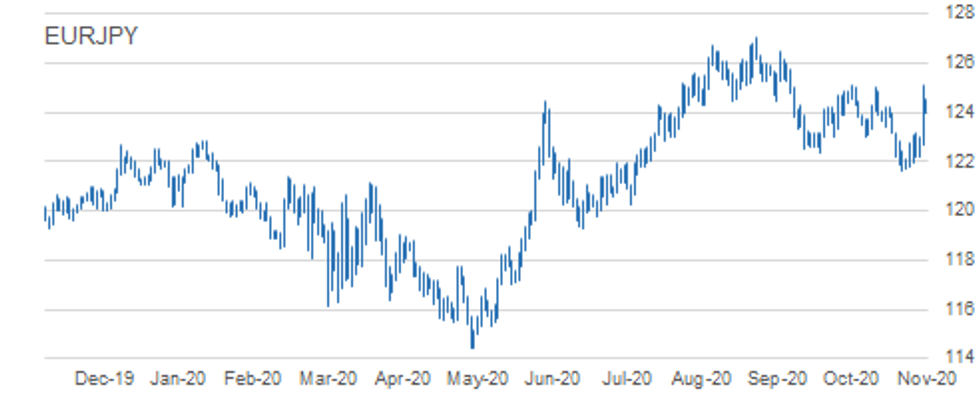
- RES 4: 127.08 High Sep 1 and primary resistance
- RES 3: 126.46 High Sep 10
- RES 2: 125.79 76.4% retracement of the Sep - Oct Sell-Off
- RES 1: 125.13 High Nov 9
- PRICE: 124.23 @ 06:04 GMT Nov 10
- SUP 1: 123.99 Intraday low
- SUP 2: 122.69 Low Nov 9
- SUP 3: 122.21 Low Nov 5
- SUP 4: 121.62 Low Oct 30 and key support
EURJPY traded sharply higher yesterday alongside the broad risk-on rally Monday. This solidly counters the underlying bearish theme, with markets convincingly breaking above resistance highlighted by the 20- and 50-day EMA's. Furthermore, the cross has also cleared its bear channel resistance drawn off the Sep 1 high. This has opened 125.79, a Fibonacci retracement ahead of the early September highs of 126.46. Support is at 122.69.
AUD/USD: Needle Points North
- RES 4: 0.7414 High Sep 1
- RES 3: 0.7360 3.0% 10-dma envelope
- RES 2: 0.7345 High Sep 16
- RES 1: 0.7340 High Nov 9
- PRICE: 0.7286 @ 06:09 GMT Nov 10
- SUP 1: 0.7239 Low Nov 6
- SUP 2: 0.7145 Low Nov 5
- SUP 3: 0.7100 Former trendline resistance drawn off the Sep 1 high
- SUP 4: 0.7049 Low Nov 4
AUDUSD maintains a bullish tone. The pair rallied sharply higher last week reinforcing the significance of the recent trendline break drawn off the Sep 1 high. Gains on Nov 5 also resulted in a break of former resistance at 0.7243, Oct 9 high. With bullish conditions strengthened, scope is seen for a climb towards 0.7345 next, Sep 16 high. Initial firm support is seen at 0.7145. A break would undermine the current bullish outlook.
USD/CAD: Clears 2019 Low
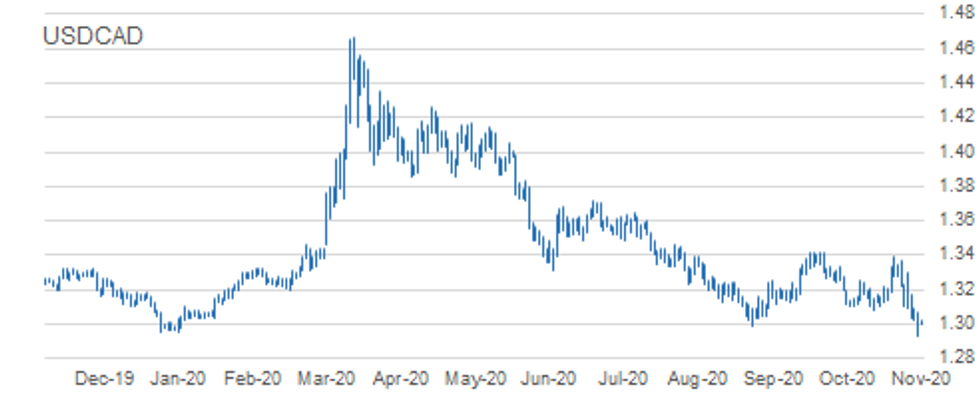
- RES 4: 1.3300 High Nov 4
- RES 3: 1.3215 50-day EMA
- RES 2: 1.3178 High Nov 5
- RES 1: 1.3081 Low Oct 21
- PRICE: 1.3014 @ 06:21 GMT Nov 10
- SUP 1: 1.2929/17 Low Nov 9 / Low Oct 16, 2018
- SUP 2: 1.2912 2.0% 10-dma envelope
- SUP 3: 1.2857 Low Oct 4, 2018
- SUP 4: 1.2783 Low Oct, 1 2018 and a key support
USDCAD traded lower yesterday extending the most recent sell-off from 1.3390, Oct 29 high. More importantly, the pair fell solidly through the Dec 31 2019 lows, hitting the lowest level since mid-2018 in the process. Various levels of support, most notably 1.2952, the Dec 2019 low gave way Monday. This reinforces the bearish them and opens 1.2917 and 1.2857, the Oct 16 and Oct 4, 2018 lows respectively. 1.3081 is seen as a firm resistance.
EUR/USD: MNI Key Levels
- $1.2011 YTD Sep01 high
- $1.1984/85 Upper 2.0% 10-dma env/Upper Boll Band (3%)
- $1.1966 Aug18 high
- $1.1913/20/29 Upper Boll Band (2%)/Nov09 high/Sep02 high
- $1.1873/91 61.8% 1.1920-1.1796/Nov06 high, 76.4% 1.1920-1.1796
- $1.1858/60/67 50% 1.1920-1.1796/Nov05 high/Upper 1.0% 10-dma env
- $1.1838/43/50 Intraday high/38.2% 1.1920-1.1796/100-mma
- $1.1833 ***CURRENT MARKET PRICE 05:10BST TUESDAY***
- $1.1815/07 100-hma/Intraday low
- $1.1796/95/83 Nov06 low, Cloud top/Nov09 low/55-dma
- $1.1774/69 50-dma/21-dma
- $1.1762/58 50% 1.1603-1.1920/Cloud base
- $1.1742 200-hma
- $1.1724/11 61.8% 1.1603-1.1920/Nov05 low
- $1.1691/78 100-dma/76.4% 1.1603-1.1920
GBP/USD: MNI Key Levels
- $1.3403 Sep02 high, Sep02 high
- $1.3357 Sep03 high
- $1.3319 Sep04 high
- $1.3309 Upper Boll Band (3%), Upper 2.0% 10-dma env
- $1.3280/92 Sep07 high/76.4% 1.3482-1.2676
- $1.3215 Upper Bollinger Band (2%)
- $1.3199/08 Intraday high/Nov09 high
- $1.3189 ***CURRENT MARKET PRICE 05:24BST TUESDAY***
- $1.3179 Upper 1.0% 10-dma envelope
- $1.3157 Intraday low
- $1.3119 Nov09 low
- $1.3104 100-hma
- $1.3093 Nov06 low
- $1.3079 Cloud top
- $1.3027/23 200-hma/21-dma
EUR/GBP: MNI Key Levels
- Gbp0.9100/06/07 Cloud top/Oct26 high/Oct23 high
- Gbp0.9085/96 Oct27 high/Upper 1.0% 10-dma env
- Gbp0.9074/76/79 50-dma/Oct28 high/Cloud base
- Gbp0.9055/62/69 Nov06 high/55-dma/Nov05 high
- Gbp0.9038/48/51 21-dma/Nov09 high/100-dma
- Gbp0.9004/14/16 10-dma/200-hma/100-hma
- Gbp0.8981/89 Intraday high/Nov06 low
- Gbp0.8974 ***CURRENT MARKET PRICE 05:30BST TUESDAY***
- Gbp0.8967 Intraday low
- Gbp0.8949/46 Lower Boll Band (2%)/Nov04 low
- Gbp0.8925/24/16 Sep07 low/200-dma/Lower 1.0% 10-dma env
- Gbp0.8906/00 Lower Boll Band (3%)/Sep04 low
- Gbp0.8866/64 Sep03 low/Jun09 low
- Gbp0.8830/26/25 May15 low/May14 low/Lower 2.0% 10-dma env
- Gbp0.8822/16/08 100-wma/200-wma/May13 low
USD/JPY: MNI Key Levels
- Y105.85 Oct12 high
- Y105.75 Oct20 high
- Y105.65 Nov09 high
- Y105.53 Cloud top
- Y105.49 Upper 1.0% 10-dma envelope
- Y105.38 Intraday high
- Y105.26/31/32 50-dma/Cloud base/55-dma
- Y104.94 ***CURRENT MARKET PRICE 05:37BST TUESDAY***
- Y104.82/78 Intraday low/21-dma
- Y104.71/65 38.2% 103.18-105.65/Cloud Kijun Sen
- Y104.54 Nov05 high
- Y104.42 Cloud Tenkan Sen, 50% 103.18-105.65
- Y104.35 200-hma
- Y104.12/08 61.8% 103.18-105.65/100-hma
- Y104.00 Sep21 low
EUR/JPY: MNI Key Levels
- Y125.13 Nov09 high
- Y125.07 Upper Bollinger Band (2%)
- Y125.00 Oct20 high
- Y124.96 50-mma
- Y124.93 Fibo 38.2% 149.78-109.57*Y124.73 Cloud top
- Y124.53 Intraday high
- Y124.18 ***CURRENT MARKET PRICE 05:47BST TUESDAY***
- Y124.14/11 Cloud base/55-dma
- Y123.99 Intraday low
- Y123.95 Upper 1.0% 10-dma envelope
- Y123.93 50-dma
- Y123.76 100-dma
- Y123.41 Oct23 low
- Y123.38 Cloud Kijun Sen, Cloud Tenkan Sen
AUD/USD: MNI Key Levels
- $0.7484 Jul09-2018 high, Jul10-2018 high
- $0.7453/64 Aug09-2018 high/Jul25-2018 high
- $0.7414 YTD Sep01 high
- $0.7376/82/90 Upper3.0% 10-dma env/Sep02 high/Upper Boll Band (3%)
- $0.7340 Sep03 high, Nov09 high
- $0.7304/05 Upper 2.0% 10-dma env/Upper Boll Band (2%)
- $0.7289 Intraday high
- $0.7280 ***CURRENT MARKET PRICE 05:51BST TUESDAY***
- $0.7267/53 Nov09 low, Intraday low/50-mma
- $0.7244/42/39 100-hma/200-wma/Nov06 low
- $0.7232 Upper 1.0% 10-dma envelope
- $0.7210 Cloud top
- $0.7190/77 55-dma/50-dma
- $0.7159/50/45 Cloud base/200-hma/Nov05 low
- $0.7136 21-dma, 100-dma
USD/CAD: MNI Key Levels
- C$1.3227 Cloud base
- C$1.3192/02 55-dma/50-dma
- C$1.3176/78 50-mma/Nov05 high
- C$1.3159/62/71 200-wma/21-dma/200-hma
- C$1.3097 Nov06 high
- C$1.3068/69 Nov09 high/100-hma
- C$1.3021/26 Intraday high/Lower 1.0% 10-dma env
- C$1.3010 ***CURRENT MARKET PRICE 05:56BST TUESDAY***
- C$1.2998/94 Intraday low/Sep01 low
- C$1.2975 Lower Bollinger Band (2%)
- C$1.2929/17 YTD Nov09 low/Oct16-2018 low
- C$1.2895/91/82 Lower 2.0% 10-dma env/Oct05-2018 low/Lower Boll Band (3%)
- C$1.2857 Oct04-2018 low
- C$1.2763 Lower 3.0% 10-dma envelope
- C$1.2672 Fibo 38.2% 0.9407-1.4690
OPTIONS: Expiries for Nov10 NY cut 1000ET (Source DTCC)
- EUR/USD: $1.1600(E587mln), $1.1695-1.1705(E2.1bln), $1.1800(E1.2bln), $1.1825-30(E561mln),
$1.1840-50(E672mln), $1.2000(E615mln), $1.2100(E674mln) - USD/JPY: Y103.00($1.5bln-USD puts), Y103.75($1.1bln), Y104.00($515mln), Y104.30($715mln),
Y104.40-50($3.0bln), Y104.75($953mln), Y105.00-05($1.6bln), Y105.50($980mln) - AUD/USD: $0.6930-35(A$820mln)
- AUD/JPY: Y78.45-50(A$523mln)
- USD/CAD: C$1.3195-00($500mln)
Larger Option Pipeline
- EUR/USD: Nov11 $1.1650-55(E1.1bln), $1.1830-35(E1.0bln); Nov13 $1.2000(E1.78bln-EUR calls);
Nov17 $1.1850(E1.2bln-EUR calls) - USD/JPY: Nov12 Y103.00($1.9bln-USD puts), Y105.40-50($1.3bln); Nov13 Y101.00($995mln-USD puts)
- EUR/JPY: Nov16 Y123.00(E1.25bln)
- EUR/AUD: Nov12 A$1.6520(E973mln)
- AUD/NZD: Nov16 N$1.0650(A$1.16bln)
- USD/CNY: Nov11 Cny6.65($1.0bln); Nov13 Cny6.60($1.1bln); Nov20 Cny6.60($1.0bln), Cny6.90($2.0bln)
To read the full story
Sign up now for free trial access to this content.
Please enter your details below.
Why MNI
MNI is the leading provider
of intelligence and analysis on the Global Fixed Income, Foreign Exchange and Energy markets. We use an innovative combination of real-time analysis, deep fundamental research and journalism to provide unique and actionable insights for traders and investors. Our "All signal, no noise" approach drives an intelligence service that is succinct and timely, which is highly regarded by our time constrained client base.Our Head Office is in London with offices in Chicago, Washington and Beijing, as well as an on the ground presence in other major financial centres across the world.
