
Why MNI
MNI is the leading provider
of intelligence and analysis on the Global Fixed Income, Foreign Exchange and Energy markets. We use an innovative combination of real-time analysis, deep fundamental research and journalism to provide unique and actionable insights for traders and investors. Our "All signal, no noise" approach drives an intelligence service that is succinct and timely, which is highly regarded by our time constrained client base.Our Head Office is in London with offices in Chicago, Washington and Beijing, as well as an on the ground presence in other major financial centres across the world.
Lowe's Speech Sends AUD Diving
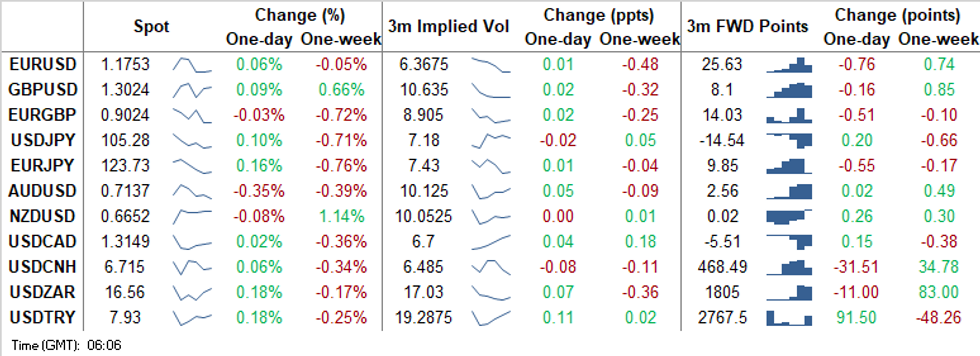
RBA Gov Lowe's speech was widely interpreted as dovish and AUD went offered across the board as participants ramped up RBA easing bets. Lowe failed to rule out ACGB purchases farther out along the curve (he specifically mentioned the 5-10 Year sector) and flagged Australia's higher 10-Year yield relative to its global peers. RBA chief added that the Bank will focus on actual inflation rather than the outlook and wants to see something more than just progress towards full employment. Australia's labour market report wasn't as bad as some feared, with unemployment ticking higher to 6.9% from 6.8%, falling short of the expected 7.0%. AUD reacted with just a limited, brief knee-jerk higher, as earlier RBA rhetoric continued to take centre stage. AUD/USD crossed below support from Oct 13 low of $0.7150, while AUD/JPY slid into the Y75.00-Y74.93 support zone.
- AUD weakness spilled over into NZD, to some degree, with NZD/USD probing the water under yesterday's low. AUD/NZD approached support from Sep 25 low of NZ$1.0718, but failed to attack the level.
- Downticks in all three main e-mini contracts applied some further light pressure to commodity-tied FX, while benefitting safe havens. JPY lagged behind USD & CHF and most of its other G10 peers after taking a hit from a round of sales into the Tokyo fix, possibly linked to Gotobi day flows.
- USD/CNH was happy to hug a tight range, even as China's CPI & PPI inflation missed expectations.
- Focus turns to U.S. initial jobless claims, Empire M'fing & Philly Fed Survey, Swedish unemployment and comments from Fed's Bostic, Bullard, Quarles, Kaplan, Barkin & Kashkari, ECB's Lagarde, BoC's Lane & BoE's Cunliffe.
TECHNICALS:
EUR/USD: Monitoring Near-Term Support
- RES 4: 1.2011 High Sep 1 and major resistance
- RES 3: 1.1917 High Sep 10 and 76.4% of the Sep 1 - 25 sell-off
- RES 2: 1.1859 61.8% retracement of the Sep 1 - 25 sell-off
- RES 1: 1.1817/31 High Oct 13 / High Oct 10 and the bull trigger
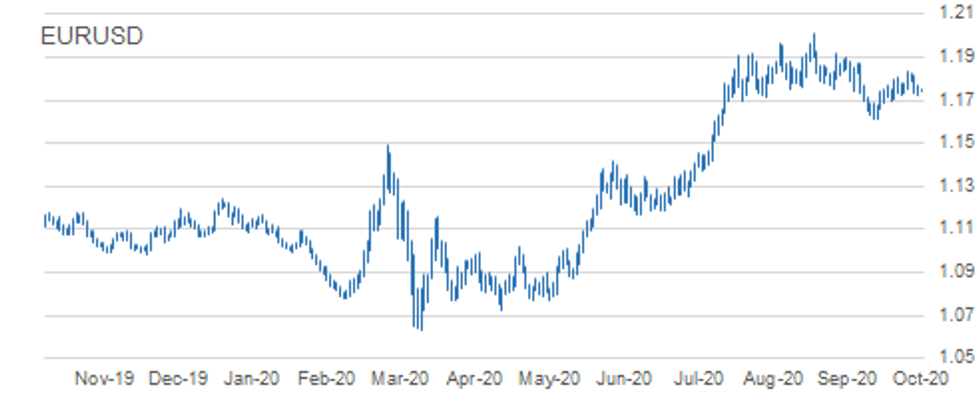
- PRICE: 1.1751 @ 05:45 BST Oct 15
- SUP 1: 1.1720 Low Oct 14
- SUP 2: 1.1685 Low Sep 30
- SUP 3: 1.1612/1581 Low Sep 25 and the bear trigger / Low Jul 24
- SUP 4: 1.1591 100-dma
EURUSD traded lower Wednesday but did manage to find support at the day low. Attention has been on key support at 1.1725, Oct 7 low. This level was probed Wednesday. A clear break would negate recent bullish signals and allow for a deeper pullback, exposing 1.1612, Sep 25 low and the key bear trigger. A move higher would again refocus attention on key resistance at 1.1831, Oct 10 high. A break of this level resumes recent bullish pressure.
GBP/USD: Still Trading Below Monday's High
- RES 4: 1.2280 High Sep 7
- RES 3: 1.3174 61.8% retracement of the Sep 1 - 23 sell-off
- RES 2: 1.3163 Former trendline support drawn off the Mar 20 low
- RES 1: 1.3083 High Oct 12
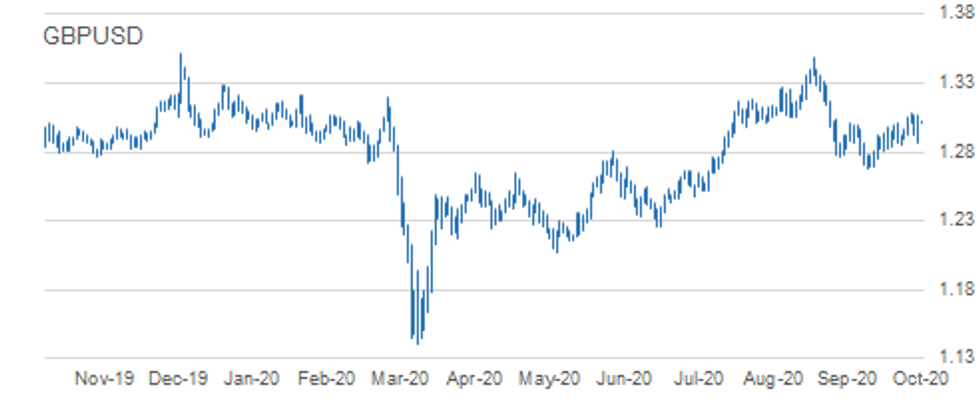
- PRICE: 1.3018 @ 05:51 BST Oct 15
- SUP 1: 1.2863 Low Oct 14
- SUP 2: 1.2846 Low Oct 7 and key near-term support
- SUP 3: 1.2806 Low Sep 30
- SUP 4: 1.2745 Low Sep 28
EUR/GBP: Bearish Conditions Dominate
- RES 4: 0.9190 61.8% retracement of the Sep 11 - 28 sell-off
- RES 3: 0.9162 High Oct 7 and the bull trigger
- RES 2: 0.9132 High Oct 10
- RES 1: 0.9122 Oct 14 high
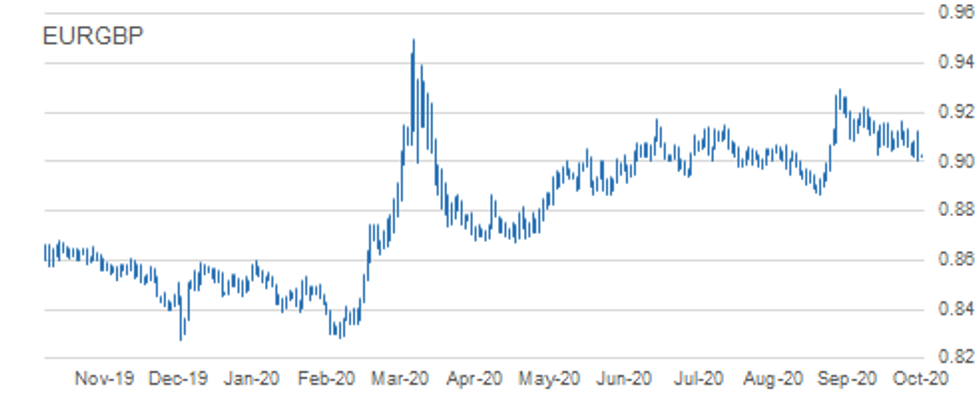
- PRICE: 0.9026 @ 05:56 BST Oct 15
- SUP 1: 0.9007 Low Oct 14
- SUP 2: 0.9000 Round number support
- SUP 3: 0.8967 76.4% retracement of the Sep 3 - 11 rally
- SUP 4: 0.8808 Low May 13
EURGBP remains soft. The cross traded sharply lower Wednesday and breached Tuesday's low. The break lower follows another failed attempt to convincingly clear trendline resistance drawn off the Sep high. The move lower also confirms a resumption of the downtrend that has been in place since Sep 11 and sets the scene for a move to 0.9000 and below towards 0.8967, a retracement level. Resistance is at 0.9122, the Oct 14 high.
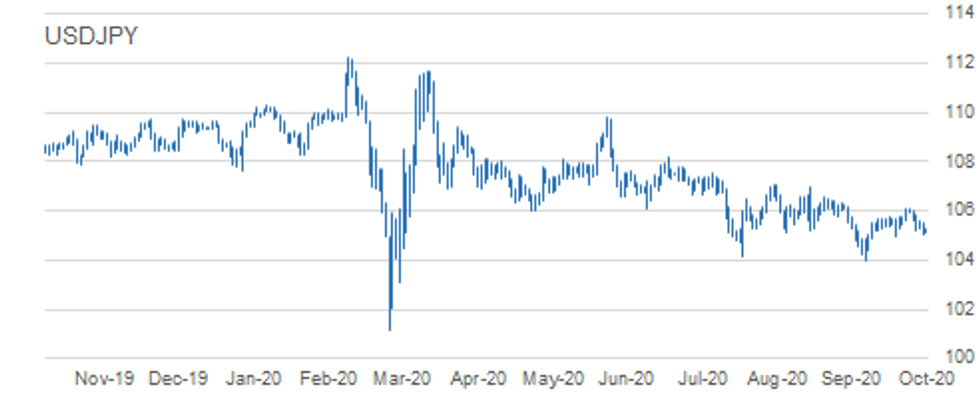
USD/JPY: Eyeing Key Short-Term Support
- RES 4: 106.95 High Sep 28
- RES 3: 106.55 High Sep 3 / Channel resistance drawn off Mar 24 high
- RES 2: 106.11/38 High Oct 7 and the bull trigger / High Sep 8
- RES 1: 105.63 High Oct 13
- PRICE: 105.28 @ 05:59 BST Oct 15
- SUP 1: 105.04 Low Oct 14
- SUP 2: 104.94 Low Oct 2 and key near-term support
- SUP 3: 104.41 Low Sep 22
- SUP 4: 104.00 Low Sep 21 and the bear trigger
USDJPY traded lower Wednesday extending this week's slide and the recent pullback from last week's 106.11 high on Oct 7. Intraday momentum studies still point south however, to strengthen a bearish theme price needs to trade below 104.94, Oct 2 low. This would open 104.00, Sep 21 low. While 104.94 remains intact, the current sell-off is considered a correction following recent gains. The bull trigger is at 106.11, Oct 7 high. Initial resistance is at 105.63.
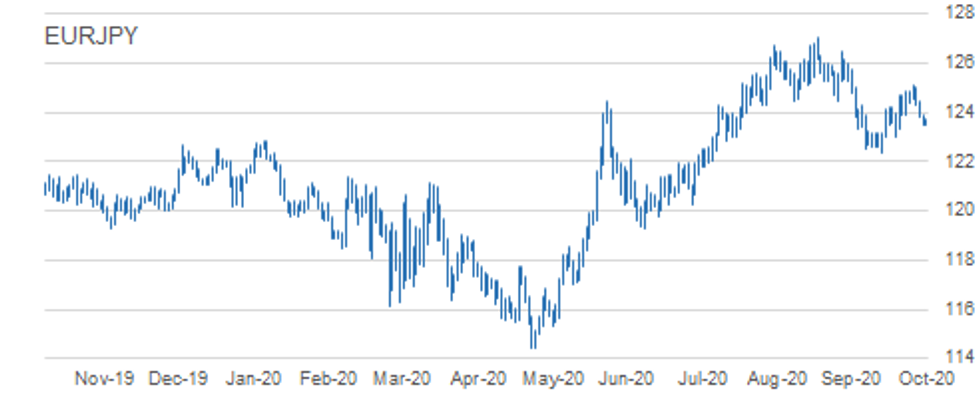
EUR/JPY: Trading Closer To The Week's Lows
- RES 4: 126.46 High Sep 10 and a key resistance
- RES 3: 125.77 High Sep 15
- RES 2: 125.09/28 High Oct 9 / 61.8% of the Sep 1 - 28 sell-off
- RES 1: 124.48 High Oct 13
- PRICE: 123.73 @ 06:11 BST Oct 15
- SUP 1: 123.31 Low Oct 5
- SUP 2: 123.03 Low Sep 29 and Oct 2 and key near-term support
- SUP 3: 122.38/28 Low Sep 28 / 61.8% of the Jun 22 - Sep 1 rally
- SUP 4: 122.25 38.2% retracement of the May - Sep rally
EURJPY maintains a softer tone, trading lower once again Wednesday. While near term weakness is considered a correction, attention turns to support at 123.03, Oct 6 low with the former support at 123.86, Oct 6 low breached. The move below 123.86 strengthens the intraday bearish tone and clearance of 123.03 would highlight scope for a deeper pullback. Key resistance is at 125.09, Oct 9 high. A break would resume bullish pressure.
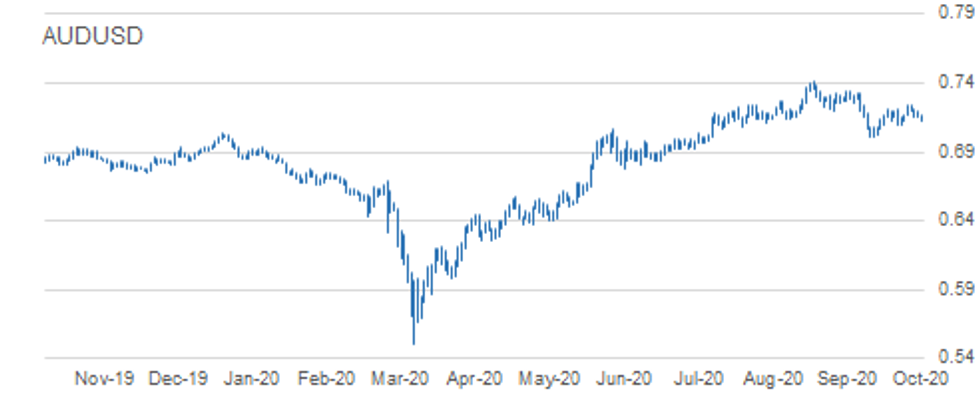
AUD/USD: Pulls Further Away From Trendline Resistance
- RES 4: 0.7318 High Sep 21
- RES 3: 0.7258 61.8% retracement September Sell-Off
- RES 2: 0.7243 High Oct 10 and the intraday bull trigger
- RES 1: 0.7213 Trendline resistance drawn off the Sep 1 high
- PRICE: 0.7134 @ 06:18 BST Oct 15
- SUP 1: 0.7124 Intraday low
- SUP 2: 0.7096 Low Oct 7 and the near-term bear trigger
- SUP 3: 0.7070 Low Sep 29
- SUP 4: 0.7006 Low Sep 25 and the bear trigger
AUDUSD is trading lower. On Oct 9, the pair cleared resistance at 0.7209, Oct 1 and 6 high resulting in a test of trendline resistance drawn off the Sep 1 high. The line intersects at 0.7213 today. Clearance of the Oct 9 high of 0.7243 would confirm a breach of the line and reinforce bullish conditions, opening 0.7258, a Fibonacci level. The break below 0.7161, Sep 9 low, does however signal a failure at the trendline. The next support lies at 0.7096.
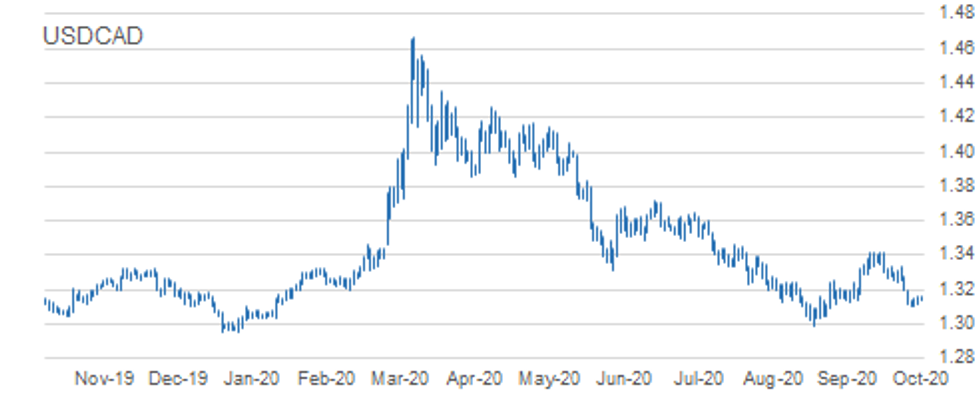
USD/CAD: Bearish Despite Minor Recovery
- RES 4: 1.3341 High Oct 7 and a reversal trigger
- RES 3: 1.3268 High Oct 7 and 50-day EMA
- RES 2: 1.3225 20-day EMA
- RES 1: 1.3202 Oct 9 high
- PRICE: 1.3150 @ 06:23 BST Oct 15
- SUP 1: 1.3099 Low Oct 13
- SUP 2: 1.3095 76.4% retracement of the Sep 1 - 30 rally
- SUP 3: 1.3038 Low Sep 2
- SUP 4: 1.2994 Low Sep 1
USDCAD traded lower Tuesday, extending the pullback that started on Sep 30. The pair has however recently found support but despite the bounce, remains bearish. Recent weakness follows the clear break on Oct 8 of trendline support drawn off the Sep 1 low. 1.3157, a Fibonacci retracement has been cleared paving the way for a move towards 1.3095. Initial resistance is at the Oct 9 high of 1.3202. Still heavy!
KEY LEVELS:
EUR/USD: MNI Key Levels
- *$1.1882 Sep16 high
- *$1.1872/81 Cloud top, Sep21 high/Upper 1.0% 10-dma env
- *$1.1849/56 Upper Boll Band (2%)/100-mma
- *$1.1817/27/31 Oct13 high/Oct12 high/Oct09 high
- *$1.1796/98 50-dma/55-dma
- *$1.1771/73/82 Oct14 high/200-hma/100-hma
- *$1.1756 Intraday high
- *$1.1748 ***CURRENT MARKET PRICE 05:20BST THURSDAY***
- *$1.1745/41 21-dma/Intraday low
- *$1.1720 Oct14 low
- *$1.1696/85 Oct02 low, 61.8% 1.1612-1.1831/Sep30 low, Sep25 high
- *$1.1664/61/46 76.4% 1.1612-1.1831/Sep29 low/Lower 1.0% 10-dma env
- *$1.1630 Lower Bollinger Band (2%)
- *$1.1612/98 Sep25 low/Cloud base, 100-dma
- *$1.1581/75 Jul24 low/Lower Boll Band (3%)
GBP/USD: MNI Key Levels
- *$1.3231 Upper 2.0% 10-dma envelope
- *$1.3203 Upper Bollinger Band (3%)
- *$1.3173/84 Sep08 high/Cloud top
- *$1.3101 Upper Boll Band (2%), Upper 1.0% 10-dma env
- *$1.3083 Oct12 high
- *$1.3064/72 Oct14 high/Oct13 high
- *$1.3022/28/30 50-dma/55-dma/Intraday high
- *$1.3014 ***CURRENT MARKET PRICE 05:35BST THURSDAY***
- *$1.3007/06 Sep16 high, Oct06 high, Intday low, NY Hly low Oct14/100-hma
- *$1.2971/64 200-hma/50% 1.2863-1.3064
- *$1.2952/40 50-mma/200-wma, 61.8% 1.2863-1.3064
- *$1.2910/99 76.4% 1.2863-1.3064/21-dma
- *$1.2870/63 Cloud base/Oct14 low
- *$1.2846/42/38 Oct07 low/Lower 1.0% 10-dma env/Oct02 low
- *$1.2832/31/20 100-dma/61.8% 1.2676-1.3083/Oct01 low
EUR/GBP: MNI Key Levels
- *Gbp0.9162/81 Oct07 high/Sep24 high
- *Gbp0.9156/57/59 Oct01 high/Sep30 high/Upper 1.0% 10-dma env
- *Gbp0.9122/23/32 Oct14 high/Oct08 high/Oct09 high
- *Gbp0.9106 21-dma
- *Gbp0.9068/77 10-dma/200-hma
- *Gbp0.9057/59/60 55-dma/50-dma/100-hma
- *Gbp0.9029/38 Intraday high/100-dma
- *Gbp0.9028 ***CURRENT MARKET PRICE 05:42BST THURSDAY***
- *Gbp0.9020/07 Intraday low/Oct14 low, Cloud top
- *Gbp0.9003/99 Lower Boll Band (2%)/Cloud base
- *Gbp0.8978/67 Lower 1.0% 10-dma env/Sep08 low
- *Gbp0.8953 Lower Bollinger Band (3%)
- *Gbp0.8925 Sep07 low
- *Gbp0.8900/87 Sep04 low/Lower 2.0% 10-dma env
- *Gbp0.8874/66/64 200-dma/Sep03 low/Jun09 low
USD/JPY: MNI Key Levels
- *Y106.08 Cloud base
- *Y106.04 Oct09 high
- *Y105.85 Oct12 high
- *Y105.77 50-dma, 55-dma
- *Y105.58/63/64 Cloud Tenkan Sen/Oct13 high/200-hma
- *Y105.47/52 100-hma/Oct14 high
- *Y105.30/38 Intraday high/21-dma(Expiries 105.20-30 $3.4bln)
- *Y105.28 ***CURRENT MARKET PRICE 05:52BST THURSDAY***
- *Y105.15/09 Cloud Kijun Sen/Intraday low
- *Y105.04 Oct14 low(Expiries 105.00-10 $1.7bln)
- *Y104.94/88 Oct02 low/Sep23 low(Expiries Y104.80-85 $1.6bln)
- *Y104.67 Lower Bollinger Band (2%)
- *Y104.50/41 Lower 1.0% 10-dma envelope/Sep22 low
- *Y104.29 Lower Bollinger Band (3%)
- *Y104.00/94 Sep21 low/200-mma
EUR/JPY: MNI Key Levels
- *Y124.93 Fibo 38.2% 149.78-109.57
- *Y124.77/79 50-dma/55-dma, 50-mma
- *Y124.42/48 Cloud Kijun Sen/Oct13 high
- *Y124.36 200-hma
- *Y124.20/26 Cloud Tenkan Sen/100-hma
- *Y123.94 Oct14 high
- *Y123.77/78 Intraday high/21-dma
- *Y123.73 ***CURRENT MARKET PRICE 05:55BST THURSDAY***
- *Y123.67 Cloud base
- *Y123.47/40 Oct14 low, Intraday low/100-dma
- *Y123.31 Oct05 low
- *Y123.03 Oct02 low, Sep29 low
- *Y122.93 Lower 1.0% 10-dma envelope
- *Y122.45/38 Lower Bollinger Band (2%)/Sep28 low
- *Y122.06/95 Jul20 low/100-wma
AUD/USD: MNI Key Levels
- *$0.7281/82 Upper Boll Band (2%)/Cloud top
- *$0.7263 50-mma*$0.7243/45/54 Oct09 high/200-wma/Sep17 low
- *$0.7235/37 Sep22 high, Oct12 high/Upper 1.0% 10-dma env
- *$0.7204/07/18 55-dma/50-dma/Oct13 high
- *$0.7188/91 100-hma/Oct14 high
- *$0.7160/70/73 21-dma/Intraday high/200-hma
- *$0.7135 ***CURRENT MARKET PRICE 06:01BST THURSDAY***
- *$0.7124/23 Cloud base, Intraday low/Oct08 low
- *$0.7096/94 Oct07 low/Lower 1.0% 10-dma env, 100-dma
- *$0.7070 Sep29 low
- *$0.7029/22 Sep28 low/Lower 2.0% 10-dma env, Lower Boll Band (2%)
- *$0.7006 Sep25 low
- *$0.6973/63 Jul20 low/Jul16 low
- *$0.6957/51 Lower Boll Band (3%)/Lower 3.0% 10-dma env
USD/CAD: MNI Key Levels
- *C$1.3332/41 Upper 1.0% 10-dma env/Oct07 high
- *C$1.3261/73 21-dma/Oct08 high
- *C$1.3242 Oct06 low
- *C$1.3214/26 50-dma/55-dma
- *C$1.3198/02 200-hma/Oct09 high
- *C$1.3163/75 200-wma, Oct14 high/50-mma
- *C$1.3158/62 Intraday high/Cloud base
- *C$1.3147 ***CURRENT MARKET PRICE 06:04BST THURSDAY***
- *C$1.3143/35 Intraday low/100-hma
- *C$1.3117 Oct14 low
- *C$1.3099/87 Oct13 low/Sep08 low
- *C$1.3076/68 Lower Boll Band (2%)/Lower 1.0% 10-dma env
- *C$1.3038 Sep02 low
- *C$1.2994/81 YTD Sep01 low/Lower Boll Band (3%)
- *C$1.2976 Jan08 low
Why MNI
MNI is the leading provider
of intelligence and analysis on the Global Fixed Income, Foreign Exchange and Energy markets. We use an innovative combination of real-time analysis, deep fundamental research and journalism to provide unique and actionable insights for traders and investors. Our "All signal, no noise" approach drives an intelligence service that is succinct and timely, which is highly regarded by our time constrained client base.Our Head Office is in London with offices in Chicago, Washington and Beijing, as well as an on the ground presence in other major financial centres across the world.