-
Policy
Policy
Exclusive interviews with leading policymakers that convey the true policy message that impacts markets.
LATEST FROM POLICY: -
EM Policy
EM Policy
Exclusive interviews with leading policymakers that convey the true policy message that impacts markets.
LATEST FROM EM POLICY: -
G10 Markets
G10 Markets
Real-time insight on key fixed income and fx markets.
Launch MNI PodcastsFixed IncomeFI Markets AnalysisCentral Bank PreviewsFI PiFixed Income Technical AnalysisUS$ Credit Supply PipelineGilt Week AheadGlobal IssuanceEurozoneUKUSDeep DiveGlobal Issuance CalendarsEZ/UK Bond Auction CalendarEZ/UK T-bill Auction CalendarUS Treasury Auction CalendarPolitical RiskMNI Political Risk AnalysisMNI Political Risk - US Daily BriefMNI Political Risk - The week AheadElection Previews -
Emerging Markets
Emerging Markets
Real-time insight of emerging markets in CEMEA, Asia and LatAm region
-
Commodities
-
Credit
Credit
Real time insight of credit markets
-
Data
-
Global Macro
Global Macro
Actionable insight on monetary policy, balance sheet and inflation with focus on global issuance. Analysis on key political risk impacting the global markets.
Global MacroDM Central Bank PreviewsDM Central Bank ReviewsEM Central Bank PreviewsEM Central Bank ReviewsBalance Sheet AnalysisData AnalysisEurozone DataUK DataUS DataAPAC DataInflation InsightEmployment InsightGlobal IssuanceEurozoneUKUSDeep DiveGlobal Issuance Calendars EZ/UK Bond Auction Calendar EZ/UK T-bill Auction Calendar US Treasury Auction Calendar Global Macro Weekly -
About Us
To read the full story
Sign up now for free trial access to this content.
Please enter your details below.
Why MNI
MNI is the leading provider
of intelligence and analysis on the Global Fixed Income, Foreign Exchange and Energy markets. We use an innovative combination of real-time analysis, deep fundamental research and journalism to provide unique and actionable insights for traders and investors. Our "All signal, no noise" approach drives an intelligence service that is succinct and timely, which is highly regarded by our time constrained client base.Our Head Office is in London with offices in Chicago, Washington and Beijing, as well as an on the ground presence in other major financial centres across the world.
Real-time Actionable Insight
Get the latest on Central Bank Policy and FX & FI Markets to help inform both your strategic and tactical decision-making.
Free AccessMNI POLITICAL RISK - Trump Announces Raft Of Key Nominations
BRIEF: EU-Mercosur Deal In Final Negotiations - EC
MNI BRIEF: Limited Economic Impact Of French Crisis - EC
MNI Europe Morning FX Analysis: RBA Decision Knocks AUD
FOREX: RBA Decision Knocks AUD.
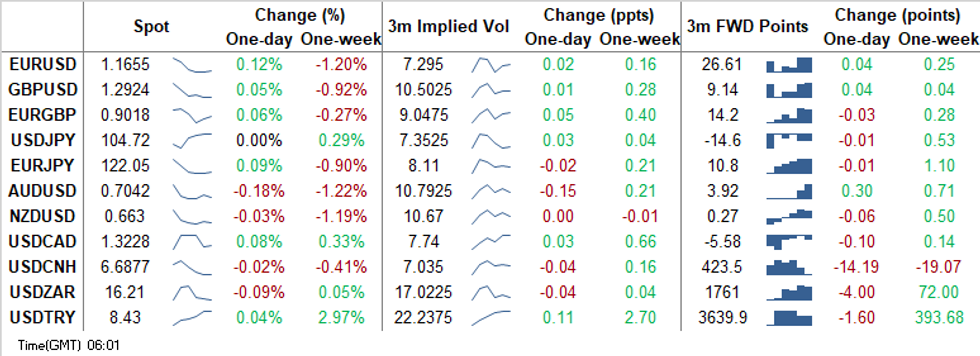
AUD established itself as the worst performer in G10 FX space, following the monetary policy decision from the RBA. The in-line decision to cut the cash rate, 3-Year yield target & TFF rate to 0.1% was coupled with the reduction of the rate applied to ES balances to zero and the announcement of an intention to buy A$100bn worth of ACGBs from the 5-10 Year sector over the next six months (i.e. more aggressive horizon than expected). Furthermore, the Bank tweaked its forward guidance, forecasting no cash rate hikes for at least three years.
- Apart from the RBA decision, news & data flow was light and activity was limited by a market holiday in Japan. Most G10 pairs were happy to hold relatively tight ranges.
- The U.S. election steals the spotlight today, with market jitters reflected in spikes in implied volatilities across multiple USD crosses. Offshore yuan grabbed attention as one-week tenor for USD/CNH surged to the highest level since BBG started running the data series in 2011.
- Spot USD/CNH hugged a fairly narrow range overnight, recouping its initial losses after a softer than expected PBoC fix.
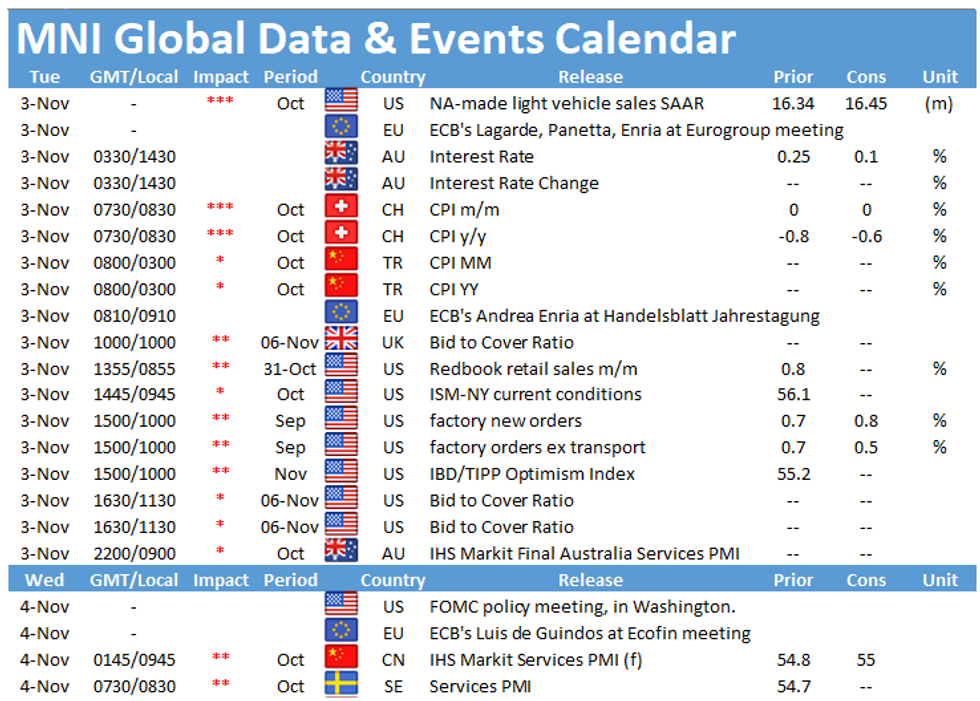
- Focus turns to the US election, though results not due until late Tuesday/Wednesday. U.S. factory orders, final durable goods orders, as well as comments from ECB's Knot and Riksbank's Ingves & Breman in view. Eurogroup meeting 1400GMT. Lagarde and Penetta attend video conference. Press conference 1800GMT.
MNI FX TECHNICALS
EUR/USD: 1.1612 Key Support Remains Exposed
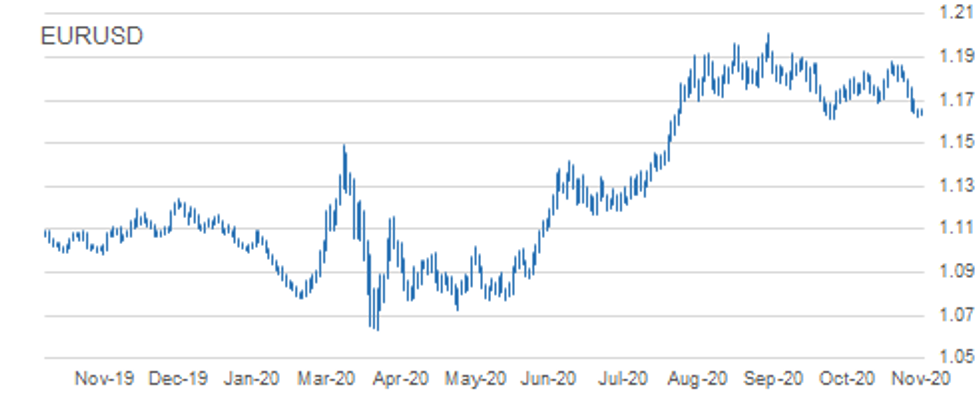
- RES 4: 1.1881 High Oct 21 and the bull trigger
- RES 3: 1.1798 High Oct 28
- RES 2: 1.1749 20-day EMA
- RES 1: 1.1704 High Oct 30
- PRICE: 1.1657 @ 05:43 GMT Nov 3
- SUP 1: 1.1623 Low Nov 2
- SUP 2: 1.1612 Low Sep 25 and the bear trigger
- SUP 3: 1.1576 0.764 proj of Sep 1 - 25 sell-off from Oct 21 high
- SUP 4: 1.1541 Low Jul 23
EURUSD maintains a bearish outlook with attention on the key support at 1.1612. Last week's sell-off confirmed a clear breach of the S/T trendline support drawn off the Sep 28 low. The break, confirmed by a move below the Oct 29 low of 1.1718 as well as a key support at 1.1689, Oct 15 low strengthens the bearish case and has opened 1.1612, Sep 25 low and the primary bear trigger. Initial resistance is at 1.1704, Friday's intraday high.
GBP/USD: Still Vulnerable
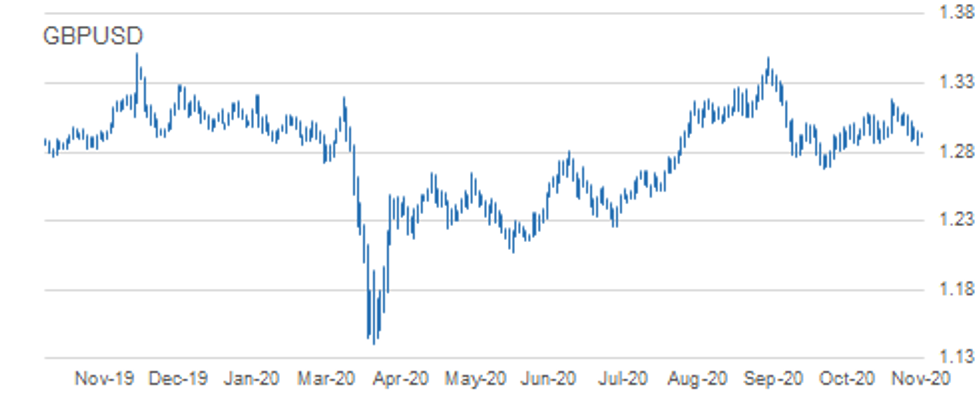
- RES 4: 1.3270 2.0% 10-dma envelope
- RES 3: 1.3177 High Oct 21 and the bull trigger
- RES 2: 1.3080 High Oct 27 and key near-term resistance
- RES 1: 1.3026 High Oct 29
- PRICE: 1.2924 @ 05:51 GMT Nov 3
- SUP 1: 1.2855 Low Nov 2
- SUP 2: 1.2863 Low Oct 14 and key near-term support
- SUP 3: 1.2806 Low Sep 30
- SUP 4: 1.2794 76.4% retracement of the Sep 23 - Oct 21 rally
GBPUSD outlook remains bearish following last week's extension lower and the pair is trading at the lower end of its recent range. The breach last week of 1.2940, Oct 21 low suggests scope for a deeper pullback with attention on 1.2863, Oct 14 low and a key S/T support. Clearance of this level would open 1.2794, a Fibonacci retracement. Initial firm resistance is seen at 1.3080, Oct 27 high. A break would ease bearish pressure and open 1.3177, Oct 21 high.
EUR/GBP: Bearish Trend Sequence Intact
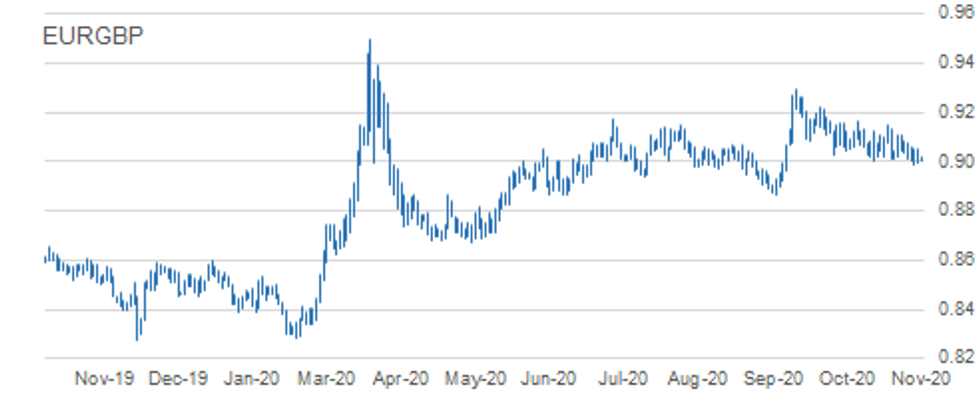
- RES 4: 0.9146/62 1.0% 10-dma envelope / High Oct 7
- RES 3: 0.9149 Oct 20 high
- RES 2: 0.9107 High Oct 23
- RES 1: 0.9062 50-day EMA
- PRICE: 0.9019 @ 05:56 GMT Nov 3
- SUP 1: 0.8984 Low Oct 30
- SUP 2: 0.8967 76.4% retracement of the Sep 3 - 11 rally
- SUP 3: 0.8925 Low Sep 7
- SUP 4: 0.8900 Low Sep 4
EURGBP traded lower Friday and cleared 0.9007, Oct 14 low. This confirmed a resumption of the downtrend that has been in place since reversing lower on Sep 11. The break lower maintains a bearish price sequence of lower lows and lower highs. This has exposed 0.8967 next, a retracement. Key short-term resistance is at 0.9149, Oct 20 high. Clearance of this level would undermine bearish conditions. Initial resistance is 0.9062, 50-day EMA.
USD/JPY: Corrective Bounce
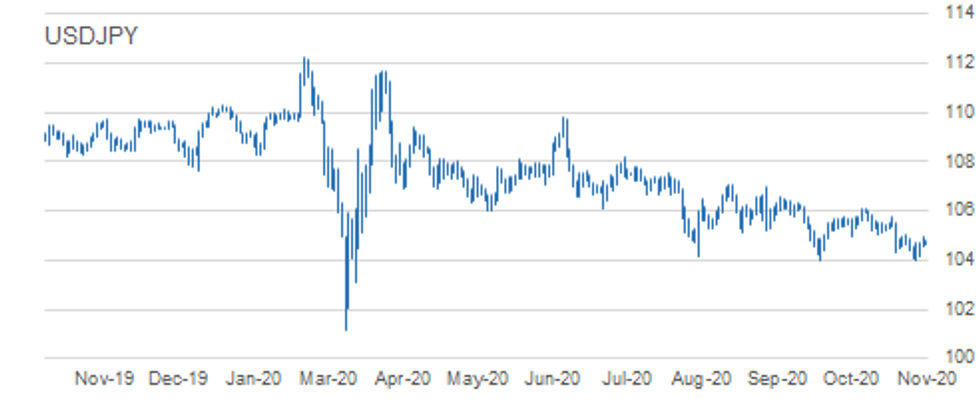
- RES 4: 105.75 High Oct 20
- RES 3: 105.46/53 50-dma / High Oct 21
- RES 2: 105.06 High Oct 26 and key near-term resistance
- RES 1: 104.95 High Nov 2
- PRICE: 104.72 @ 06:03 GMT Nov 3
- SUP 1: 104.00 Low Sep 21 and the bear trigger
- SUP 2: 103.67 76.4% retracement of the Mar 9 - 24 rally
- SUP 3: 103.09 Low Mar 12
- SUP 4: 102.02 Low Mar 10
USDJPY gains are considered corrective. The outlook remains bearish with attention on the key 104.00 handle, Sep 21 low. Clearance of this support would suggest scope for a deeper USD sell-off within the bear channel drawn off the Mar 24 high. A break lower would also confirm a resumption of the current downtrend and maintain the bearish price sequence of lower lows and lower highs. Firm near-term resistance is at 105.06.
EUR/JPY: Bearish Focus
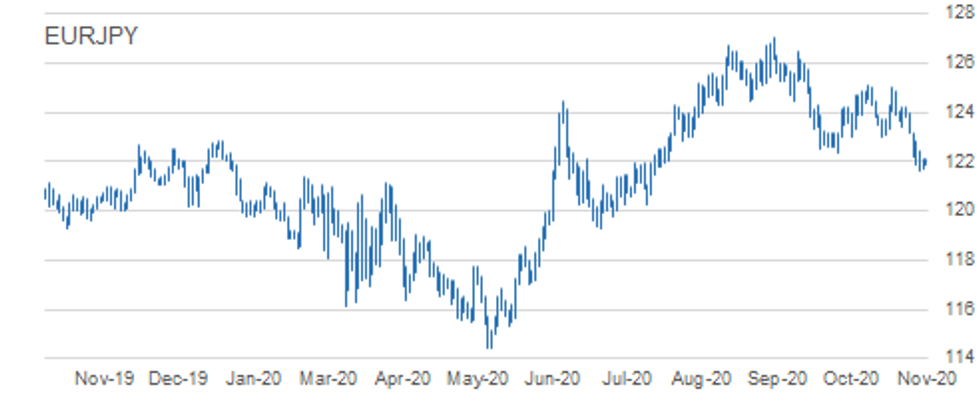
- RES 4: 123.75 50-day EMA
- RES 3: 123.36 20-day EMA
- RES 2: 123.19 High Oct 28
- RES 1: 122.46 High Oct 30
- PRICE: 122.06 @ 06:09 GMT Nov 3
- SUP 1: 121.50 0.764 proj of Sep 1 - 28 decline from Oct 9 high
- SUP 2: 120.68 Bear channel base drawn off the Sep 1 high
- SUP 3: 120.39 1.000 proj of Sep 1 - 28 decline from Oct 9 high
- SUP 4: 120.27 Low Oct 10
EURJPY maintains a bearish tone following last week's sell-off. The cross has cleared support at 123.03/02 and 122.38, Sep 28 low. This move lower confirmed a resumption of the downleg that started Sep 1. Scope is seen for weakness towards 121.50 next, a Fibonacci projection. Further out, 120.39 is on the radar, also a Fibonacci projection. Initial resistance is at 122.46, Friday's high.
AUD/USD: Maintains A Bearish Theme
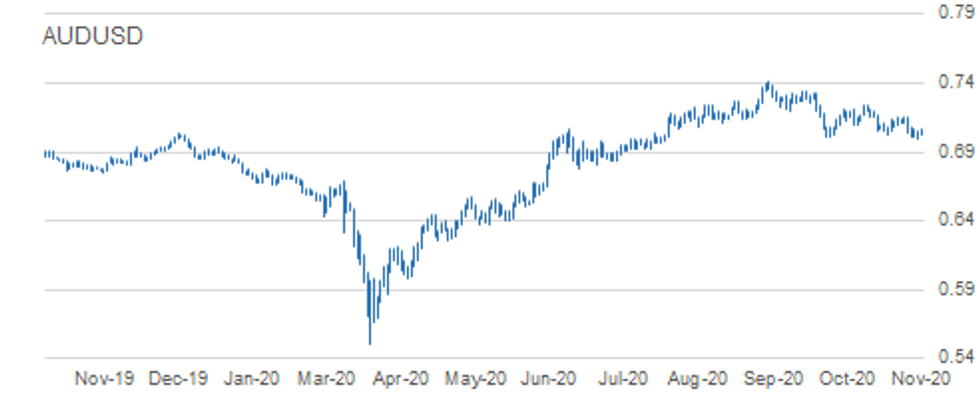
- RES 4: 0.7243 High Oct 10 and a key resistance
- RES 3: 0.7218 High Oct 13
- RES 2: 0.7132/58 Trendline drawn off the Sep 1 high / High Oct 23
- RES 1: 0.7076 High Oct 29
- PRICE: 0.7039 @ 06:12 GMT Nov 3
- SUP 1: 0.6991 Low Nov 2
- SUP 2: 0.6965 23.6% retracement of the Mar - Sep rally
- SUP 3: 0.6941 2.0% 10-dma envelope
- SUP 4: 0.6921 Low Jul 14
AUDUSD maintains a bearish theme. The pair has recently pulled away from trendline resistance drawn off the Sep 1 high and importantly has yesterday traded below 0.7000, signalling a clear breach of former support at 0.7006, Sep 25 low and 0.7002, Oct 29 low. The break lower has opened 0.6965 next, a Fibonacci retracement. On the upside, trendline resistance intersects at 0.7132 where a break is required to reverse the trend.
USD/CAD: Pullback Considered Corrective
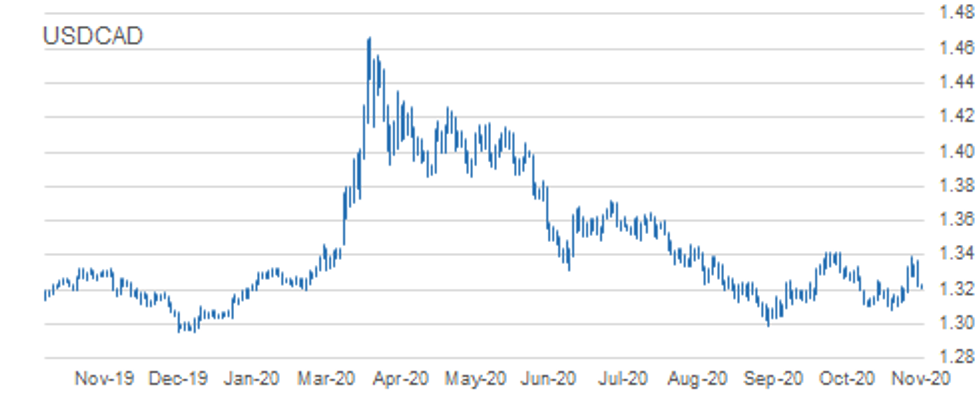
- RES 4: 1.3546 200-dma
- RES 3: 1.3476 2.0% 10-dma envelope
- RES 2: 1.3421 High Sep 30 and primary resistance
- RES 1: 1.3390 High Oct 29
- PRICE: 1.3231 @ 06:21 GMT Nov 3
- SUP 1: 1.3180 Low Oct 28
- SUP 2: 1.3154 76.4% retracement of the Oct 21 - 29 rally
- SUP 3: 1.3109/3081 Low Oct 23 / Low Oct 21 and the bear trigger
- SUP 4: 1.3047 Low Sep 7
USDCAD sold off sharply yesterday however, despite this pullback a bullish theme remains intact. Last week's break of key short-term resistance at 1.3259, Oct 15 high as well as the break of 1.3341, Oct 7 high signals scope for a climb towards 1.3421 next, Sep 30 high and a primary resistance. Initial firm support is seen at 1.3180, Oct 28 low. A break of this level is required to undermine the developing bullish tone and expose 1.3081, Oct 21 low.
MNI KEY LEVELS
EUR/USD: MNI Key Levels
- $1.1779/83 50-dma, Cloud top/55-dma
- $1.1760 Oct20 low
- $1.1753/58/59 200-hma/21-dma/Oct29 high
- $1.1736 Fibo 38.2% 1.3993-1.0341
- $1.1704/18 Oct30 high/Oct28 low
- $1.1683/95 100-hma/Cloud base
- $1.1655/56/61 Intraday high/Nov02 high/100-dma
- $1.1652 ***CURRENT MARKET PRICE 05:12BST TUESDAY***
- $1.1633/32 Lower 1.0% 10-dma env/Intraday low
- $1.1623/22/15 Nov02 low/Lower Boll Band (2%)/Sep28 low
- $1.1612 Sep25 low
- $1.1581 Jul24 low
- $1.1553/41 Lower Boll Band (3%)/Jul23 low
- $1.1515/07 Lower 2.0% 10-dma env/Jul22 low
- $1.1423/13 Jul21 low/200-wma
GBP/USD: MNI Key Levels
- $1.3026 Oct29 high
- $1.3002 55-dma
- $1.2990/97/99 50-dma/Cloud top/200-hma
- $1.2978/88 21-dma/Oct30 high
- $1.2960 Cloud base
- $1.2949/50/56 50-mma/200-wma/Nov02 high
- $1.2937/45 Intraday high/100-hma
- $1.2921 ***CURRENT MARKET PRICE 05:20BST TUESDAY***
- $1.2911 Intraday low
- $1.2882/74 100-dma/Lower 1.0% 10-dma env
- $1.2855/46 Nov02 low/Oct07 low, Lower Boll Band (2%)
- $1.2838 Oct02 low
- $1.2820 Oct01 low
- $1.2806 Sep30 low
- $1.2781/77 Sep24 high/Lower Boll Band (3%)
EUR/GBP: MNI Key Levels
- Gbp0.9127/28 Upper 1.0% 10-dma env/Upper Boll Band (2%)
- Gbp0.9101/06/07 Cloud top/Oct26 high/Oct23 high
- Gbp0.9085 Oct27 high
- Gbp0.9068/76/79 50-dma/Oct28 high/Cloud base
- Gbp0.9059/60/63 Oct29 high/21-dma/55-dma
- Gbp0.9041/49/53 200-hma/Nov02 high/100-dma, Oct30 high
- Gbp0.9020/25/35 Intraday high/100-hma/10-dma
- Gbp0.9017 ***CURRENT MARKET PRICE 05:25BST TUESDAY***
- Gbp0.9006/95 Intraday low/Nov02 low
- Gbp0.8986/84 Lower Boll Band (2%)/Oct30 low
- Gbp0.8967 Sep08 low
- Gbp0.8950/46 Lower Boll Band (3%)/Lower 1.0% 10-dma env
- Gbp0.8925/11 Sep07 low/200-dma
- Gbp0.8900 Sep04 low
- Gbp0.8866/64/56 Sep03 low/Jun09 low/Lower 2.0% 10-dma env
USD/JPY: MNI Key Levels
- Y105.43 50-dma
- Y105.16 Cloud base
- Y105.12 21-dma
- Y105.07 Cloud Kijun Sen
- Y105.06 Oct26 high
- Y104.95 Nov02 high
- Y104.80 Intraday high
- Y104.72 ***CURRENT MARKET PRICE 05:30BST TUESDAY***
- Y104.66/63/55 Intraday low/200-hma/Cloud Tenkan Sen
- Y104.54 Nov02 low
- Y104.53 100-hma
- Y104.13 Oct30 low
- Y104.07 Lower Bollinger Band (2%)
- Y104.03 Oct29 low
- Y104.00 YTD low
EUR/JPY: MNI Key Levels
- Y123.36 Cloud Kijun Sen
- Y123.19 Oct28 high
- Y122.97 200-hma
- Y122.93 Cloud Tenkan Sen
- Y122.88 Oct29 high
- Y122.46 Oct30 high
- Y122.09/13/15 Intraday high/100-hma/Nov02 high
- Y122.09 ***CURRENT MARKET PRICE 05:36BST TUESDAY***
- Y121.86/78 Intraday low/100-wma
- Y121.75 Lower 1.0% 10-dma envelope
- Y121.70 Nov02 low
- Y121.62 Oct30 low
- Y121.61 Lower Bollinger Band (2%)
- Y121.47 Jul14 low
- Y121.18 200-dma
AUD/USD: MNI Key Levels
- $0.7170/81 Oct15 high/50-dma, 55-dma
- $0.7153/57/58 Upper 1.0% 10-dma env/Oct28 high/Oct23 high
- $0.7110/16/18 21-dma/100-dma/76.4% 0.7157-0.6991
- $0.7094 61.8% 0.7157-0.6991
- $0.7074/76/84 50% 0.7157-0.6991/Oct29 high/200-hma
- $0.7063/72 Intraday high/Oct30 high
- $0.7043 100-hma
- $0.7043 ***CURRENT MARKET PRICE 05:45BST TUESDAY***
- $0.7028 Intraday low
- $0.7012 Lower 1.0% 10-dma envelope
- $0.6991/90 Nov02 low/Lower Boll Band (2%)
- $0.6973/63 Jul20 low/Jul16 low
- $0.6941/30 Lower 2.0% 10-dma env/Lower Boll Band (3%)
- $0.6921 Jul14 low
- $0.6893 100-wma
USD/CAD: MNI Key Levels
- C$1.3419/21 Sep29 high/Aug04 high, Sep30 high
- C$1.3401 Upper Bollinger Band (3%)
- C$1.3370/76/90 Nov02 high/100-wma/Oct29 high
- C$1.3354 Upper 1.0% 10-dma envelope
- C$1.3324/32 100-dma/Upper Boll Band (2%)
- C$1.3278/97/98 Oct29 low/Cloud top/100-hma
- C$1.3231/34/40 200-hma/Intraday high/Cloud base
- C$1.3228 ***CURRENT MARKET PRICE 05:54BST TUESDAY***
- C$1.3208/07/02 50-dma/55-dma, Intraday low/21-dma
- C$1.3199/80 61.8% 1.3081-1.3390/Oct28 low, 50-mma
- C$1.3160/54/42 200-wma/76.4% 1.3081-1.3390/Oct27 low
- C$1.3126/24/09 Oct26 low/Oct22 low/Oct23 low
- C$1.3090/81 Lower 1.0% 10-dma env/Oct21 low
- C$1.3060/38 Lower Boll Band (2%)/Sep02 low
- C$1.2994/92 Sep01 low/Lower Boll Band (3%)
OPTIONS: Expiries for Nov3 NY cut 1000ET (Source DTCC)
- EUR/USD: $1.1435-50(E529mln), $1.1590-00(E620mln-EUR puts), $1.1650(E622mln), $1.1725(E585mln-EUR puts), $1.1895-1.1905(E1.5bln)
- USD/JPY: Y104.50-55($540mln), Y105.45-50($1.4bln)
- GBP/USD: $1.2850(Gbp684mln-GBP puts), $1.3000(Gbp456mln), $1.3100(Gbp631mln-GBP calls)
- EUR/GBP: Gbp0.9000(E720mln-EUR puts)
- USD/CHF: Chf0.9200($675mln-USD calls)
- AUD/USD: $0.7000(A$706mln), $0.7035-55(A$847mln)
- USD/CAD: C$1.2995-1.3005($550mln)
- USD/CNY: Cny6.5334($1.2bln), Cny6.72($500mln)
Larger Option Pipeline
- EUR/USD: Nov06 $1.1600(E1.7bln), $1.1795-05(E1.4bln)
- USD/JPY: Nov04 Y105.00($1.2bln), Y106.00-10($1.3bln); Nov05 Y105.00($934mln), Y106.06-09($1.6bln);
Nov06 Y104.89-00($1.0bln) - EUR/JPY: Nov05 Y124.50(E1.1bln)
- USD/CNY: Nov05 Cny6.75($1.1bln), Cny6.80($1.9bln), Cny6.85($1.3bln); Nov06 Cny6.70($1.2bln)
To read the full story
Sign up now for free trial access to this content.
Please enter your details below.
Why MNI
MNI is the leading provider
of intelligence and analysis on the Global Fixed Income, Foreign Exchange and Energy markets. We use an innovative combination of real-time analysis, deep fundamental research and journalism to provide unique and actionable insights for traders and investors. Our "All signal, no noise" approach drives an intelligence service that is succinct and timely, which is highly regarded by our time constrained client base.Our Head Office is in London with offices in Chicago, Washington and Beijing, as well as an on the ground presence in other major financial centres across the world.
